ACPD
11, 30949–30987, 2011Lidar and radar observations of dark
and bright bands
P. Di Girolamo et al.
Title Page
Abstract Introduction
Conclusions References
Tables Figures
◭ ◮
◭ ◮
Back Close
Full Screen / Esc
Printer-friendly Version Interactive Discussion
Discussion
P
a
per
|
Dis
cussion
P
a
per
|
Discussion
P
a
per
|
Discussio
n
P
a
per
Atmos. Chem. Phys. Discuss., 11, 30949–30987, 2011 www.atmos-chem-phys-discuss.net/11/30949/2011/ doi:10.5194/acpd-11-30949-2011
© Author(s) 2011. CC Attribution 3.0 License.
Atmospheric Chemistry and Physics Discussions
This discussion paper is/has been under review for the journal Atmospheric Chemistry and Physics (ACP). Please refer to the corresponding final paper in ACP if available.
Lidar and radar measurements of the
melting layer in the frame of the
Convective and Orographically-induced
Precipitation Study: observations of dark
and bright band phenomena
P. Di Girolamo1, D. Summa1, R. Bhawar1, T. Di Iorio2, E. G. Norton3, G. Peters4, and Y. Dufournet5
1
Dipartimento di Ingegneria e Fisica dell’Ambiente, Universit `a degli Studi della Basilicata, Potenza, Italy
2
Dipartimento di Fisica, Universit `a degli Studi di Roma “La Sapienza”, Roma, Italy
3
School of Earth, Atmospheric & Environmental Sciences, University of Manchester, Manchester, UK
4
Meteorologisches Institut, Universit ¨at Hamburg, Hamburg, Germany
5
ACPD
11, 30949–30987, 2011Lidar and radar observations of dark
and bright bands
P. Di Girolamo et al.
Title Page
Abstract Introduction
Conclusions References
Tables Figures
◭ ◮
◭ ◮
Back Close
Full Screen / Esc
Printer-friendly Version Interactive Discussion
Discussion
P
a
per
|
Dis
cussion
P
a
per
|
Discussion
P
a
per
|
Discussio
n
P
a
per
|
Received: 20 August 2011 – Accepted: 31 October 2011 – Published: 21 November 2011
Correspondence to: P. Di Girolamo (digirolamo@unibas.it)
ACPD
11, 30949–30987, 2011Lidar and radar observations of dark
and bright bands
P. Di Girolamo et al.
Title Page
Abstract Introduction
Conclusions References
Tables Figures
◭ ◮
◭ ◮
Back Close
Full Screen / Esc
Printer-friendly Version Interactive Discussion
Discussion
P
a
per
|
Dis
cussion
P
a
per
|
Discussion
P
a
per
|
Discussio
n
P
a
per
Abstract
During the Convective and Orographically-induced Precipitation Study (COPS), lidar dark and bright bands were observed by the University of BASILicata Raman lidar sys-tem (BASIL) during several intensive (IOPs) and special (SOPs) observation periods (among others, 23 July, 15 August, and 17 August 2007). Lidar data were supported
5
by measurements from the University of Hamburg cloud radarMIRA 36(36 GHz), the University of Hamburg dual-polarization micro rain radars (24.1 GHz) and the Univer-sity of Manchester UHF wind profiler (1.29 GHz). Results fromBASILand the radars for 23 July 2007 are illustrated and discussed to support the comprehension of the mi-crophysical and scattering processes responsible for the appearance of the lidar and
10
radar dark and bright bands. Simulations of the lidar dark and bright band based on the application of concentric/eccentric sphere Lorentz-Mie codes and a melting layer model are also provided. Lidar and radar measurements and model results are also compared with measurements from a disdrometer on ground and a two-dimensional cloud (2DC) probe on-board the ATR42 SAFIRE.
15
1 Introduction
Changes in scattering properties of precipitating particles are found to take place dur-ing the snowflake-to-raindrop transition in the proximity of the freezdur-ing level. A maxi-mum in radar reflectivity, known as the radar bright band, is observed in the microwave domain, while a minimum in lidar echoes appears at optical wavelengths, this
phe-20
nomenon being referred as lidar dark band (Sassen and Chen, 1995).
The radar bright band has been known and studied for more than three decades and it is presently a well understood phenomenon (Battan, 1973; Meneghini and Liao, 2000). The radar bright band phenomenon is dominated by Rayleigh dielectric scat-tering effects. As snowflakes descend below the freezing level inside the melting layer,
25
ACPD
11, 30949–30987, 2011Lidar and radar observations of dark
and bright bands
P. Di Girolamo et al.
Title Page
Abstract Introduction
Conclusions References
Tables Figures
◭ ◮
◭ ◮
Back Close
Full Screen / Esc
Printer-friendly Version Interactive Discussion
Discussion
P
a
per
|
Dis
cussion
P
a
per
|
Discussion
P
a
per
|
Discussio
n
P
a
per
|
of water exceeds that of ice by a factor of approximately 5 (Rogers and Yau, 1989). Lower in the melting layer, snowflakes collapse into raindrops; since rain drops fall faster than snowflakes, their volume concentration is reduced. This reduction in con-centration is the primary cause for the decrease of reflectivity observed in the lower part of the melting layer. While the radar bright band is ubiquitous in the S and L
5
band, only intermittent evidence is found in the K and W bands (Sannen et al., 2005), because of the dominance in these latter bands of non-Rayleigh scattering effects.
Unlike the radar bright band, the lidar dark band has been poorly investigated and, to date, no systematic and coordinated observations are available. Lidar observa-tions of the lidar dark band have been reported by Sassen and Chen (1995), Demoz
10
et al. (2000) and Roy and Bissonnette (2001). Model simulations of this phenomenon have been provided by several authors (Di Girolamo et al., 2003; Griaznov et al., 2004). The lidar dark band is believed to be the result of two conflicting microphysical pro-cesses: a) the structural collapse of severely melted snowflakes, leading to a decrease of lidar backscattering due to the reduced particles size and concentration and b) the
15
completion of the melting process, leading to an increase of lidar backscattering as-sociated with spherical particle backscattering mechanisms coming into prominence (Sassen and Chen, 1995). The radar bright band peak occurs in the melting region, just above (approx. 200 m) the lidar dark-band minimum, this position being close to where radar Doppler velocity reaches its plateau. A lidar bright band has been also
20
occasionally reported (Sassen et al., 2005; Di Girolamo et al., 2003), associated with additional scattering processes involving melting hydrometeors.
A comprehensive study of the dark and bright band phenomena has been pub-lished by Sassen et al. (2005), where the authors report measurements performed by a single-wavelength (532 nm) backscatter lidar system and a three-wavelength Doppler
25
ACPD
11, 30949–30987, 2011Lidar and radar observations of dark
and bright bands
P. Di Girolamo et al.
Title Page
Abstract Introduction
Conclusions References
Tables Figures
◭ ◮
◭ ◮
Back Close
Full Screen / Esc
Printer-friendly Version Interactive Discussion
Discussion
P
a
per
|
Dis
cussion
P
a
per
|
Discussion
P
a
per
|
Discussio
n
P
a
per
performed during COPS by BASIL and MIRA 36, respectively, and are reported in the present paper together with multi-wavelength lidar measurements of the particle backscattering.
2 Lidar and radar systems
The measurements illustrated in this paper were performed in the framework of COPS
5
– Convective and Orographically-induced Precipitation Study – held in Southern Ger-many and Eastern France in the period 1 June–31 August 2007 (Wulfmeyer et al., 2008; Richard et al., 2009). COPS was conceived with the primary goal of advanc-ing the quality of forecasts of orographically induced convective precipitation by four-dimensional observations and modeling of its life cycle (Kottmeier et al., 2008; Kalthoff
10
et al., 2009; Wulfmeyer et al., 2011). BASILwas deployed throughout the duration of COPS in Supersite R (Achern, Rhine Valley, Lat: 48.64◦N, Long: 8.06◦E, Elev.: 140 m).
The system operated between 25 May and 30 August 2007 and collected more than 500 h of measurements, distributed over 58 measurement days. Quicklooks of the data are visible on the COPS Website (http://www.cops2007.de/), under Operational
15
Products, while the data can be downloaded from the World Data Center for Climate (http://cera-www.dkrz.de/WDCC/ui/BrowseExperiments.jsp?proj=COPS) or requested to the authors.
The major feature ofBASILis represented by its capability to perform high-resolution and accurate measurements of atmospheric temperature and water vapour, both in
20
daytime and night-time, based on the application of the rotational and vibrational Ra-man lidar techniques in the UV (Di Girolamo et al., 2004, 2006, 2009a; Bhawar et al., 2011). Besides temperature and water vapour,BASIL measures particle backscatter at 355, 532 and 1064 nm, particle extinction coefficient at 355 and 532 nm and parti-cle depolarization at 355 and 532 nm (Maestri et al., 2010; Griaznov et al., 2007; Di
25
conser-ACPD
11, 30949–30987, 2011Lidar and radar observations of dark
and bright bands
P. Di Girolamo et al.
Title Page
Abstract Introduction
Conclusions References
Tables Figures
◭ ◮
◭ ◮
Back Close
Full Screen / Esc
Printer-friendly Version Interactive Discussion
Discussion
P
a
per
|
Dis
cussion
P
a
per
|
Discussion
P
a
per
|
Discussio
n
P
a
per
|
vative operation of the system till shortly before the precipitation reaches the ground allowed us to capture several precipitation episodes involving melting hydrometeors.
During COPS, lidar data were supported by measurements from the University of Hamburg cloud radar MIRA 36 (36 GHz, 0.83 cm, Ka-band), the University of Hamburg dual-polarization micro rain radars (24.1 GHz, 1.24 cm, K-band) and the University of
5
Manchester UHF wind profiler (1.29 GHz, 23.24 cm, UHF band) (Norton et al., 2006). The three zenith-pointing radars represent a unique combination of microwave sensors. Atmospheric probing at the shortest wavelengths (0.83 and 1.24 cm) is sensitive to cloud droplets and ice crystals. In contrast to the K- and Ka-band radars, the UHF radar (23.24 cm) cannot generally observe the particles suspended in a cloud, but
10
rather observes the larger precipitation particles, whose returned radar signals can be treated relatively simply with Rayleigh scattering theory. It should be pointed out that none of the previously reported measurements of the lidar and radar dark/bright bands could rely on multi-wavelength lidar backscatter, extinction and depolarization data, as well as on multi-wavelength radar reflectivity, depolarization and Doppler velocity data.
15
Ancillary information on the state of the atmosphere was provided by radiosondes, launched every three hours during each measurement session, as well as by a sodar and a microwave radiometer. Additional information on precipitating hydrometeors are obtained from a disdrometer, located on ground in the proximity of the lidar and the radars, and a two-dimensional cloud (2DC) probe (Appendix A), on-board the
scientif-20
ically equipped aircraft ATR42 from Service des Avions Franc¸ais Instrument ´es pout la Recherche en Environnement (SAFIRE), whose participation to COPS was supported by the European Commission under the European Fleet for Airborne Research (EU-FAR) program of the 7th Framework Program. This large “ensemble” of instruments makes the collected dataset unique for the purpose of studying precipitating
hydrome-25
ACPD
11, 30949–30987, 2011Lidar and radar observations of dark
and bright bands
P. Di Girolamo et al.
Title Page
Abstract Introduction
Conclusions References
Tables Figures
◭ ◮
◭ ◮
Back Close
Full Screen / Esc
Printer-friendly Version Interactive Discussion
Discussion
P
a
per
|
Dis
cussion
P
a
per
|
Discussion
P
a
per
|
Discussio
n
P
a
per
3 Results
3.1 Lidar and radar measurements
During COPS, lidar dark and bright bands were observed by the Univ. of BASILicata Raman lidar system (BASIL) during several IOPs and SOPs (among others, 23 July, 15 August, and 17 August). However, for the purpose of this paper we focused our
at-5
tention on the measurements performed on 23 July 2007 (IOP 10). A forthcoming pa-per will be dedicated to the extension of the analysis to the complete set of dark/bright band cases.
Figure 1 illustrates the time evolution of BASIL measurements of the particle backscatter ratio (Di Girolamo et al., 1999) at 1064 nm over a period of approximately
10
1.5 h from 13:00 UTC to 14:35 UTC on 23 July 2007. The figure reveals the pres-ence of stratiform clouds, with cloud base at 3.4–3.8 km above ground level (a.g.l., here and afterwards in the text altitudes are expressed as a.g.l.). Around 14:15 UTC hydrometeors start precipitating from clouds. On 23 July 2007, the COPS area was affected by a low pressure system that developed over the eastern North Atlantic and
15
approached the area in the evening. Ahead of the low pressure system, midlevel strat-iform clouds reached the COPS area in the afternoon and stratstrat-iform rainfall events took place. These conditions are more favourable for the observation of radar and lidar melting-layer phenomena than in the presence of strong thunderstorms, as in fact in this latter case radar and lidar signals may be overwhelmed by the strong hydrometeors
20
echoes.
The freezing level, identified through the radiosonde launched at 14:06 UTC, is lo-cated at 3.5 km a.g.l. (black arrow in Fig. 1). The dark band appears as a horizon-tal line of smaller particle backscatter values at 2.8–2.9 km a.g.l. between 14:15 and 14:35 UTC (red arrow in Fig. 1). Lidar measurements were stopped at 14:35 UTC
be-25
ACPD
11, 30949–30987, 2011Lidar and radar observations of dark
and bright bands
P. Di Girolamo et al.
Title Page
Abstract Introduction
Conclusions References
Tables Figures
◭ ◮
◭ ◮
Back Close
Full Screen / Esc
Printer-friendly Version Interactive Discussion
Discussion
P
a
per
|
Dis
cussion
P
a
per
|
Discussion
P
a
per
|
Discussio
n
P
a
per
|
appear also in the lidar measurements of particle backscattering at 355 and 532 and particle depolarization at 355 nm (Fig. 7).
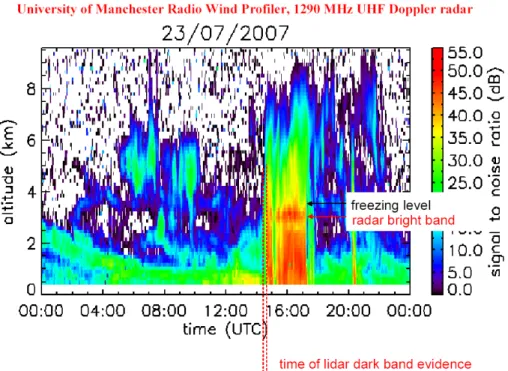
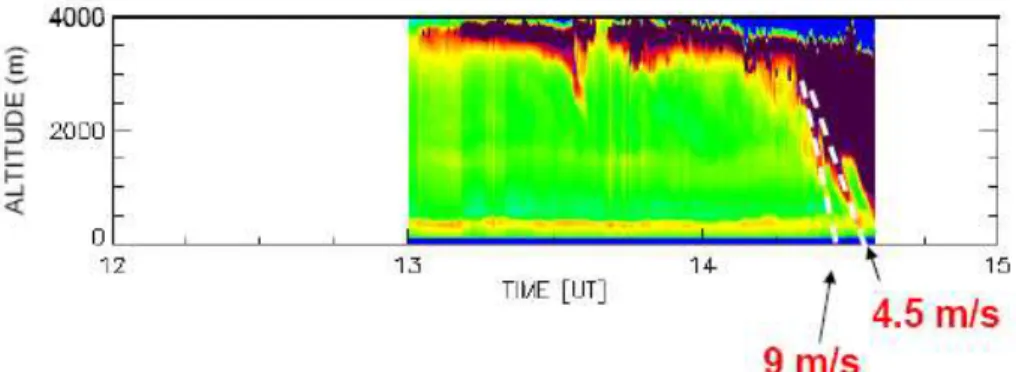
Clear evidence of a bright band is found in radar measurements from the wind pro-filer. Figure 2 shows the evolution with time of the radar reflectivity at 1.29 GHz (ex-pressed in dB) as measured by the University of Manchester wind profiler in the time
5
frame from 00:00 UTC to 24:00 UTC on 23 July 2007. The radar bright band peak (red arrow in Fig. 2) occurs in the melting region at∼3.0 km a.g.l., just above (100–200 m)
the lidar dark-band minimum.
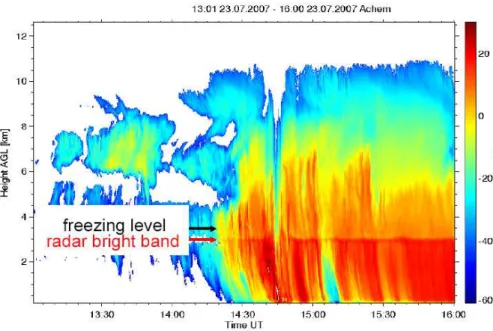
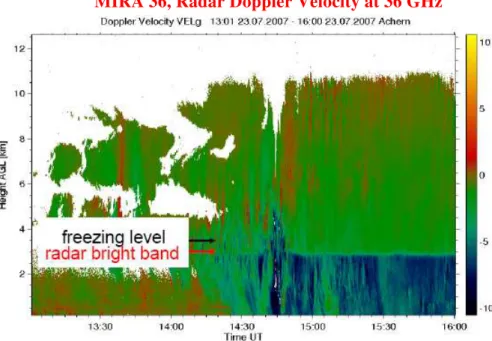
Figure 3 shows the time evolution of the radar reflectivity at 36 GHz from 13:00 UTC to 16:00 UTC on 23 July 2007 as measured byMIRA 36. The radar bright band appears
10
as a reflectivity peak around 3.0 km a.g.l. (red arrow in Fig. 3); however, the maximum is less marked than at 1.29 GHz. In this regard we wish to recall that the radar bright band is always visible in the S band and longer wavelengths, while it is intermittently found at shorter wavelengths (Sannen et al., 2005), because of the dominance of non-Rayleigh scattering effects in large water-coated snowflakes that are highly located in
15
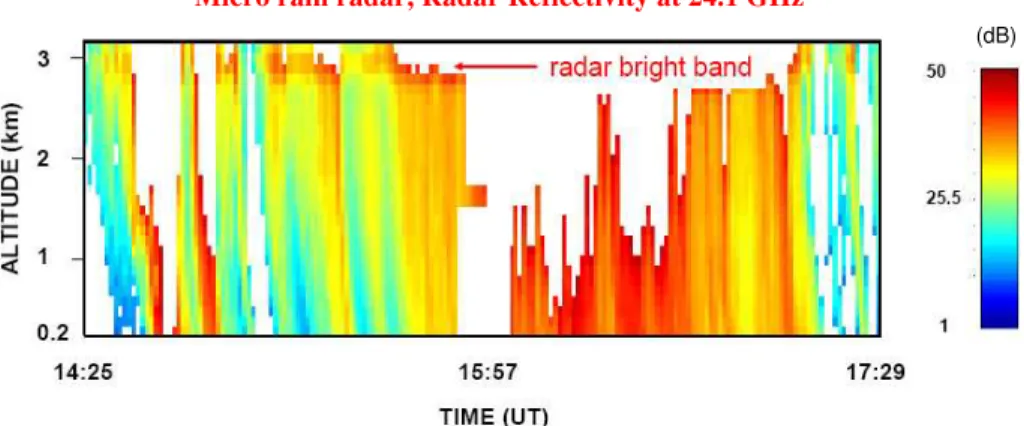
the melting layer. Figure 4 shows the time evolution of the radar reflectivity at 24.1 GHz from 14:25 UTC to 17:41 UTC on 23 July 2007 as measured by the micro rain radar. Again, the radar bright band appears as a reflectivity peak around 3.0 km a.g.l. (red arrow in Fig. 4).
Although we show the position of the freezing level based on the radio sounding in
20
all figures, it is to be noticed that precipitation processes can significantly alter the local atmospheric structure, with the temperature gradient in the melting layer varying as a result of evaporative cooling and vertical motion (Stewart et al., 1984).
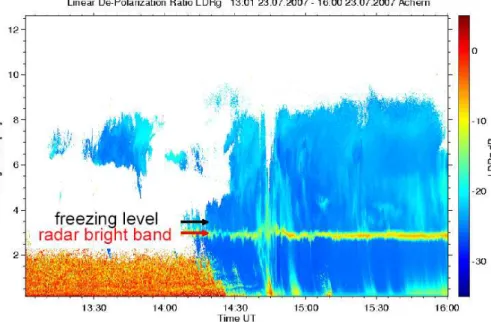
Figure 5 illustrates the time evolution of the linear depolarization ratio at 36 GHz from 13:00 UTC to 16:00 UTC on 23 July 2007 as measured byMIRA 36. The figure reveals
25
the presence of enhanced depolarization values in the bright band layer, where linear depolarization ratio values reach−10 dB. Depolarization is most commonly increased
ACPD
11, 30949–30987, 2011Lidar and radar observations of dark
and bright bands
P. Di Girolamo et al.
Title Page
Abstract Introduction
Conclusions References
Tables Figures
◭ ◮
◭ ◮
Back Close
Full Screen / Esc
Printer-friendly Version Interactive Discussion
Discussion
P
a
per
|
Dis
cussion
P
a
per
|
Discussion
P
a
per
|
Discussio
n
P
a
per
velocities is also found in the melting layer (Fig. 6), as a result of the melting process leading to smaller particles with a more regular shape and smaller impact area. Values of Doppler vertical velocity are not exceeding 2–3 ms−1 above and in the upper part
of the melting layer, while larger values (>4 ms−1) appear in the lower portion of the
melting layer.
5
Figure 7 illustrates the lidar and radar data expressed in terms of averaged vertical profiles, together with ancillary information from the radiosonde data. Specifically, the left panel shows the vertical profile of temperature as measured by the radiosonde launched at 14:06 UTC, revealing the height of the freezing level at ∼3.35 km a.g.l.
The second panel from left shows the vertical profiles of radar reflectivity at 36 GHz,
10
24.1 GHz and 1.29 GHz, revealing the presence of the radar bright band (reflectivity maximum) at 2.9–3.0 km a.g.l., i.e. 350–450 m below the freezing level at a temperature of 3.4–4.4◦C. Radar profiles in this and the other panels are based on 12 min data
averaging over the time interval 14:23–14:35 UTC. The third panel from left shows the vertical profiles of the backscattering coefficient at 355, 532 and 1064 nm, highlighting
15
the presence of a lidar dark band (backscattering minimum) at approximately 2.9 km, i.e. 450 m below the freezing level at a temperature of 4.4◦C, while a lidar bright band is
found approximately 100–200 m further down at 2.7–2.8 km a.g.l. Dark band signatures appear also in the lidar measurements of particle extinction at 355 and 532 nm (not shown here). Lidar profiles in this and the other panels are based on 15 min data
20
averaging over the time interval 14:20–14:35 UTC. The fourth panel from left shows the vertical profile of vertical velocity as measured at 36 GHz, 24.1 GHz and 1.29 GHz. Values at 36 GHz and 1.29 GHz are 2–2.5 ms−1 high in the melting layer and 3.5–
4 ms−1
in the lower portion of the melting layer. Values measured by the rain radar at 24.1 GHz show slightly larger values high in the melting layer (as large as 3.5 ms−1) and
25
in the lower portion of the melting layer (as large as 4–4.5 ms−1), probably as a result of
ACPD
11, 30949–30987, 2011Lidar and radar observations of dark
and bright bands
P. Di Girolamo et al.
Title Page
Abstract Introduction
Conclusions References
Tables Figures
◭ ◮
◭ ◮
Back Close
Full Screen / Esc
Printer-friendly Version Interactive Discussion
Discussion
P
a
per
|
Dis
cussion
P
a
per
|
Discussion
P
a
per
|
Discussio
n
P
a
per
|
Enhanced radar reflectivity and depolarization and an abrupt change in Doppler-derived particle velocities are found in the melting layer (radar bright band). Radar depolarization is increased (up to approximately 60 %) due to the presence of wetted, asymmetric ice shapes. In contrast to this, lidar depolarization at 355 nm shows values of 25–30 % high in the melting layer and values of 5–10 % at the heights of the lidar
5
dark and bright bands. These unexpectedly low values of lidar depolarization may imply that precipitating particles are almost spherical or have a more regular shape.
The fall speed of the precipitating hydrometeors can be inferred from the particle backscatter data by tracing the particle streams. Figure 8 shows again the particle backscatter ratio at 1064 nm, considering a different colour scale with respect to the
10
one used in Fig. 1 in order to highlight hydrometeors. Precipitation appears as distinct streams: some of these are not reaching the surface as a result of particle evapora-tion/sublimation or exit from the field-of-view of the lidar system. Similar tilted structures are also present in the radar reflectivity plots in Figs. 2–4. The slope of the precipita-tion streams in the time-height map allows to roughly quantify the fall speed of the
15
precipitating hydrometeors, based on the assumption no horizontal advection of the precipitating particles. Fall speed estimates are in the range 4.5–9 ms−1. These
val-ues are in agreement with the vertical velocities measured by the radar at 36 GHz and 1.29 GHz (Fig. 7).
3.2 Model simulations
20
The main purpose of this section is to provide a possible model simulation of the ob-served lidar backscatter measurements. Computations of the scattering properties of the melting hydrometers and simulations of the lidar dark and bright bands are per-formed based on the application of concentric/eccentric sphere Lorentz-Mie codes and a melting layer model. The concentric/eccentric sphere codes consider a
melt-25
ACPD
11, 30949–30987, 2011Lidar and radar observations of dark
and bright bands
P. Di Girolamo et al.
Title Page
Abstract Introduction
Conclusions References
Tables Figures
◭ ◮
◭ ◮
Back Close
Full Screen / Esc
Printer-friendly Version Interactive Discussion
Discussion
P
a
per
|
Dis
cussion
P
a
per
|
Discussion
P
a
per
|
Discussio
n
P
a
per
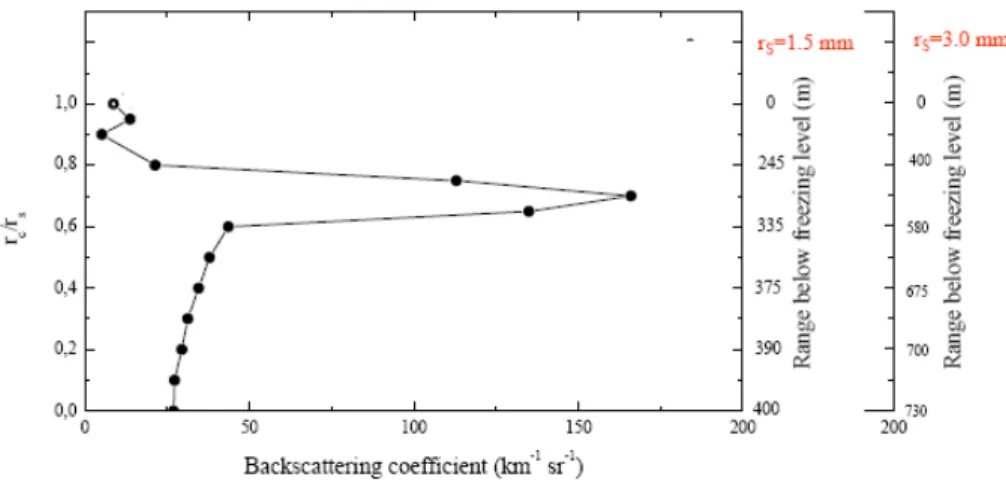
actually consists of a myriad of water coatings and irregular drop beads. Figure 9 illus-trates the variability of the volume backscattering coefficient at 350 nm,β355, as a func-tion of the melting ratio, i.e. the core/shell radius ratio,rc/rs, as simulated through the application of the concentric sphere code. Simulations in the optical domain (350 nm) for hydrometeors with a radius of 1.5 mm imply particle size parameter values (that
5
is the ratio of the particle circumference over the sounding wavelength) in excess of 25 000 (Di Girolamo et al., 2003). This imposes long computation times and a careful check for numerical stability.
The figure reveals the presence of an abrupt increase ofβ355for melting ratio values
rc/rs of 0.6–0.8, which is to be attributed to the major role played in the backscatter
10
process of severely melted hydrometeors by rays with large impact factors. It is to be pointed out that coalescence and breakup are completely ignored in this model. A melting model (Yokoyama and Tanaka, 1984) was considered to compute the vari-ability ofrc/rs as a function of the range below the 0◦C isotherm. Ranges below the freezing level obtained from this model are reported on the right scale of Fig. 9, with
15
results for two different melting particle radii (1.5 and 3.0 mm). From these results we realize that the backscattering enhancement found for rc/rs values of 0.6–0.8 takes place approximately 250–340 m below the freezing level for hydrometeors of 1.5 mm and 400–580 m below the freezing level for hydrometeors of 3.0 mm, in agreement with the lidar measurements in Fig. 7.
20
The severely melted ice core can move to the top or bottom of the drop (Pruppacher and Beard, 1970; Rasmussen et al., 1984). Specifically, the core can float to the top of the water drop if it has entrapped air bubbles or can flutter around inside the drop due to drag-induced internal circulations (Pruppacher and Beard, 1970).
So, we also considered a Mie code for large particles with off-centre inclusions, with
25
the ice core at the top or bottom of the water shell (Fig. 10). The considered code is capable of dealing with size parameter values up to∼1000.
ACPD
11, 30949–30987, 2011Lidar and radar observations of dark
and bright bands
P. Di Girolamo et al.
Title Page
Abstract Introduction
Conclusions References
Tables Figures
◭ ◮
◭ ◮
Back Close
Full Screen / Esc
Printer-friendly Version Interactive Discussion
Discussion
P
a
per
|
Dis
cussion
P
a
per
|
Discussion
P
a
per
|
Discussio
n
P
a
per
|
of 35 µm. A strong enhancement in backscatter coefficient is observed for a melting ratio of 0.55 when the ice core is at top of water shell and for a melting ratio of 0.8 when the ice core is at bottom of water shell, these results being in general agreement with those obtained with the concentric sphere code. Considering the results in terms of ranges below the freezing level obtained from the above mentioned melting model, we
5
realize that the backscattering maxima found forrc/rsvalues of 0.55 and 0.8 take place 250–350 m below the freezing level for hydrometeors with a radius of 1.5 mm and 400– 600 m below the freezing level for hydrometeors with a radius of 3.0 mm, these results being once again in general agreement with the lidar measurements in Fig. 7.
In a simplified schematic representation (Fig. 12), the lidar dark band can be
inter-10
preted as arising from the collapse of partially melted snowflakes, leading to a decrease of lidar backscattering as a result of the reduced particle size and concentration (few hundred meters below the freezing level), while the lidar bright band can be interpreted as arising from the progression of the melting process, leading to a sudden increase of lidar backscattering when the melting ratio is in the range 0.55–0.8, taking place
15
further down (up to 600 m) in the melting layer. In reality of course, both concentric and eccentric sphere models are simplified representations, as the melting snowflakes are non-spherical mixes of ice, water and air, which cannot be modelled exactly.
3.3 2DC probe, rain radar and disdrometer measurements
Additional information on precipitating hydrometeors were provided by the 2DC probe
20
and additional in situ sensors on-board the ATR42 SAFIRE (EUFAR initiative – OSMOC project). Figure 13 shows the time series of atmospheric temperature and relative hu-midity (upper panel), liquid water content (LWC, mid panel) and aircraft altitude (lower panel). This figure shows the aircraft descent path throughout the melting layer (red ellipse), with the freezing level being located around 3.35 km a.g.l.
25
ACPD
11, 30949–30987, 2011Lidar and radar observations of dark
and bright bands
P. Di Girolamo et al.
Title Page
Abstract Introduction
Conclusions References
Tables Figures
◭ ◮
◭ ◮
Back Close
Full Screen / Esc
Printer-friendly Version Interactive Discussion
Discussion
P
a
per
|
Dis
cussion
P
a
per
|
Discussion
P
a
per
|
Discussio
n
P
a
per
of the aircraft is located at a distance of approximately 10–15 km from the lidar station. However, Figs. 2 and 3 reveal a very limited variability of the radar reflectivity profiles at 1.29 and 36 GHz in the two hour period following the end of the lidar measurements (14:30–16:30 UTC), indicating a lack of small-scale meteorological variability during this period. Consequently, the time and space lag between the aircraft and the lidar
5
measurements only minorly affect the comparison between these measurements. Figure 14 represents a magnification of Fig. 13 for the time interval (15:04– 15:10 UTC) when the melting processes occurred, only for the parameters atmospheric temperature and aircraft altitude.
Figure 15 illustrates the two-dimensional images of the melting hydrometeors being
10
probed by the 2DC probe mounted below the aircraft wings. We focused our atten-tion on the final poratten-tion of the flight when the aircraft is descending through the melting layer (identified by the red ellipse in Fig. 13). This figure reveals the progressive melting of the snowflakes and the reduction of particle size, which is followed by an increase in size of the completely melted snowflakes (rain drops) associated with the
collision-15
coalescence process. Based on a visual approach, five distinct time intervals can be identified, characterized by different precipitating particle types. Specifically, the time interval labelled as 1 (15:05:52–15:06:07, blue shadowed in the figure) identifies rimed aggregates, while time interval 2 (15:06:09–15:06:19, light blue shadowed in the fig-ure) identifies mixed rain drops with few rimed aggregates. Time intervals 3–5 (interval
20
3, 15:06:19–15:06:38, green shadowed in the figure; interval 4, 15:06:42–15:08:31, red shadowed in the figure; interval 5; 15:08:33–15:11:02, yellow shadowed in the figure) identify rain drops with progressively increasing size as a result of the collision-coalescence process. These results are compatible with the model representation we have considered to simulate the scattering properties of the melting hydrometers and
25
with the lidar depolarization measurements illustrated in the previous sections (charac-terized by low values in the melting region).
ACPD
11, 30949–30987, 2011Lidar and radar observations of dark
and bright bands
P. Di Girolamo et al.
Title Page
Abstract Introduction
Conclusions References
Tables Figures
◭ ◮
◭ ◮
Back Close
Full Screen / Esc
Printer-friendly Version Interactive Discussion
Discussion
P
a
per
|
Dis
cussion
P
a
per
|
Discussion
P
a
per
|
Discussio
n
P
a
per
|
Fig. 16a shows the particle size distribution for the rimed aggregates in the time inter-val 1 (15:05:52–15:06:07), with a total particle number concentration of 0.49464 cm−3;
Fig. 16b shows the particle size distribution for the mixed rain drops and rimed aggre-gates in the time interval 2 (15:06:09–15:06:19), with a total particle number concen-tration of 0.52066 cm−3. Figure 16c–e illustrates the particle size distribution for rain
5
drops, with total particle number concentration being 0.08389 cm−3, 0.18161 cm−3and
0.09981 cm−3in the time interval 3, 4 and 5, respectively. A Marshall and Palmer size
distribution was used to fit the data points in Fig. 16a–e. The Marshall and Palmer size distribution can be expressed as:
n(D)=n0exp(−ΛD) (1)
10
with the mean diameterD0being equal to 1/Λ(Pruppacher and Klett, 1997). As particle concentration in Fig. 16a–e is expressed in semi-log scale, for fitting purposes Eq. (1) can be reformulated as:
logn(D)=logn0−ΛD (2)
Values ofΛ, and consequently ofD0, for the different panels in Fig. 16 can be obtained
15
by linear regression. To avoid overloading of the figures, the fitting curve is shown only in Fig. 16d. Values ofD0obtained from the fitting procedure are found to be 348, 305, 278, 421 and 654 µm for the time intervals 1, 2, 3, 4 and 5, respectively, these results once again revealing that melting hydrometers progressively decrease in size during the melting process till they become raindrops (intervals 1 through 3); afterwards, they
20
progressively increase in size, most probably as a result of the collision-coalescence process (intervals 3 through 5).
Figure 17 illustrates the precipitating particle size spectrum at 2 km a.g.l. as obtained from the rain radar at 24.1 GHz. The particle size spectrum in Fig. 17 is in good agree-ment with measureagree-ments performed by the 2DC probe. Also the data points in Fig. 17
25
ACPD
11, 30949–30987, 2011Lidar and radar observations of dark
and bright bands
P. Di Girolamo et al.
Title Page
Abstract Introduction
Conclusions References
Tables Figures
◭ ◮
◭ ◮
Back Close
Full Screen / Esc
Printer-friendly Version Interactive Discussion
Discussion
P
a
per
|
Dis
cussion
P
a
per
|
Discussion
P
a
per
|
Discussio
n
P
a
per
Figure 18 illustrates the size distribution of precipitating particles obtained from the disdrometer high-resolution (1 min) rainfall-rate measurements performed at ground level at SupersiteR (Joss and Waldvogel, 1990). The disdrometer data were collected at 16:12, approximately 2 h later than the lidar and radar data in Fig. 7, as unfortunately no earlier disdrometer data were available on 23 July. This figure reveals the presence
5
of rain drops with a mean particle diameter of 450 µm, in good agreement with those provided by the 2DC probe (278, 421 and 654 µm for the time intervals 3, 4 and 5). Results in Fig. 18 reveal the absence of particles smaller than 350 µm, which were otherwise detected in measurements aloft by both the 2DC probe and the rain radar. In this respect, it should be noted that rain measurements at the surface can substantially
10
differ from conditions aloft in the melting region (2–3 km in our case) because of the temporal variations in the convective showers and the predominant role of coalescence in homogenizing the drop size spectrum.
4 Summary and future work
This paper provides observations of the melting layer based on the synergetic use
15
of a variety of sensors, which includes a Raman lidar providing multi-wavelength backscatter, extinction and depolarization measurements, three radar systems pro-viding multi-wavelength radar reflectivity, depolarization and Doppler velocity measure-ments, a high-resolution disdrometer and a two-dimensional cloud (2DC) probe hosted on-board the ATR42, with ancillary information on the state of the atmosphere
pro-20
vided by radiosondes launched from a co-located radiosonde station. The measure-ments were carried out in Achern (Rhine Valley, Southern Germany) in the frame of the COPS – Convective and Orographically-induced Precipitation Study – held in South-ern Germany. Observations reported in this paper were carried out on 23 July 2007. Observations reveal the presence of the lidar and radar dark and bright band
phe-25
tempera-ACPD
11, 30949–30987, 2011Lidar and radar observations of dark
and bright bands
P. Di Girolamo et al.
Title Page
Abstract Introduction
Conclusions References
Tables Figures
◭ ◮
◭ ◮
Back Close
Full Screen / Esc
Printer-friendly Version Interactive Discussion
Discussion
P
a
per
|
Dis
cussion
P
a
per
|
Discussion
P
a
per
|
Discussio
n
P
a
per
|
tures of 3.4–4.4◦C), the maximum being less marked at 36 GHz because of the
domi-nance at shorter wavelengths of non-Rayleigh scattering effects in large water-coated snowflakes. Lidar measurements of particle backscattering at 355, 532 and 1064 nm reveal the presence of a minimum (lidar dark band) approximately 450 m below the freezing level (at a temperature of 4.4◦C), as well as the presence of a maximum (lidar
5
bright band) 100–200 m further down.
Radar depolarization shows a maximum in the proximity of the radar bright band, while lidar depolarization shows unexpected low values (5–10 %) at the heights of the lidar dark and bright bands, which may imply precipitating particles being almost spher-ical or having a more regular shape. Particle vertspher-ical velocities are found to display an
10
abrupt increase within the melting layer, with values of 2–2.5 ms−1
high in the melting layer and values of 3.5–4 ms−1in the lower portion of the melting layer.
The lidar dark and bright bands were simulated with the use of concentric/eccentric sphere Lorentz-Mie codes and a melting layer model. We interpret these phenomena as arising from the structural collapse of partially melted snowflakes, which leads to
15
a decrease of lidar backscattering as a result of the reduced particle size and con-centration (few hundred meters below the freezing level), while the lidar bright band arises from the progression of the melting process, leading to a sudden increase of lidar backscattering when melting ratio is 0.5–0.8, taking place further down (up to 600 m) in the melting layer. This interpretation is compatible with model results from both
20
the concentric and the eccentric sphere Lorentz-Mie code.
Lidar and radar measurements and model results have been compared with mea-surements from a 2DC probe on-board the ATR42 SAFIRE and a disdrometer. Two-dimensional images of the hydrometeors descending through the melting layer reveal the progressive melting and reduction of size of the snowflakes till they become
rain-25
ACPD
11, 30949–30987, 2011Lidar and radar observations of dark
and bright bands
P. Di Girolamo et al.
Title Page
Abstract Introduction
Conclusions References
Tables Figures
◭ ◮
◭ ◮
Back Close
Full Screen / Esc
Printer-friendly Version Interactive Discussion
Discussion
P
a
per
|
Dis
cussion
P
a
per
|
Discussion
P
a
per
|
Discussio
n
P
a
per
images have been fitted by a Marshall and Palmer function, leading to estimates of the melting hydrometeor diameter in the range 300–650 µm, which are in agreement with analogous measurements from the rain radar and a disdrometer on ground.
As a future continuation of this study, we plan to extend the present analysis to all available case studies observed during COPS. Additionally, we plan to apply an
in-5
version algorithm to retrieve precipitating particle size and microphysical parameters from the multi-wavelength lidar data of particle backscattering, extinction and depolar-ization, based on the use of a Mie scattering code and a retrieval scheme employing Tikhonov’s inversion with regularization. More experimental data for a comprehensive understanding of melting layer phenomena are expected to be obtained from
scan-10
ning dual-polarization lidar measurements, which were not available during COPS but are planned to be implemented in the future, as in fact inhomogeneous melting drops tend to orientate, so that a lidar elevation angle dependence of return signals may be present.
Appendix A
15
The two-dimensional cloud (2DC) probe is mounted below the aircraft wings on-board the scientifically equipped ATR42 from Service des Avions Franc¸ais Instrument ´es pout la Recherche en Environnement. It provides two-dimensional images of the atmo-spheric particles, with a maximum detectable particle size of 2 mm. Measurements can be used to retrieve cloud and precipitating particle size distribution. An additional
20
collocated sensor (Gerber PMV100) provides time series measurements of the aircraft altitude, atmospheric temperature and LWC. The 2DC probe is composed of two dif-ferent branches: a linear array of 30 photodiodes (25 µm each, with a total length of 800 µm) is located at the tip of one branch, while a diode laser illuminating the array of photodiodes is located at the tip of the opposite branch. The array is oriented
perpen-25
ACPD
11, 30949–30987, 2011Lidar and radar observations of dark
and bright bands
P. Di Girolamo et al.
Title Page
Abstract Introduction
Conclusions References
Tables Figures
◭ ◮
◭ ◮
Back Close
Full Screen / Esc
Printer-friendly Version Interactive Discussion
Discussion
P
a
per
|
Dis
cussion
P
a
per
|
Discussion
P
a
per
|
Discussio
n
P
a
per
|
points. By sampling at an high rate of 10 Hz, the sequence of lines produces a two-dimensional image of the particles passing through the branches’ tips. The particles images in the Fig. 15 are the representation of this time series of shadowed lines.
Acknowledgements. This work was supported by the European Commission under the Euro-pean Fleet for Airborne Research program of the 7th Framework Program (Projects H2OLidar
5
and OSMOC). We also wish to thank the International Science Steering Committee of the Con-vective and Orographically-induced Precipitation Study for financial supporting this activity. We wish to thank the University of Kiel for the provision of the disdrometer data. The participation of T. Di Iorio to this work was supported through the project PRIN 2007L8Y4NB funded by the Italian Ministry for University and Research, MIUR.
10
References
Battan, L. J.: Radar Observations of the Atmosphere, University of Chicago Press, Chicago, USA, 279 pp., 1973.
Bhawar, R., Di Girolamo, P., Summa, D., Flamant, C., Althausen, D., Behrendt, A., Kiemle, C., Bosser, P., Cacciani, M., Champollion, C., Di Iorio, T., Engelmann, R., Herold, C.,
15
Pal, S., Wirth, M., and Wulfmeyer, V.: The water vapour intercomparison effort in the framework of the convective and orographically-induced precipitation study: airborne-to-ground-based and airborne-to-airborne lidar systems, Q. J. Roy. Meteor. Soc., 137, 325–348, doi:10.1002/qj.697, 2011.
Demoz, B. B., Starr, D., Whiteman, D., Evans, K., Hlavka, D., and Peravali, R.: Raman LIDAR
20
detection of cloud base, Geophys. Res. Lett., 27(13), 1899–1902, 2000.
Di Girolamo, P., Pappalardo, G., Berardi, V., Cuomo, V., Spinelli, N., and Velotta, R.: Lidar observations of the stratospheric aerosol layer over Southern Italy in the period 1991–1995, J. Geophys. Res., 101, 18765–18773, 1996.
Di Girolamo, P., Ambrico, P. F., Amodeo, A., Boselli, A., Pappalardo, G., and Spinelli, N.: Aerosol
25
observations by lidar in the Nocturnal Boundary Layer, Appl. Optics, 38(21), 4585–4595, 1999.
Di Girolamo, P., Demoz, B. B., and Whiteman, D. N.: Model simulations of melting hydromete-ors: a new lidar bright band from melting frozen drops, Geophys. Res. Lett., 30(12), 1626, doi:10.1029/2002GL016825, 2003.
ACPD
11, 30949–30987, 2011Lidar and radar observations of dark
and bright bands
P. Di Girolamo et al.
Title Page
Abstract Introduction
Conclusions References
Tables Figures
◭ ◮
◭ ◮
Back Close
Full Screen / Esc
Printer-friendly Version Interactive Discussion
Discussion
P
a
per
|
Dis
cussion
P
a
per
|
Discussion
P
a
per
|
Discussio
n
P
a
per
Di Girolamo, P., Marchese, R., Whiteman, D. N., and Demoz, B. B.: Rotational Raman lidar measurements of atmospheric temperature in the UV, Geophys. Res. Lett., 31, L01106, doi:10.1029/2003GL018342, 2004.
Di Girolamo, P., Behrendt, A., and Wulfmeyer, V.: Pure rotational Raman lidar measurements of atmospheric temperature and extinction from space: performance simulations, Appl. Optics,
5
45, 2474–2494, 2006.
Di Girolamo, P., Summa, D., and Ferretti, R.: Rotational Raman lidar measurements for the characterization of stratospheretroposphere exchange mechanisms, J. Atmos. Ocean. Tech., 26, 1742–1762, 2009a.
Di Girolamo, P., Summa, D., Lin, R.-F., Maestri, T., Rizzi, R., and Masiello, G.: UV Raman
10
lidar measurements of relative humidity for the characterization of cirrus cloud microphysical properties, Atmos. Chem. Phys., 9, 8799–8811, doi:10.5194/acp-9-8799-2009, 2009b. Griaznov, V., Veselovskii, I., Di Girolamo, P., Demoz, B., and Whiteman, D. N.: Numerical
simulation of light backscattering by spheres with off-center inclusion. Application for Lidar case, Appl. Optics, 43, 5512–5522, 2004.
15
Griaznov, V., Veselovskii, I., Di Girolamo, P., Korenskii, M., and Summa, D.: Spatial distribution of doubly scattered polarized laser radiation in the focal plane of a lidar receiver, Appl. Optics, 46, 6821–6830, 2007.
Joss, J. and Waldvogel, A.: Precipitation measurement and hydrology, in: Radar in Meteorol-ogy, edited by: Atlas, D., Am. Meteorol. Soc., Boston, USA, 577–597, 1990.
20
Kalthoff, N., Adler, B., Barthlott, C., Corsmeier, U., Mobbs, S., Crewell, S., Trumner, K., Kottmeier, C., Wieser, A., Smith, V., and Di Girolamo, P.: The impact of convergence zones on nthe initiation of deep convection: a case study from COPS, Atmos. Res., 93, 680–694, 2009.
Kottmeier, C., Kalthoff, N., Barthlott, C., Corsmeier, U., Van Baelen, J., Behrendt, A.,
25
Behrendt, R., Blyth, A., Coulter, R., Crewell, S., Di Girolamo, P., Dorninger, M., Flamant, C., Foken, T., Hagen, M., Hauck, C., H ¨oller, H., Konow, H., Kunz, M., Mahlke, H. Mobbs, S., Richard, E., Steinacker, R., Weckwerth, T., Wieser, A., and Wulfmeyer, V.: Mechanisms initi-ating deep convection over complex terrain during COPS, Meteorol. Z., 17, 931–948, 2008. Maestri, T., Di Girolamo, P., Summa, D., and Rizzi, R.: Synergistic use of a ground based
30
RAMAN Lidar and the NAST-I Airborne Spectrometer in clear and cloudy sky conditions – EAQUATE, Italy 2004, Atmos. Res., 97, 157–169, 2010.
ACPD
11, 30949–30987, 2011Lidar and radar observations of dark
and bright bands
P. Di Girolamo et al.
Title Page
Abstract Introduction
Conclusions References
Tables Figures
◭ ◮
◭ ◮
Back Close
Full Screen / Esc
Printer-friendly Version Interactive Discussion
Discussion
P
a
per
|
Dis
cussion
P
a
per
|
Discussion
P
a
per
|
Discussio
n
P
a
per
|
Atmos. Ocean. Tech., 17, 628–640, 2000.
Norton, E. G., Vaughan, G., Methven, J., Coe, H., Brooks, B., Gallagher, M., and Longley, I.: Boundary layer structure and decoupling from synoptic scale flow during NAMBLEX, Atmos. Chem. Phys., 6, 433–445, doi:10.5194/acp-6-433-2006, 2006.
Pruppacher, H. and Beard, K. V.: A wind tunnel investigation of the internal circulation and
5
shape of water drops falling at terminal velocity in air, Q. J. Roy. Meteorol. Soc., 96, 247– 256, 1970.
Pruppacher, H. R. and Klett, J. D.: Microphysics of clouds and precipitation, Kluwer Academic Publishers, Dordrecht and Boston, 954 pp., 1997.
Rasmussen, R. M., Levizzani, V., and Pruppacher, H. R.: A wind tunnel and theoretical study
10
on the melting behavior of atmospheric ice particles. II: A theoretical study for frozen drops of radius<500 m m, J. Atmos. Sci., 41(3), 374–380, 1984.
Richard, E., Flamant, C., Bouttier, F., Van Baelen, J., Champollion, C., Hagen, M., Cuesta, J., Bosser, P., Pigeon, G., Argence, S., Arnault, J., Brousseau, P., Seity, Y., Chaboureau, J.-P., Limnaios, J.-P., Masson, F., Pointin, Y., Di Girolamo, J.-P., and Wulfmeyer, V.: La campagne
15
COPS : initiation et cycle de vie de la convection en r ´egion montagneuse, La M ´et ´eorologie, 64, 32–42, 2009.
Rogers, R. R. and Yau, M. K.: A Short Course in Cloud Physics, 3. edn., International Series in Natural Philosophy, Butterworth and Heinemann, Oxford, 304 pp., 1989.
Roy, G. and Bissonnette, L. R.: Strong dependence of rain-induced lidar depolarization on
20
the illumination angle: experimental evidence and geometrical- optics interpretation, Appl. Optics, 40, 4770–4780, 2001.
Sassen, K. and Chen, T.: The lidar dark band: an oddity of the radar bright band, Geophys. Res. Lett., 22, 3505–3508, 1995.
Sassen, K., Campbell, J. R., Zhu, J., Kollias, P., Shupe, M., and Williams, C.: Lidar and
triple-25
wavelength Doppler radar measurements of the melting layer: a revised model for dark and bright band phenomena, J. Appl. Meteorol., 44, 301–312, 2005.
Stewart, R. E., Marwitz, J. D., Pace, J. C., and Carbone, R. E.: Characteristics through the melting layer of stratiform clouds, J. Atmos. Sci., 41, 3227–3237, 1984.
Yokoyama, T. and Tanaka, H.: Microphysical processes of melting snowflakes detected by
two-30
wavelength radar. Part I. Principle of measurement based on model calculation, J. Meteorol. Soc. Jpn., 62, 650–666, 1984.
ACPD
11, 30949–30987, 2011Lidar and radar observations of dark
and bright bands
P. Di Girolamo et al.
Title Page
Abstract Introduction
Conclusions References
Tables Figures
◭ ◮
◭ ◮
Back Close
Full Screen / Esc
Printer-friendly Version Interactive Discussion
Discussion
P
a
per
|
Dis
cussion
P
a
per
|
Discussion
P
a
per
|
Discussio
n
P
a
per
Craig, G., Schumann, U., Hagen, M., Crewell, S., Di Girolamo, P., Flamant, C., Miller, M., Montani, A., Mobbs, S., Richard, E., Rotach, M. W., Arpagaus, M., Russchenberg, H., Schl ¨ussel, P., K ¨onig, M., G ¨artner, V., Steinacker, R., Dorninger, M., Turner, D. D., Weck-werth, T., Hense, A., and Simmer, C.: The convective and orographically-induced precipi-tation study: a research and development project of the World Weather Research Program
5
for improving quantitative precipitation forecasting in low-mountain regions, B. Am. Meteorol. Soc., 89, 1477–1486, 2008.
Wulfmeyer, V., Behrendt, A., Kottmeier, C., Corsmeier, U., Barthlott, C., Craig, G. C., Ha-gen, M., Althausen, D., Aoshima, F., Arpagaus, M., Bauer, H. S., Bennett, L., Blyth, A., Brandau, C., Champollion, C., Crewell, S., Dick, G., Di Girolamo, P., Dorninger, M.,
Dufour-10
net, Y., Eigenmann, R., Engelmann, R., Flamant, C., Foken, T., Gorgas, T., Grzeschik, M., Handwerker, J., Hauck, C., H ¨oller, H., Junkermann, W., Kalthoff, N., Kiemle, C., Klink, S., K ¨onig, M., Krauss, L., Long, C. N., Madonna, F. Mobbs, S., Neininger, B., Pal, S., Pe-ters, G., Pigeon, G., Richard, E., Rotach, M. W., Russchenberg, H., Schwitalla, T., Smith, V., Steinacker, R., Trentmann, J., Turner, D. D., van Baelen, J., Vogt, S., Volkert, H.,
Weckw-15
ACPD
11, 30949–30987, 2011Lidar and radar observations of dark
and bright bands
P. Di Girolamo et al.
Title Page
Abstract Introduction
Conclusions References
Tables Figures
◭ ◮
◭ ◮
Back Close
Full Screen / Esc
Printer-friendly Version Interactive Discussion
Discussion
P
a
per
|
Dis
cussion
P
a
per
|
Discussion
P
a
per
|
Discussio
n
P
a
per
|
BASIL, Aerorol Backscatter Ratio at 1064 nm
Fig. 1.Time evolution of the particle backscatter ratio at 1064 nm from 13:00 UTC to 14:35 UTC
ACPD
11, 30949–30987, 2011Lidar and radar observations of dark
and bright bands
P. Di Girolamo et al.
Title Page
Abstract Introduction
Conclusions References
Tables Figures
◭ ◮
◭ ◮
Back Close
Full Screen / Esc
Printer-friendly Version Interactive Discussion
Discussion
P
a
per
|
Dis
cussion
P
a
per
|
Discussion
P
a
per
|
Discussio
n
P
a
per
Fig. 2.Time evolution of radar reflectivity at 1.29 GHz from 00:00 UTC to 24:00 UTC on 23 July
ACPD
11, 30949–30987, 2011Lidar and radar observations of dark
and bright bands
P. Di Girolamo et al.
Title Page
Abstract Introduction
Conclusions References
Tables Figures
◭ ◮
◭ ◮
Back Close
Full Screen / Esc
Printer-friendly Version Interactive Discussion
Discussion
P
a
per
|
Dis
cussion
P
a
per
|
Discussion
P
a
per
|
Discussio
n
P
a
per
|
Fig. 3. Time evolution of radar reflectivity at 36 GHz from 13:00 UTC to 16:00 UTC on 23 July
ACPD
11, 30949–30987, 2011Lidar and radar observations of dark
and bright bands
P. Di Girolamo et al.
Title Page
Abstract Introduction
Conclusions References
Tables Figures
◭ ◮
◭ ◮
Back Close
Full Screen / Esc
Printer-friendly Version Interactive Discussion
Discussion
P
a
per
|
Dis
cussion
P
a
per
|
Discussion
P
a
per
|
Discussio
n
P
a
per
Micro rain radar, Radar Reflectivity at 24.1 GHz
(dB)
Fig. 4.Time evolution of radar reflectivity at 24.1 GHz from 14:25 UTC to 17:29 UTC on 23 July
ACPD
11, 30949–30987, 2011Lidar and radar observations of dark
and bright bands
P. Di Girolamo et al.
Title Page
Abstract Introduction
Conclusions References
Tables Figures
◭ ◮
◭ ◮
Back Close
Full Screen / Esc
Printer-friendly Version Interactive Discussion
Discussion
P
a
per
|
Dis
cussion
P
a
per
|
Discussion
P
a
per
|
Discussio
n
P
a
per
|
MIRA 36, Radar Depolarization at 36 GHz
Fig. 5.Time evolution of the linear depolarization ratio at 36 GHz from 13:00 UTC to 16:00 UTC
ACPD
11, 30949–30987, 2011Lidar and radar observations of dark
and bright bands
P. Di Girolamo et al.
Title Page
Abstract Introduction
Conclusions References
Tables Figures
◭ ◮
◭ ◮
Back Close
Full Screen / Esc
Printer-friendly Version Interactive Discussion
Discussion
P
a
per
|
Dis
cussion
P
a
per
|
Discussion
P
a
per
|
Discussio
n
P
a
per
MIRA 36, Radar Doppler Velocity at 36 GHz
Fig. 6.Time evolution of hydrometeors vertical velocity from 13:00 UTC to 16:00 UTC on 23 July
ACPD
11, 30949–30987, 2011Lidar and radar observations of dark
and bright bands
P. Di Girolamo et al.
Title Page
Abstract Introduction
Conclusions References
Tables Figures
◭ ◮
◭ ◮
Back Close
Full Screen / Esc
Printer-friendly Version Interactive Discussion
Discussion
P
a
per
|
Dis
cussion
P
a
per
|
Discussion
P
a
per
|
Discussio
n
P
a
per
|
Fig. 7. Vertical profile of temperature as measured by the radiosonde launched at 14:06 UTC
ACPD
11, 30949–30987, 2011Lidar and radar observations of dark
and bright bands
P. Di Girolamo et al.
Title Page
Abstract Introduction
Conclusions References
Tables Figures
◭ ◮
◭ ◮
Back Close
Full Screen / Esc
Printer-friendly Version Interactive Discussion
Discussion
P
a
per
|
Dis
cussion
P
a
per
|
Discussion
P
a
per
|
Discussio
n
P
a
per
Fig. 8.Time evolution of the particle backscatter ratio at 1064 nm from 13:00 UTC to 14:35 UTC
ACPD
11, 30949–30987, 2011Lidar and radar observations of dark
and bright bands
P. Di Girolamo et al.
Title Page
Abstract Introduction
Conclusions References
Tables Figures
◭ ◮
◭ ◮
Back Close
Full Screen / Esc
Printer-friendly Version Interactive Discussion
Discussion
P
a
per
|
Dis
cussion
P
a
per
|
Discussion
P
a
per
|
Discussio
n
P
a
per
|
ACPD
11, 30949–30987, 2011Lidar and radar observations of dark
and bright bands
P. Di Girolamo et al.
Title Page
Abstract Introduction
Conclusions References
Tables Figures
◭ ◮
◭ ◮
Back Close
Full Screen / Esc
Printer-friendly Version Interactive Discussion
Discussion
P
a
per
|
Dis
cussion
P
a
per
|
Discussion
P
a
per
|
Discussio
n
P
a
per
Fig. 10. Schematics of off-centre inclusion particles, with the ice core at the top or bottom of
ACPD
11, 30949–30987, 2011Lidar and radar observations of dark
and bright bands
P. Di Girolamo et al.
Title Page
Abstract Introduction
Conclusions References
Tables Figures
◭ ◮
◭ ◮
Back Close
Full Screen / Esc
Printer-friendly Version Interactive Discussion
Discussion
P
a
per
|
Dis
cussion
P
a
per
|
Discussion
P
a
per
|
Discussio
n
P
a
per
|
Figure 11. Volume backscattering coefficient at 350 nm vs. melting ra
Fig. 11. Volume backscattering coefficient at 350 nm vs. melting ratio rc/rs, as simulated
ACPD
11, 30949–30987, 2011Lidar and radar observations of dark
and bright bands
P. Di Girolamo et al.
Title Page
Abstract Introduction
Conclusions References
Tables Figures
◭ ◮
◭ ◮
Back Close
Full Screen / Esc
Printer-friendly Version Interactive Discussion
Discussion
P
a
per
|
Dis
cussion
P
a
per
|
Discussion
P
a
per
|
Discussio
n
P
a
per
Figure 12. Simplified schematic representation of the the lidar dark and bright band.
ACPD
11, 30949–30987, 2011Lidar and radar observations of dark
and bright bands
P. Di Girolamo et al.
Title Page
Abstract Introduction
Conclusions References
Tables Figures
◭ ◮
◭ ◮
Back Close
Full Screen / Esc
Printer-friendly Version Interactive Discussion
Discussion
P
a
per
|
Dis
cussion
P
a
per
|
Discussion
P
a
per
|
Discussio
n
P
a
per
|
Fig. 13. Time series of atmospheric temperature and relative humidity (upper panel), liquid
ACPD
11, 30949–30987, 2011Lidar and radar observations of dark
and bright bands
P. Di Girolamo et al.
Title Page
Abstract Introduction
Conclusions References
Tables Figures
◭ ◮
◭ ◮
Back Close
Full Screen / Esc
Printer-friendly Version Interactive Discussion
Discussion
P
a
per
|
Dis
cussion
P
a
per
|
Discussion
P
a
per
|
Discussio
n
P
a
per
Fig. 14. Atmospheric temperature and aircraft altitude in the time interval 15:04–15:10 UTC.
ACPD
11, 30949–30987, 2011Lidar and radar observations of dark
and bright bands
P. Di Girolamo et al.
Title Page
Abstract Introduction
Conclusions References
Tables Figures
◭ ◮
◭ ◮
Back Close
Full Screen / Esc
Printer-friendly Version Interactive Discussion
Discussion
P
a
per
|
Dis
cussion
P
a
per
|
Discussion
P
a
per
|
Discussio
n
P
a
per
|
Fig. 15.Two-dimensional images of the melting hydrometeors probed by the 2DC. The five
ACPD
11, 30949–30987, 2011Lidar and radar observations of dark
and bright bands
P. Di Girolamo et al.
Title Page Abstract Introduction Conclusions References Tables Figures ◭ ◮ ◭ ◮ Back Close
Full Screen / Esc
Printer-friendly Version Interactive Discussion Discussion P a per | Dis cussion P a per | Discussion P a per | Discussio n P a per
500 1000 1500 2000 2500 3000 10-2
10-1
100 101
particle size [μm]
pa rt ic le c o nc e nt rat io n [ L -1μ m -1]
Time: 15.0979 - 15.1022 - rimed aggregates Total particle number: 494.64 Mean particle size= 42.44 μm
500 1000 1500 2000
10-2
10-1 100
101
particle size [μm]
pa rt ic le concen tr at ion [L -1μ m -1]
Time: 15.1025 - 15.1052 - mixed water - aggregates Total particle number: 520.66 Mean particle size= 36.26 μm
200 400 600 800 1000
10-2 10-1 100
particle size [μm]
pa rt ic le concen tr at ion [L -1μ m -1]
Time: 15.1054 - 15.1105 - water droplets Total particle number: 83.89 Mean particle size= 5.91 μm
1000 2000 3000 4000 10-3
10-2
10-1 100
particle size [μm]
pa rt ic le concen tr at ion [L -1μ m -1]
Time: 15.1136 - 15.142 - rain droplets Total particle number: 181.61 Mean particle size= 18.46 μm
1000 2000 3000 4000 10-3
10-2 10-1
100
particle size [μm]
pa rt ic le concen tr at ion [L -1μ m -1]
Time: 15.1425 - 15.1684 - with large rain drops Total particle number: 99.81 Mean particle size= 13.78 μm
(a) (b)
(c) (d)
(e)
Fig. 16. Precipitating particle size distribution as obtained from the time series of the
ACPD
11, 30949–30987, 2011Lidar and radar observations of dark
and bright bands
P. Di Girolamo et al.
Title Page
Abstract Introduction
Conclusions References
Tables Figures
◭ ◮
◭ ◮
Back Close
Full Screen / Esc
Printer-friendly Version Interactive Discussion
Discussion
P
a
per
|
Dis
cussion
P
a
per
|
Discussion
P
a
per
|
Discussio
n
P
a
per
|
ACPD
11, 30949–30987, 2011Lidar and radar observations of dark
and bright bands
P. Di Girolamo et al.
Title Page
Abstract Introduction
Conclusions References
Tables Figures
◭ ◮
◭ ◮
Back Close
Full Screen / Esc
Printer-friendly Version Interactive Discussion
Discussion
P
a
per
|
Dis
cussion
P
a
per
|
Discussion
P
a
per
|
Discussio
n
P
a
per
300 350 400 450 500 550 600
0 20 40 60 80 100 120
N
u
m
b
er of
dr
ops
drop diameter (μm)
Fig. 18.Precipitating particle size distribution as obtained from the time series of the