____________________________
Corresponding author: Novo Pržulj, Institute of Field and Vegetable Crops, Maksima Gorkog 30, 21000 Novi Sad, Serbia, e-mail: [email protected]
UDC 575:634.11 DOI: 0.2298/GENSR1103549P
Original scientific paper
CHARACTERIZATION OF VEGETATIVE AND GRAIN FILLING PERIODS OF WINTER WHEAT BY STEPWISE REGRESSION
PROCEDURE. II. GRAIN FILLING PERIOD
Novo PRŽULJ and Vojislava MOM ILOVI
1Institute of Field and Vegetable Crops, Novi Sad, Serbia
Pržulj N. and V. Mom ilovi (2011): Characterization of vegetative and grain filling periods of winter wheat by stepwise regression procedure.II. Grain filling period.- Genetika, Vol 43, No. 3,549 -558.
In wheat, rate and duration of dry matter accumulation and remobilization depend on genotype and growing conditions. The objective of this study was to determine the most appropriate polynomial regression of stepwise regression procedure for describing grain filling period in three winter wheat cultivars. The stepwise regression procedure showed that grain filling is a complex biological process and that it is difficult to offer a simple and appropriate polynomial equation that fits the pattern of changes in dry matter accumulation during the grain filling period, i.e., from anthesis to maximum grain weight, in winter wheat. If grain filling is to be represented with a high power polynomial, quartic and quintic equations showed to be most appropriate. In spite of certain disadvantages, a cubic equation of stepwise regression could be used for describing the pattern of winter wheat grain filling.
INTRODUCTION
Yield of wheat depends mainly on the processes of starch synthesis and accumulation (PANet al., 2007). Sink capacity determines the rate and duration of starch accumulation during grain filling under optimal growing conditions, i.e., the accumulation, transformation and partitioning of carbohydrates between grain and biomass. The rate of grain starch accumulation and grain weight are affected by photosynthate assimilation, dry matter accumulation, dry matter remobilization and starch accumulation capacity on one side and growing conditions, i.e., temperature, available nitrogen and moisture on the other (PRŽULJ and MOM ILOVI , 2001; DENNIS, 2004).
In conditions when assimilates from current photosynthesis become unavailable due to stress such as drought, high temperature or low light influx, grain filling depends to a high extent on remobilized resources (PRŽULJ and MOM ILOVI , 2003;
MAYDUPet al., 2010 ). Under drought conditions, photosynthetic capacity of leaves is decreased and at the same time the demand for current photosynthates is increased, i.e., for both, grain filling and respiration. Water deficit brings about a lower accumulation of stem reserves and reduced amounts of remobilized stem reserves into grain (EHDAIEet al., 2006). Reduction in grain growth depends on water deficit intensity and the phase of grain development (MASONIet al., 2007). When water deficit occurs during early stages of grain development, the grain sink capacity is diminished (RAJALAet al., 2009).
The effects of various factors on specific crop traits can be efficiently simulated (MICHELEet al., 2003; PANet al., 2006). Several models have been developed which simulate the growth and dry matter accumulation in wheat (ASSENG et al., 2002).
Several mathematical models have been used to estimate grain filling parameters in small grains. PEPLER et al. (2006) applied the linear regression for rate of grain filling determination, but he dealt only with the linear phase of grain filling, while omitting the first or accelerating phase and the third or saturation phase. PRŽULJ
(2001) fitted a quadratic and EGLI (2004) a cubic polynomial to the data of wheat grain filling. SANTIVERI et al. (2002) found that a logistic equation could describe the relationship between grain weight and accumulated growing degree days very well.
The objective of this study was to test the stepwise regression procedure as a method for determining the polynomial regression that describes most appropriately the grain filling in winter wheat.
MATERIALS AND METHODS
The experimental design, measurements, and statistical analysis was described in detailin our previous paper (PRŽULJ and MOM ILOVI , 2011). Briefly, a 5-year field
In each plot we tagged 100 main tillers from fourth and fifth rows, which flowered on the same day. Three tagged tillers per plot were collected in plastic bags at 2-4 day intervals from anthesis until physiological maturity, weighed in the lab and oven-dried at 80°C for 48 hours to constant weight. The accumulated growing-degree days (GDD) were used as the time scale.
The statistical analysis involved a special type of regression, the one that concerns a polynomial expression:
Yi=α+β1Xi+β2 Xi2+β3 Xi3+…+βmXim+ i
and a model with parameters estimated in the expression:
i=a+b1Xi+b2 Xi2+b3 Xi3+…+bmXim (Zar, 1999).
A stepwise regression procedure was used for determination of maximum power, m, where maximum power should not be greater than n-1 if a polynomial is to fit the data, and, more practically, not greater than n-2 if statistical analysis is to be performed on the resulting polynomial fit (Zar, 1999). The procedure starts by fitting a linear regression ( i=a+bXi) to the data, followed by fitting a second degree
polynomial to the data. Quadratic equation ( i=a+b1Xi+b2Xi 2
) is made by adding the quadratic term (b2Xi
2
) to the simple regression. To test whether the added quadratic term improves the precision of Y values prediction, the t test is applied. If the t test does not refute the null hypothesis, H0 : β = 0, it means that the simple regression
model characterizes the relationship between Y and X, i.e., that the quadratic term contributes insignificantly to this characterization. If the null hypothesis is refuted, fits are tried with polynomials of higher power, until the acceptable fit is found, which means that the polynomial with the m-1 term is the best model. For testing the significance of regression and coefficient values, a probability level =0.05 and an appropriate degree of freedom were used. Stepwise regression was calculated and the curves plotted by the software package StatSoft Statistica 9.1
RESULTS AND DISCUSSION
The length of grain growth and grain weight are processes that are highly environment-dependent. Determination of the genetic base of these two traits/processes and their interactions with certain growing condition help breeders to develop new cultivars and growers to select a most appropriate cultivar for a specific environment. In plant simulation modeling, the growth dynamics should be predicted by an appropriate equation. A simple equation for characterization of grain filling duration and final weight is preferred (YINet al., 2003).
weeks, grain capacity for dry matter accumulation is established. The actual rate of dry matter accumulation in the grain is low in this phase and it can be presented by an exponential curve (WEISS and MORENO-SOTOMAYER, 2006). During the linear phase, which covers most of the period of grain filling and which indeed represents the period of actual grain filling, dry matter accumulation is almost constant per time unit and it can be presented by a linear equation. The third sub-phase or maturity phase, which is characterized by a decreased dry matter accumulation, can be presented by a convex equation. Instead of using these three equations sequentially, a curvilinear equation can be used which permits a gradual transition from one phase to another. So, the pattern of growth fits a sigmoid curve and the rate of growth a bell-shaped curve (YINet al., 2003).
The linear model of dry matter accumulation proposed by PEPLERet al. (2006) can be questioned since it presents only a part of the grain filling, i.e., a period from the 10th to the 26th day after anthesis. Although most of the grain dry matter is
accumulated during the linear period, it is difficult to evaluate the beginning and the end of this period and this method suffers from subjectivity. EHDAIEet al. (2008) have pointed out that not all grain filling curves that represented the second phase are linear, as some of them are sigmoid in shape. To minimize the influence of floret position on grain filling rate, many authors used grains at fixed positions (VOLTASet al. 1999)
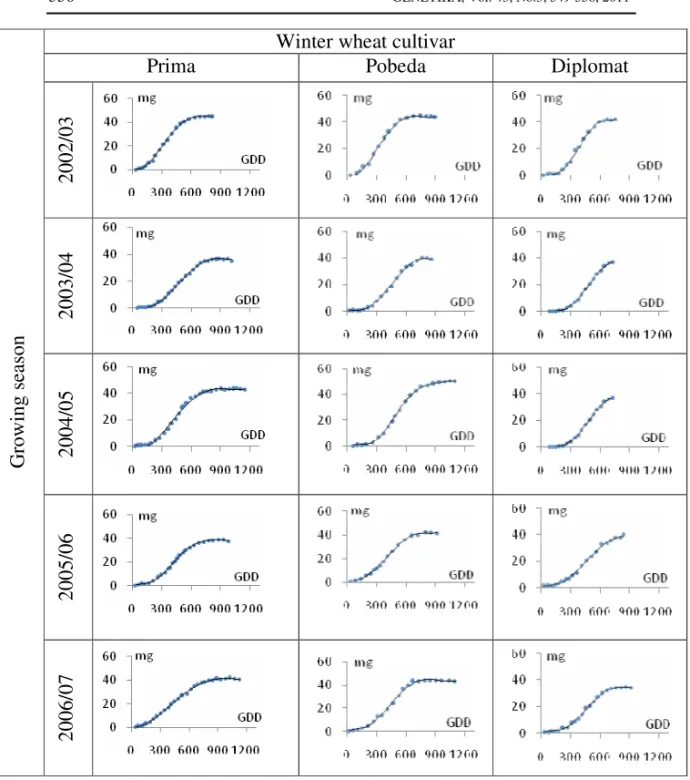
Different polynomial curves fitted the data of grain filling of the three winter wheat cultivars, ranging from cubic to septic (Tables 1, 2, 3). However, the cubic model correctly presented the grain filling process in all three cultivars since the coefficient of determination exceeded 99% in all cases. This model is the simplest and with a high value of the coefficient of determination. From the biological point, grain weight at anthesis is zero or very close to zero, while the estimated polynomials had the values different than zero, ranging from -4.8 to +4.7 (Tables 1, 2, 3). If coefficient a is zero, grain filling rate is also zero and the term b1Xi can be
omitted and substituted by the curve i=b2Xi2+b3Xi3 (Fu et al., 2009). PRŽULJ (2001)
concluded that polynomial functions are appropriate in situations when grain weight decreases after reaching a maximum, which was not the case with the cultivars used in our investigation (Figure 1).
Many equations have been proposed to describe the sigmoid growth (SANTIVERI
et al., 2002). The logistic curve describes a situation in which grain weight does not necessarily decrease when maximum dry matter in achieved; therefore, the logistic curve could adequately describe the pattern of grain filling (YINet al., 2003; YINet al., 2009). In the logistic as well as the RICHARDS, GOMPERTZ and WEIBULL
functions, however, an actual weight equal to wmax cannot be predicted because these
function have the line w=wmax as their upper asymptote while the time goes to
Table 1. Stepwise regression for fitting an appropriate polynomial model to grain filling data for the winter wheat variety Prima in the growing seasons 2002/03-2006/07
Term
x x2 x3 x4 x5 x6 R2
20
02
/0
3 *
§ * n§§ * * * * * * * 0,9654* 0,9864* 0,9974* 0,9995*
y = 2.785 – 0.082x + 7.5E-4x2 - 1E-0.6x3 + 5E-10x4
* * * * n * * * n * * n * * * 0,9746* 0,9785* 0,9986* 0,9992* 0,9994* 20 03 /0 4
y = 1.737 – 0.024x + 8E-05x2 + 3E-07x3 - 6E-10x4 + 3E-13x5
* * n * * * * * * * 0,9461* 0,9766* 0,9905* 0,9976* 20 04 /0 5
y = 4.705 – 0.100x + 5.59E-4x2 – 7E-07x3 + 2E-10x4
* * n * n * * * * n * * * n * * * * * * * 0,9645* 0,9764* 0,9968* 0,9986* 0,9993* 0,9996* 20 05 /0 6
y =-1.12+0.68x-6.9E-4x2-3.4E-6x3-6.2E-9x4+4.9E-12x5-1.5E-15x6
* * * * * * * * * * 0,9685* 0,9908* 0,9982* 0,9993* G ro w in g se as on 20 06 /0 7
y = 0.911 – 0.018x + 2.58E-4x2 – 3E-0.7x3 + 1E-10x4 §- significant at =0.05 level, §§ - non-significant
weight that is equal to wmax. Analyzing the data for rice, EGLI (2004) showed that a
cubic polynomial fitted better grain filling than the logistic and Gompertz curves.
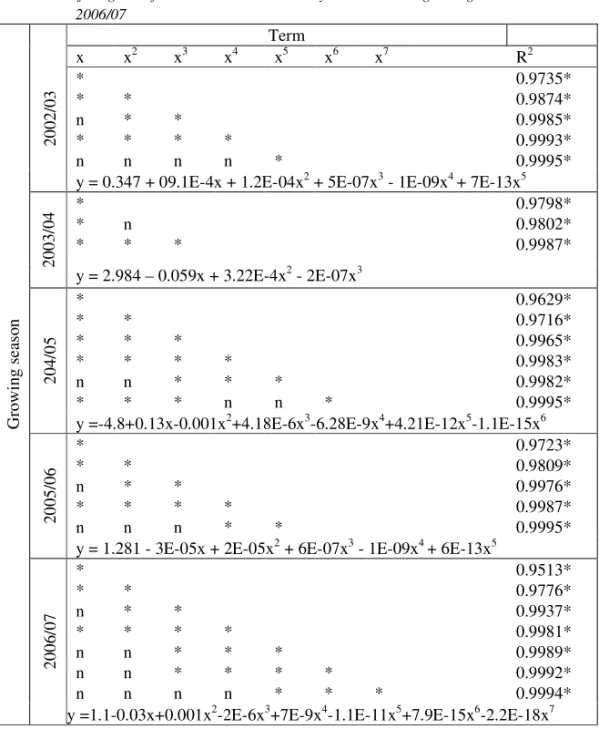
Table 2. Stepwise regression for fitting an appropriate polynomial model to grain
filling data for the winter wheat variety Pobeda in the growing seasons 2002/03-2006/07
Term
x x2 x3 x4 x5 x6 x7 R2
20
02
/0
3 * *
n * n * * * n * * n *
n *
0.9735* 0.9874* 0.9985* 0.9993* 0.9995* y = 0.347 + 09.1E-4x + 1.2E-04x2 + 5E-07x3 - 1E-09x4 + 7E-13x5
* * * n * * 0.9798* 0.9802* 0.9987* 20 03 /0 4
y = 2.984 – 0.059x + 3.22E-4x2 - 2E-07x3
* * * * n * * * * n * * * * * * *
n * n *
0.9629* 0.9716* 0.9965* 0.9983* 0.9982* 0.9995* 20 4/ 05
y =-4.8+0.13x-0.001x2+4.18E-6x3-6.28E-9x4+4.21E-12x5-1.1E-15x6
* * n * n * * * n * *
n * * *
0.9723* 0.9809* 0.9976* 0.9987* 0.9995* 20 05 /0 6
y = 1.281 - 3E-05x + 2E-05x2 + 6E-07x3 - 1E-09x4 + 6E-13x5
* * n * n n n * * * n n n * * * * n * * * n * * * * * * 0.9513* 0.9776* 0.9937* 0.9981* 0.9989* 0.9992* 0.9994* G ro w in g se as on 20 06 /0 7
y =1.1-0.03x+0.001x2-2E-6x3+7E-9x4-1.1E-11x5+7.9E-15x6-2.2E-18x7
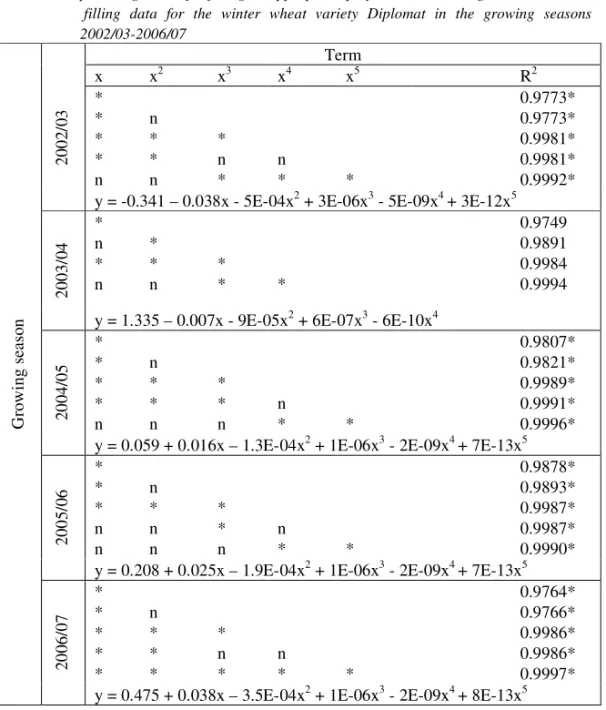
Table 3. Stepwise regression for fitting an appropriate polynomial model to grain
filling data for the winter wheat variety Diplomat in the growing seasons 2002/03-2006/07
Term
x x2 x3 x4 x5 R2
20
02
/0
3 * *
* * n n * * n * n * n * * 0.9773* 0.9773* 0.9981* 0.9981* 0.9992* y = -0.341 – 0.038x - 5E-04x2 + 3E-06x3 - 5E-09x4 + 3E-12x5
* n * n * * n * * * 0.9749 0.9891 0.9984 0.9994 20 03 /0 4
y = 1.335 – 0.007x - 9E-05x2 + 6E-07x3 - 6E-10x4
* * * * n n * * n * *
n n * *
0.9807* 0.9821* 0.9989* 0.9991* 0.9996* 20 04 /0 5
y = 0.059 + 0.016x – 1.3E-04x2 + 1E-06x3 - 2E-09x4 + 7E-13x5
* * * n n n * n n * *
n n * *
0.9878* 0.9893* 0.9987* 0.9987* 0.9990* 20 05 /0 6
y = 0.208 + 0.025x – 1.9E-04x2 + 1E-06x3 - 2E-09x4 + 7E-13x5
* * * * * n * * * * n * n * * 0.9764* 0.9766* 0.9986* 0.9986* 0.9997* G ro w in g se as on 20 06 /0 7
y = 0.475 + 0.038x – 3.5E-04x2 + 1E-06x3 - 2E-09x4 + 8E-13x5
Winter wheat cultivar
Prima
Pobeda
Diplomat
20
02
/0
3
20
03
/0
4
20
04
/0
5
20
05
/0
6
G
ro
w
in
g
se
as
on
20
06
/0
7
The cubic curve is symmetrical, presenting the period from anthesis to physiological maturity with the maximum slope, i.e., with the inflection point midway through the growth period, which is not quite true from the biological point. Although the cubic polynomial has obvious disadvantages, it still could be applied for description of the grain filling pattern in the tested winter wheat cultivars.
CONCLUSIONS
The stepwise regression procedure showed that grain filling is a complex biological process and that it is difficult to offer a simple and accurate polynomial equation that fits the data of dry matter changes during grain filling, i.e., from anthesis to maximum weight, in winter wheat. If this procedure is followed, polynomials with high powers, mostly quartic and quintic, should to be used to describe grain filling. Although it has certain disadvantages, the cubic equation could be used to describe the pattern of grain filling in winter wheat.
ACKNOWLEDGMENTS
This research was supported by the project TR 031066 provided by the Ministry of Science and Technological Development of the Republic of Serbia.
Received, September 20rd2011 Accepted, November 17th 2011
REFERENCES
HUTH, M.E. PROBERT (2002): Simulation of grain protein content with APSIM-Nwheat. Eur. J. Agron. 16: 25-42.
DENNIS, B.E. (2004): Seed-Fill Duration and Yield of Grain Corns. Advances in Agronomy 83: 243-279. EGLI, D.B. (2004): Seed-Fill Duration and Yield of Grain Crops. Advances in Agronomy 83: 243-279. EHDAIE, B., G.A. ALLOUSH, M.A. MADORE, J.G. WAINES (2006): Genotypic variation for stem reserves and
mobilization in wheat. I. Postanthesis changes in internode dry matter. Crop Science 46: 735-746.
EHDAIE, B., G.A. ALLOUSH, J.G. WAINES (2008): Genotypic variation in linear rate of grain growth and contribution of stem reserves to grain yield in wheat. Field Crops Research 106: 34-43. FU, X.L., Z. MING, Z. BAO-YUAN, C. GUO-MEI, D. ZAI-SONG (2009): Optimnal Model for Dynamic
Characteristic of Grain Weight Commonly Used in Wheat and Maize. Acta Agronomica Sinica 35:2: 309-316.
MASONI, A., L. ERCOLI, M. MARIOTTI, I. ARDUINI (2007): Post-anthesis accumulation and remobilization of dry matter, nitrogen and phosphorus in durum wheat as affected by soil type. European Journal of Agronomy 26:3 179-186.
MAYDUP, M.L., M. ANTONIETTA, J.J. GUIAMET, C. GRACIANO, J.R. LÓPEZ, E.A. TAMBUSSI (2010): The contribution of ear photosynthesis to grain filling in bread wheat (Triticum aestivum L.). Field Crops Research 119:1 48-58.
MICHELE, R., R. NICOLA, F. ZINA (2003): Evaluation and application of the OILCROP-SUN model for
sunflower in southern Italy. Agric. Sys. 78: 17-30.
PAN, J., Y. ZHU, D.JIANG, T.B. DAI, Y.X. LI, W.X. CAO (2006): modeling plant nitrogen uptake and grain nitrogen accumulation in wheat. Field Crop Res. 97: 322-336.
PAN, J., Y. ZHU, W. CAO (2007): Modeling plant carbon flow and grain starch accumulation in wheat. Field Crop Research 101: 276-784.
PEPLER, S., M.J. GOODING, R.H. ELLIS (2006): Modelling simultaneously water content and dry matter
dynamics of wheat grains. Field Crops Research 95:1 49-63.
PRŽULJ, N., V. MOM ILOVI (2001): Genetic variation for dry matter and nitrogen accumulation and translocation in two-rowed spring barley. I. Dry matter translocation. European Journal of Agronomy 15: 241-254.
PRŽULJ, N., V. MOM ILOVI (2003): Dry matter and nitrogen accumulation and use in spring barley. Plant,
Soil and Environment 49:1: 36-47.
PRŽULJ, N., V. MOM ILOVI (2011): Characterization of vegetative and grain filling periods of winter
wheat by stepwise regression procedure. I. Vegetative period. Genetika 43:2 349 - 361. RAJALA, A., K. HAKALA, P. MÄKELÄ, S. MUURINEN, P. PELTONEN-SAINIO (2009): Spring wheat response to
timing of water deficit through sink and grain filling capacity. Field Crops Research 114: 2 263-271.
SANTIVERI, F., C. ROYO, I. ROMAGOSA (2002): Patterns of grain filling of spring and winter hexaploid triticales. European Journal of Agronomy 16:3 219-230.
SLAFER, G.A., E.M. WHITECHURCH (2001): Manipulating wheat development to improve adaptation and to search for alternative opportunities to increase yield potential. In: Reynolds MP, Ortiz-Monasterio JI, McNab A (Eds), Application of Physiology in Wheat Breeding, CIMMYT, Mexico, DF, pp. 160-170.
VOLTAS, J., F.A. VAN EEUWIJK, A. SOMBRERO, A. LAFARGA, E. IGARTUA, I. ROMAGOSA (1999): Integrating
statistical and ecophysiological analyses of genotype by environment interaction for grain filling in barley. I. Individual grain weight. Field Crops Research 62: 63-74.
YIN, X., J. GOUDRIAAN, A. E LANTINGA, J. VOS, J.H. SPIERTZ (2003): A Flexible Sigmoid Function of Determinate Growth. Annals of Botany 91: 361-371.
YIN, X., W. GUO, J. H. SPIERTZ (2009): A quantitative approach to characterize sink–source relationships during grain filling in contrasting wheat genotypes. Field Crops Research 114: 1:119-126. WEISS, A., A. MORENO-SOTOMAYER (2006). Simulating grain mass and nitrogen concentration in wheat.
Europ. J. Agronomy 25: 129–137.
ZAR, J.H. (1996): Biostatistical analysis. 3rd ed. Prentice Hall, pp 285-305.
ANALIZA VEGETATIVNOG PERIODA I PERIODA NALIVANJA ZRNA KOD OZIME PŠENICE HIJERARHIJSKIM MODELOM VIŠESTRUKE
REGRESIJE. II. PERIOD NALIVANJA ZRNA
Novo PRŽULJ, Vojislava MOM ILOVI
Institut za ratarstvo i povrtarstvo, Novi Sad, Srbija
I z v o d
Stopa i trajanje akumulacije suve materije u zrnu zavisi od genotipa i uslova gajenja. Cilj ovoga istraživanja bio je da se metodom hijerarhijske višestruke regresije odredi matemati ki model nalivanja zrna kod tri sorte ozime pšenice. Ovaj metod je pokazao da je nalivanje zrna kompleksan biološki proces, i da je teško odrediti jedinstvenu i odgovaraju u matemati ku jedna inu koja bi odre ivala promenu u sadržaju suve materije u zrnu od cvetanja do postizanja maksimalne mase zrna. Primenom navedenog metoda utvr eno je da se promena u masi zrna tokom njegovog nalivanja može predstaviti polinomom etvrtog ili petog stepena. Pošto se radi o prili no komplikovanim jedna inama predlaže se primena, kubna jedna ina, uprkos njenim odre enim nedostacima.