3-way Networks: Application of Hypergraphs
for Modelling Increased Complexity in
Comparative Genomics
Deborah A Weighill1,2,3, Daniel A Jacobson1,2*
1Institute for Wine Biotechnology, Stellenbosch University, Stellenbosch, South Africa,2Comparative Genomics Group, Biosciences Division, Oak Ridge National Laboratory, Oak Ridge, Tennessee, United States of America,3Bredesen Center for Interdisciplinary Research and Graduate Education, University of Tennessee, Knoxville, Tennessee, United States of America
Abstract
We present and develop the theory of 3-way networks, a type of hypergraph in which each edge models relationships between triplets of objects as opposed to pairs of objects as done by standard network models. We explore approaches of how to prune these 3-way networks, illustrate their utility in comparative genomics and demonstrate how they find rela-tionships which would be missed by standard 2-way network models using a phylogenomic dataset of 211 bacterial genomes.
Author Summary
Genomes contain the information underlying the molecular functions of an organism. One way to compare the entire genomes of different organisms is to compare their gene-family content profiles which is effectively a comparison of their functional potential. Standard networks, when used to model phylogenomic similarities, are not capable of cap-turing some of the underlying complexity of the relationships between genomes. In order to address this, we have developed a new three-way similarity metric and constructed three-way networks modelling the relationships between 211 bacterial genomes. We find that such three-way networks find cross-species genomic similarities that would have been otherwise missed by simpler models such as standard networks.
Introduction
Network models are a useful reductionist approach for modelling complex systems. Networks involve representing a collection of objects as nodes, and representing relationships between those objects as edges. Thus networks model a system in a pairwise manner, breaking a system down into individual parts (nodes), modelling relationships between pairs of these individual parts (edges) and then reconstructing the system as a network [1]. However, modelling a sys-tem based on only pairwise relationships biases the model against more complex relationships
OPEN ACCESS
Citation:Weighill DA, Jacobson DA (2015) 3-way Networks: Application of Hypergraphs for Modelling Increased Complexity in Comparative Genomics. PLoS Comput Biol 11(3): e1004079. doi:10.1371/ journal.pcbi.1004079
Editor:Christos A. Ouzounis, Hellas, Greece
Received:July 28, 2014
Accepted:December 8, 2014
Published:March 27, 2015
Copyright:© 2015 Weighill, Jacobson. This is an open access article distributed under the terms of the
Creative Commons Attribution License, which permits unrestricted use, distribution, and reproduction in any medium, provided the original author and source are credited.
Data Availability Statement:All genome sequences can be found at the NCBI genome repository (ftp://ftp. ncbi.nlm.nih.gov/genomes/) and the NCBI ids can be found inS1 Text.
that may exist in the system. To this end, we introduce a new ternary network definition, namely 3-way networks based on the concept of hypergraphs. A Hypergraph is a generalized network, in which an edge can model the relationship between an arbitrary number of objects [2,3]. Clustering algorithms for hypergraphs, also known as Hypergraph Partitioning algo-rithms, have been developed in which nodes of a graph are assigned tokpartitions. This can be performed by minimising the net cut, which is defined as the number of hyperedges which con-nect nodes in different partitions [3]. Software packages such as hMetis [4] are available to per-form thisk-way clustering.
In this work, we use 3-way networks to model the relationships between triplets of objects instead of pairs of objects. The concept of calculating the similarity between objects three at a time is not a novel concept [5–7] and general hypergraphs [2] have previously been used in cer-tain areas of biology, including metabolic modelling, gene expression and RNA interaction studies [8–12]. However, to our knowledge, this is the first time that the concept of 3-way net-works has been applied in the field of comparative genomics.
In this study, we develop the theory around 3-way networks in terms of abstract definition, weighting 3-way networks and pruning 3-way networks. We develop a new 3-way metric for the weighting of 3-way edges. We then apply a 3-way network model to a set of 211 bacterial genomes, modelling the similarities between the bacteria on a whole genome scale, (based on gene family content), and compare the resulting 3-way networks to those obtained using stan-dard 2-way network models.
Results/Discussion
Definition of 3-way Networks
A network, or graph,Gis an ordered pair, defined as
G¼ ðV;EÞ ð1Þ
whereV= {v1,v2,. . .,vn} is a set ofnnodes andE= {e1,e2,. . .,em} is a set ofmedges [13]. In
this case, nodes represent a certain set of objects of interest and edges can be interpreted as rela-tionships between these objects. In particular, edges represent pairwise relarela-tionships and thus are defined (for an undirected network) as pairs of nodes. For clarity, we refer to these networks as 2-way networks because of the pairwise nature of the edges. With the aim of modelling higher order relationships than simply pairwise relationships, we define 3-way networks as network models of ternary relationships, i.e. relationships between triplets of objects. 3-way networks are defined by replacing the previous definition of an edge as a set of 2 nodes by a set of 3 nodes. Thus a 3-way network is a type of hypergraph [2]. This can be formalized with the following definition:
Definition 1.A 3-way network is a graphG= (V,E) whereV= {v1,v2,. . .,vn} is the set of
nodes andE= {e1,e2,. . .,em} is the set of edges. Each edgeeiis defined as a set of 3 nodes,ei=
{vx,vy,vz} wherex,y,z2{1, 2, 3,. . .,m}.
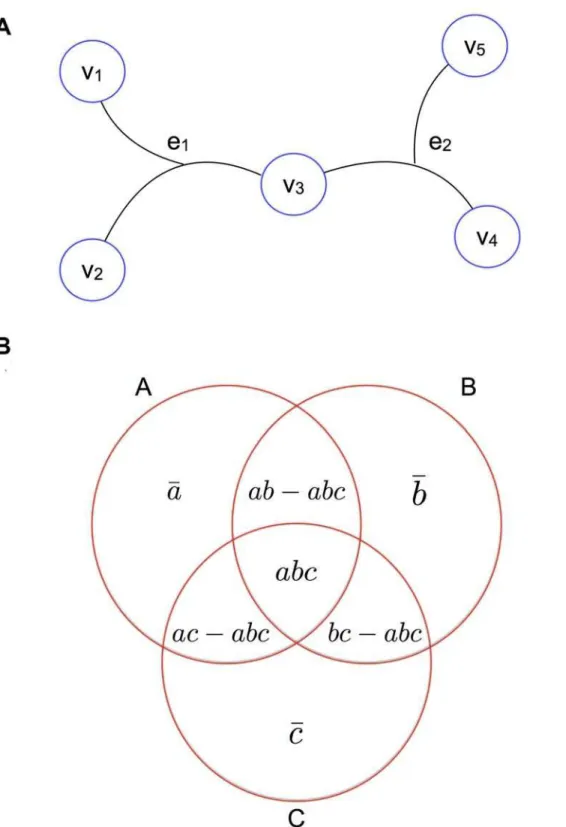
Graphically, each 3-way edge is a line connecting 3 nodes, which can be interpreted as a re-lationship between 3 objects. An example of a 3-way network with 5 nodes,V= {v1,v2,v3,v4,
v5} and 2 edges,E= {e1,e2} = {{v1,v2,v3}, {v3,v4,v5}} is shown inFig. 1a.
Weighted 3-way Networks
3-way Sørensen Index. In a 2-way network, each edge can be assigned a weight indicating
the strength of the relationship between the two nodes the edge is connecting. This concept can easily be extended to a 3-way network, in which an edge weight will indicate the strength of the
under contract DE-AC05-00OR22725. This manuscript has been authored by UT-Battelle, LLC under Contract No. DE-AC05-00OR22725 with the U. S. Department of Energy. The United States Government retains and the publisher, by accepting the article for publication, acknowledges that the United States Government retains a non-exclusive, paid-up, irrevocable, world-wide license to publish or reproduce the published form of this manuscript, or allow others to do so, for United States Government purposes. The Department of Energy will provide public access to these results of federally sponsored research in accordance with the DOE Public Access Plan ( http://energy.gov/downloads/doe-public-access-plan). The funders had no role in study design, data collection and analysis, decision to publish, or preparation of the manuscript. South African National Research Foundation Technology(www.nrf.ac.za) and Human Resources Programme (DAJ) and Winetech (DAJ DAW). The financial assistance of the National Research Foundation (NRF) towards this research is hereby acknowledged (DAW). Opinions expressed and conclusions arrived at, are those of the author and are not necessarily to be attributed to the NRF.
Fig 1. 3-way edges and intersections.(a) A small, 3-way network consisting of 5 nodesv1,v2,v3,v4andv5and two 3-way edgese1ande2. Edgee1
connects nodesv3,v4andv5and edgee2connects nodesv1,v2andv3. (b) Venn diagram for a 3-way intersection of species.ais the number of families
present in speciesA,bis the number of families present in speciesB,cis the number of families present in speciesC,abis the number of families present in
speciesAand speciesB,acis the number of families present in speciesAand speciesC,bcis the number of families present in speciesBand speciesC,
abcis the number of families present in speciesA,BandC,ais the number of families present only in speciesA,b
is the number of families present only in speciesBandcis the number of families present only in speciesC.
relationship between the 3 nodes the edge is connecting. For a 3-way network, this requires a similarity metric which quantifies the similarity between 3 objects at a time. Assuming that each object is represented by a vector, a similarity metric which quantifies the similarity be-tween 3 vectors is needed. The Sørensen Index [14] is a similarity metric which quantifies the overlap between the features of pairs of objects. LetAandBbe two objects and let each object be viewed as a set of features. The Sørensen IndexS2(A,B) is defined as:
S2ðA;BÞ ¼
2ab
aþb ð2Þ
whereais the number of features of objectA,bis the number of features of objectBandabis interpreted as the number of features shared by objectAand objectB[15]. If objects are repre-sented by vectors, the Sørensen Index between two vectorsXandYcan be expressed as:
S2ðX;YÞ ¼2 P
iminðXBi;YBiÞ
P
iðXBiþYBiÞ
ð3Þ
whereXBandYBare binary vectors defined as:
XBi¼
1 if X
i 1
0 if X
i ¼0
ð4Þ (
YBi ¼
1 if Y
i 1
0 if Y
i ¼0
ð5Þ (
An extension of the Sørensen Index exists for calculating the similarity between triplets of objects. This metric was originally developed for quantifying the similarity between the species content of different biological samples [5]. Generally, for each triplet of objectsA,B, andC, each represented by a vector, the three-way Sørensen index can be defined as:
S3ðABCÞ ¼3
2
abþacþbc abc aþbþc
ð6Þ
whereais the number of features present in objectA,bis the number of features present in ob-jectB,cis the number of features present in objectC,abis the number of features present in objectAand objectB,acis the number of features present in objectAand objectC,bcis the number of features present in objectBand objectCandabcis the number of features present in objectA,BandC[5]. These variables can be visualized on a venn diagram (Fig. 1b).
The 3-way Sørensen Index can also be expressed in vector format as follows:
S3ðX;Y;ZÞ ¼
3
2 X
i minðXBi;YBiÞ þminðXBi;ZBiÞ þminðYB i;ZBiÞ minðXBi;YBi;ZBiÞ
P
iðXBiþYBiþZB iÞ
ð7Þ
3-way Czekanowski Index. A quantitative version of the Sørensen Index is called the
Cze-kanowski Index [16]. For two vectorsXandY, the Czekanowski Index is defined as:
C2ðX;YÞ ¼
2P
iminðXi;YiÞ
P
iðXiþYiÞ
ð8Þ
Czekanowski Index to a 3-way form. For 3 vectorsX,YandZ, we have defined the 3-way Cze-kanowski Index between the three vectors as:
C3ðX;Y;ZÞ ¼
3
2 X
iðminðXi;YiÞ þminðXi;ZiÞ þminðYi;ZiÞ minðXi;Yi;ZiÞÞ
P
iðXiþYiþZiÞ
ð9Þ
Pruning 3-way Networks
Many approaches used to prune edges from a network such as Maximum Spanning Tree (MST) algorithms and clustering algorithms are designed for 2-way networks and are not di-rectly applicable to 3-way networks. However, certain approaches are easily transferable to 3-way networks, namely thresholding and best-edge selection.
Thresholding. Thresholding can easily be transferred from a 2-way network to a 3-way
network. Thresholding is one of the simplest ways to prune any network. A threshold is set and edges with a weight below the chosen threshold are removed. In order to determine a justifiable threshold for a 3-way Sørensen network we have developed the following theorem:
Theorem 1.If the intersection of three objectsabcis zero (i.e. there is no feature present in all three objects), thenS3ðABCÞ
3 4. Proof.Ifabc= 0, then
S3ðABCÞ ¼ 32:abþacþbc abc
aþbþc
¼ 32: abþacþbc abc
2ðabþacþbcÞ þaþbþc
¼ 32: abþacþbc
2ðabþacþbcÞ þaþbþc:
wherea,b, andcare defined inFig. 1b. There are two cases to consider. Case 1: Ifa,bandcare all equal to 0, then
S3ðABCÞ ¼ 32: abþacþbc
2ðabþacþbcÞ þaþbþc
¼ 32: abþacþbc
2ðabþacþbcÞ
¼ 32:
1
2
¼ 34:
Thus ifabc= 0 anda,bandcare all equal to 0 thenS
ABC¼
3 4.
Case 2: Ifa,bandcare all greater than zero 0 (they cannot be less than zero, since there can-not be a negative number of features associated with an object), then
2ðabþacþbcÞ þaþbþc > 2ðabþacþbcÞ
Therefore; S3ðABCÞ ¼ 32: abþacþbc
2ðabþacþbcÞ þaþbþc
<
3
2:
abþacþbc 2ðabþacþbcÞ
Thus ifabc= 0 anda,bandcare all greater than zero 0,S3ðABCÞ<3
4. Combining these two cases, we can conclude that ifabc= 0,S3ðABCÞ 3
4. This implies that, for a given 3 species, there are no gene families present in only one of the 3 species, then the 3-way Sørensen Index between the 3 species will be greater than 0.75.
A similar thresholding strategy can be adopted for the 3-way Czekanowski Index. We need the following:
Lemma 1.Given integersa,bandc, the following relation holds:
minða;bÞ þminða;cÞ minða;b;cÞ a ð10Þ
We now prove a theorem similar to Theorem 1, but relating to the 3-way Czekanowski Index.
Theorem 2.Given 3 speciesX,Y, andZ, if there is no gene family present in all 3 species,
thenC3ðXYZÞ 3 4.
Proof.If there is no gene family present in all 3 speciesX,YandZ, then∑imin(Xi,Yi.Zi) = 0. Therefore,
C3ðX;Y;ZÞ ¼
3
2
X
iðminðXi;YiÞ þminðXi;ZiÞ þminðYi;ZiÞ minðXi;Yi;ZiÞÞ
P
iðXiþYiþZiÞ
¼
3
2
X
iðminðXi;YiÞ þminðXi;ZiÞ þminðYi;ZiÞÞ
X
iðminðXi;Yi;ZiÞÞ
P
iðXiþYiþZiÞ
¼
3
2
X
iðminðXi;YiÞ þminðXi;ZiÞ þminðYi;ZiÞÞ
P
iðXiþYiþZiÞ
Using Lemma 1, this can be expanded as:
C3ðX;Y;ZÞ ¼
3
2
X
iðminðXi;YiÞ þminðXi;ZiÞ þminðYi;ZiÞÞ
P
iðXiþYiþZiÞ
3
2
X
iðminðXi;YiÞ þminðXi;ZiÞ þminðYi;ZiÞÞ
2P
iðminðXi;YiÞ þminðXi;ZiÞ þminðYi;ZiÞÞ
¼ 3
4
Thus if∑imin(Xi,Yi.Zi) = 0, thenC3ðX;Y;ZÞ 34.
Thus the minimum justifiable threshold for 3-way Sørensen and 3-way Czekanowski net-works is 0.75.
Best edges. Another simple way to prune a network is to select for each node, the bestx
Phylogenomic Networks of Bacterial Genomes
Gene families were calculated across a dataset consisting of 211 bacterial genomes using Tri-beMCL [17] and gene family content profiles constructed for each bacterial species. Various phylogenomic 2-way similarity, 3-way similarity and gene family enrichment networks were then constructed in order to investigate the relationships between the bacterial species based on gene family content and to compare the effect of 3-way networks as opposed to 2-way net-works. These networks are described below. In each network, nodes represent bacterial species and edges represent similarities between species based on 2-way or 3-way similarity between their gene family content profiles, or represent connections between species based on shared gene family enrichment.
3-way and 2-way Sørenesen networks. The concept of 3-way networks was developed in
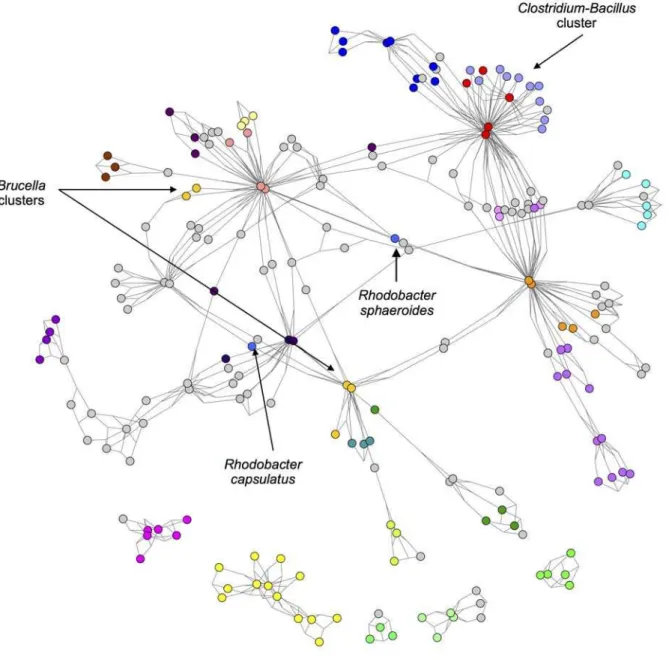
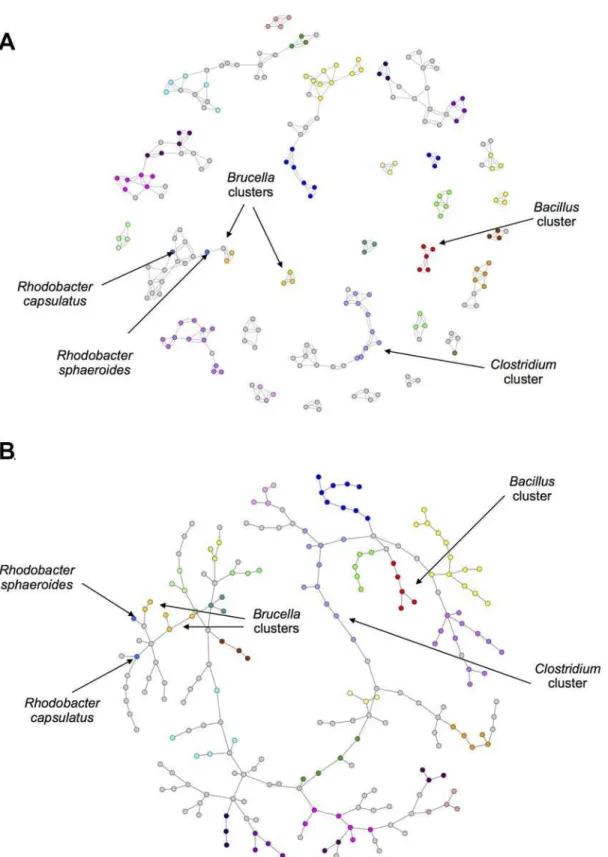
order to attempt to model more complex relationships that would otherwise be missed by pair-wise relationships. To this end, the definition of an edge was extended to represent a ternary re-lationship, i.e. a relationship between 3 nodes. In order to quantify these ternary relationships, a 3-way similarity metric was chosen, namely the Sørensen Index. This allowed“high order similarities”or similarities between more than two species to contribute to our interpretation. The 3-way Sørensen Index was used to quantify the similarity between all triplets of bacterial species, based on their gene family content. Applying a threshold of 0.76 allowed us to select for edges which we were sure had a contributing factor of the 3-way intersection and not sim-ply a high intersection between pairs of species (See Theorem 1). This thresholded network can be seen inS1 Fig. Large coloured nodes represent bacterial species and the combination of the small white nodes and the grey 2-way edges represent 3-way edges. Certain genera were select-ed and those bacterial species nodes colourselect-ed according to genus. (The default node colour was grey, thus grey nodes are not all in the same genus). The 3-way network was also pruned by se-lecting only the best and second best edge for each node. This best-edge 3-way Sørensen net-work can be seen inFig. 2.
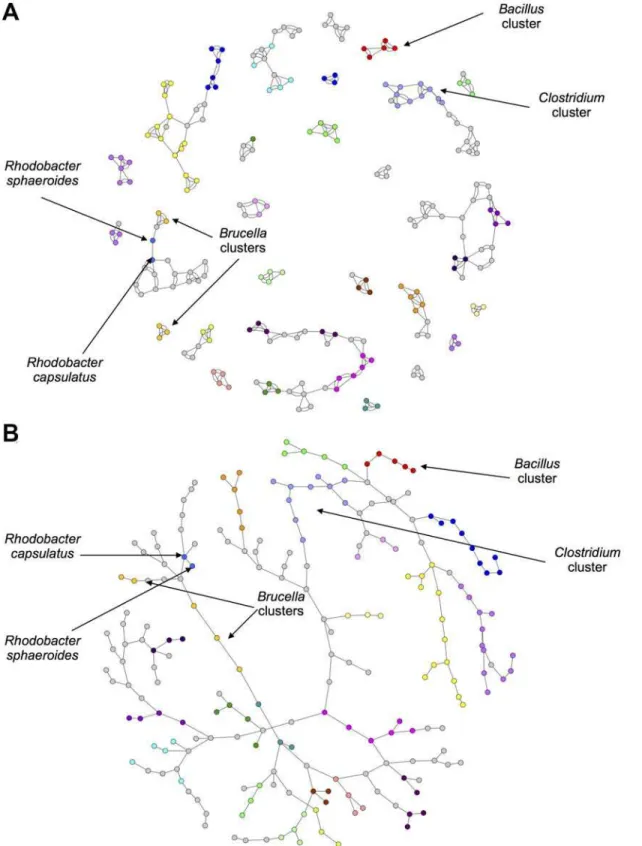
Networks were also constructed using the standard 2-way Sørensen Index and pruned using a best edge approach and a Maximum Spanning Tree (MST) approach. For the best edge ap-proach, the best and second best edges were selected for each node. The resulting network is shown inFig. 3a.
A Maximum Spanning Tree is a useful approach for sparsifying a network by isolating the ‘backbone’of the network as the shortest tree spanning all nodes which has maximum weight. The Sørensen MST can be seen inFig. 3b.
The 3-way networks inFig. 2andS1 Fig. have an interesting structure. In each network, nodes of the same colour group together, indicating that the genera group together well. The network shown inFig. 2especially seems to show an interesting middle ground between con-nectedness and modularity. There are generally many connections within genera, but also some connections between genera. In contrast to this is the 2-way Sørensen MST shown in Fig. 3b. MSTs, by there very nature, have no modularity. This is clear inFig. 3bwhere the gen-era do seem to group together, but there are no connections within the gengen-era. MSTs thus give limited information, and should be used in combination with other types of networks and pruning methods. The 2-way Sørensen best edge network (Fig. 3a) was constructed by selecting only the best and second best edges for each node from the standard 2-way Sørensen network. It would appear that this 2-way best edge network is overly sparse, and does not give much in-formation about the connectedness between genera. It would seem that the genera are also not as well grouped as in the 3-way best-edge network.
3-way and 2-way Czekanowski networks. A new 3-way metric was developed called the
Fig 2. Best-Edges 3-way Sørensen Network.3-way Sørensen network pruned by selecting the best and second best edge for each node. Nodes represent
bacterial species and edges represent similarity between triplets of bacterial species based on gene family content, quantified using the 3-way Sørensen Index. Nodes are coloured according to genus. Default colour is grey.
Fig 3. 2-way Sørensen Networks.(a) 2-way Sørensen Best Edges Network (b) Maximum Spanning Tree (MST) of the all-vs-all Sørensen network. Nodes represent bacterial species and edges represent similarity between pairs of bacterial species based on gene family content, quantified using the 3-way Sørensen Index. Nodes are coloured according to genus. The same node colour key as inFig. 2applies.
the same way that the 3-way Sørensen Index [5] is an extension of the original 2-way Sørensen Index [15]. A 3-way network was constructed using the 3-way Czekanowski Index and pruned in the same way described above for the 3-way Sørensen network. The thresholded 3-way Cze-kanowski network and the best-edge 3-way CzeCze-kanowski network can be seen inS3and4Figs. respectively. Networks were also constructed using the standard 2-way Czekanowski Index and can be seen in Figs.5a and 5b.
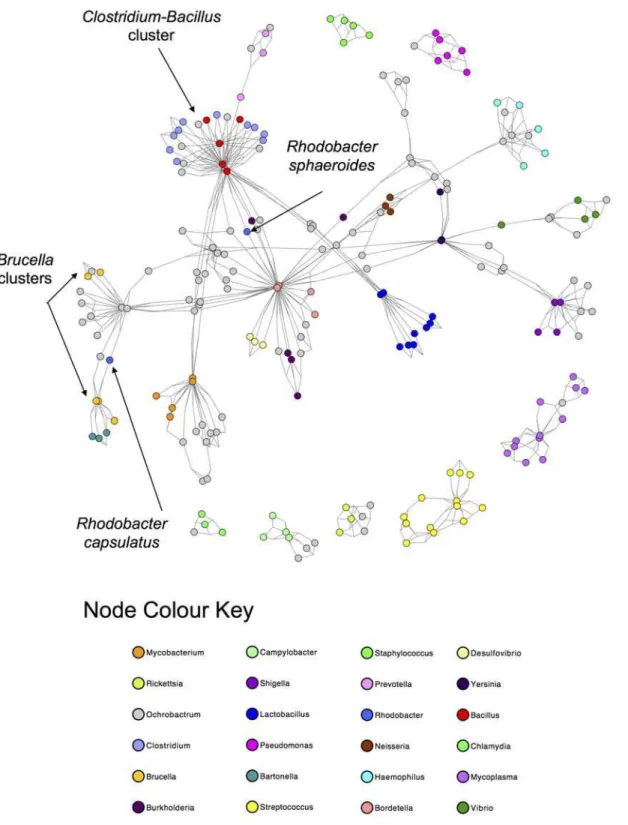
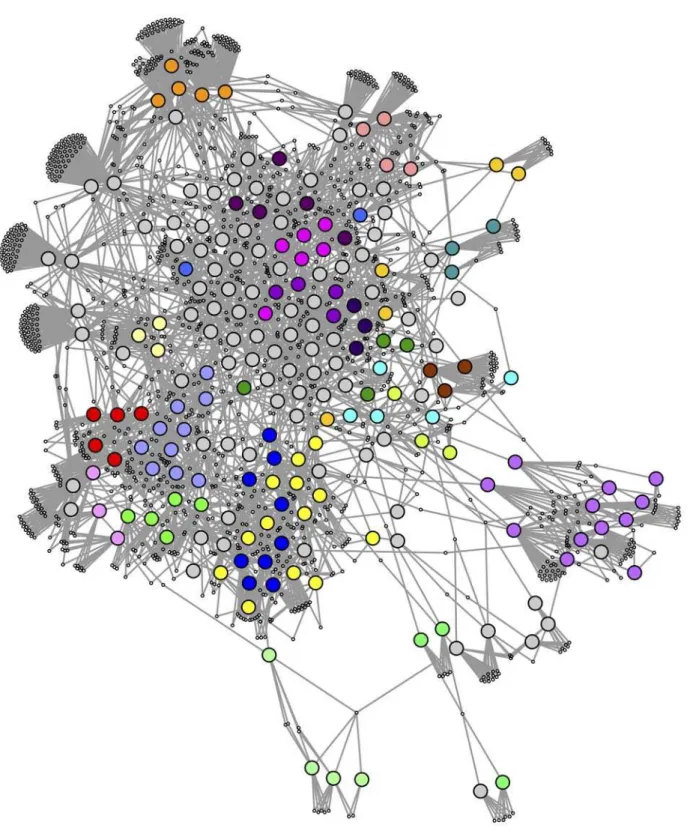
Gene family enrichment networks. In order to get another perspective on the
relation-ships between the bacteria species based on gene families, a gene family enrichment network was constructed (Fig. 6). In this network, large, coloured nodes represent bacterial species and small white nodes represent gene families which are enriched in more than one species as de-termined using Fisher’s Exact Test [18] Each gene family node is connected to the species in which the gene family is enriched. It can clearly be seen that the genera group together well in this network. Shared enriched families thus seem to be a competent measure of species similar-ity. This network also allows us to target gene families which seem to be distinguishing charac-teristics of small groups of species.
Network comparison. The 3-way Sørensen networks often support the interpretations of
the 2-way networks. However, in some cases, the 3-way networks give new information which differs from that of the 2-way networks. A selection of examples have been selected in order to illustrate situations where the 3-way networks differ from 2-way networks, as well as examples where there is agreement between 2-way and 3-way networks. A procedure was implemented to calculate a“measure of disagreement”between the local topologies of genera between 2-way and 3-way networks. The number of edges within and between genera were quantified for each genera in 2-way and 3-way networks by counting the number of inbound edges (edges con-necting species within genera) and outbound edges (edges concon-necting species across genera). A ratio of inbound over outbound edges was then calculated for each genera in 2-way networks and in 3-way networks, as well as the reciprocal ratio. These values were ranked for each net-work, and the differences between the rank of a genera’s ratio between the two types of net-works were calculated. This was performed for both orientations of the ratio. These scores (see SupplementaryS1 Table) give an indication of how different the modularity of a genus is be-tween 2-way and 3-way networks, with larger values indicating a larger difference. The exam-ples chosen to illustrate differences between the two types of networks did indeed have high scores.
Clostridium-Bacilluscluster. The cluster of red and light blue nodes in the 3-way
between the two genera which is not seen in the 2-way networks, which is further supported by the gene family enrichment data.
Gene families which were enriched in both genera, and present in at least 3 species were se-lected for further analysis. The genes in these gene families were then compared against all ClostridiumandBacillusproteins in NCBI using BLAST [19,20]. Many of the genes identified were related to sporulation.ClostridiumandBacillusspecies are known to sporulate and there Fig 4. Best-Edges 3-way Czekanowski Network.3-way Czekanowski network pruned by selecting the best and second best edge for each node. Nodes represent bacterial species and edges represent similarity between triplets of bacterial species based on gene family content, quantified using the 3-way Czekanowski Index. Nodes are coloured according to genus. The same node colour key as inFig. 2applies.
Fig 5. 2-way Czekanowski Networks.(a) 2-way Czekanowski Best Edges Network (b) Maximum Spanning Tree (MST) of the all-vs-all Czekanowski network. 3-way Sørensen network pruned by selecting the best and second best edge for each node. Nodes represent bacterial species and edges
represent similarity between pairs of bacterial species based on gene family content, quantified using the 3-way Sørensen Index. Nodes are coloured
Fig 7. Clostridium and Bacillus subnetwork.Subnetworks containing theClostridiumandBacillusspecies selected from (a) 3-way best edge Sørensen Network (b) 3-way best edge Czekanowski Network (c) Gene family enrichment network.
is literature evidence for the conservation of various sporulation genes across these two genera [21]. Sporulation is a process which involves the production of a endospores, which are dor-mant and highly resistent to environmental stresses [21]. Examples of genes in these gene fami-lies enriched in bothBacillusandClostridiumspecies were AbrB and GerKA, which are known to be involved in sporulation inBacillusspecies [22].
Another gene family enriched in bothClostridiumandBacillusspecies contained genes with polysaccharide deacetylase functions, in particular, the gene pdaB. There is literature evidence for the requirement of polysaccharide deacetylases for sporulation inBacillus subtilis, in which pdaB mutants were unable to properly maintain their spores in the later stages of sporulation [23]. The pdaA gene has also been found to be neccesary for spore germination inB. subtilis [24]. The enrichment of this family in bothClostridiumandBacillusspecies along with the other sporulation families could suggest a similar role of deacetylases in the sporulation of Clostridiumspecies.
We also found that another gene family enriched in bothBacillusandClostridiumspecies contained genes related to chemotaxis, namely a methyl accepting chemotaxis protein. Chemo-taxis and sporulation are oppositely regulated processes and are both regulated by the major sporulation regulating protein Spo0A [25]. Thus, it would appear that even thoughBacillus andClostridiumare quite distant phylogenetically, they share a set of sporulation related fami-lies which appear to be detected by 3-way networks, and are missed by simpler 2-way networks quantifying only 2-way relationships.
Brucellapartitioning. Species in the genusBrucellacan be found as light orange nodes. In
the Sørensen MST and the Czekanowski MST (Figs.3badd5brespectively), this genus is split into two groups, one group containingB. canis,B. abortisandB. ovis(Group 1), and the other group containingB. melitensisandB. suis(Group 2). These same separate groupings are also seen in the best-edge 3-way Sørensen network (Fig. 2) and best-edge 3-way Czekanowski net-work (Fig. 4). Thus using different 2-way and 3-way similarity metrics, theBrucellaspecies par-tition in the same way.Fig. 8a and bshow the neighbourhoods within one 3-way edge of the Brucellaspecies in the best edge Sørensen network and the best edge Czekanowski network re-spectively.Fig. 8cis a subnetwork of the enrichment network (Fig. 6) showing all nodes within a radius of 2 of theBrucellanodes. FromFig. 8the same groupings of the genus can be ob-served, thus this separation of the genus can be seen on a whole gene family profile scale, as well as on a gene family enrichment level. These groupings are different to the divergence pre-viously found in theBrucellagenus, in whichB. abortusclustered nearer toB. melitensisandB. suisclustered nearer toB. canis[26].
FromFig. 8 a and b, it can be seen that both the 3-way Sørensen and 3-way Czekanowski net-works groupBrucella ovis,Brucella canisandBrucella abortuswith members of theBartonella genus. This is supported by the gene family enrichment view inFig. 8c.Fig. 8a and balso suggests a relationship between Group 2Brucellaspecies andOchrobactrum anthropi. This is also seen in the gene family enrichment view. Of the 3-way networks, only the Czekanowski network suggests that Group 2 ofBrucellaspecies, namelyBrucella suisandBrucella melitensisgroup together with members of theBordetellagenus. This is also seen in the gene family enrichment view inFig. 8c. None of the 2-way networks suggested this connection. The 2-way MSTs (Figs.3band5b) show the proximity of Group 1 to theBartonellaspecies and the proximity of Group 2 toO. anthropi, however they do not suggest the link between Group 2Brucellaspecies andBordetellaspecies. The 2-way best edge networks (Figs.3aand5a) only show the connection between Group 2 and O. anthropi. They show none of the relationships suggested by 3-way networks between Group 1 andBartonellaspecies, and Group 2 andBordetellaspecies.
Rhodobacterseparation. Consider the genusRhodobacterin the above networks (two
Fig 8. Clustering withinBrucellagenus.Subnetworks containingBrucellaspecies constructed by selectingBrucellaspecies and all neighbouring species
nodes from (a) 3-way best edge Sørensen Network (b) 3-way best edge Czekanowski Network (c) Gene family enrichment network.
seen in the best edge Sørensen network (Fig. 3a). However, in both Czekanowski 2-way net-works (Figs.5b and 5a), these twoRhodobacterspecies are not neighbours. The 3-way Sørensen and 3-way Czekanowski networks (Figs.2and4) place these nodes quite far apart.Fig. 9a and bshow the neighbourhoods within one 3-way edge ofRhodobacterspecies in the 3-way Sørensen network and 3-way Czekanowski network respectively. From this figure, it can be seen that the nodes are in separate neighbourhoods. This is also seen in the enriched family view inFig. 9c. This figure shows the species which share at least one enriched family with Rho-dobacterspecies. Both Sørensen and Czekanowski best edge 3-way networks thus pick up a separation between the twoRhodobacterspecies which is supported by the gene family enrich-ment data and not found by the 2-way Sørensen networks.
Combination view:RhodobacterandBrucellaspecies. A further examination of Figs.8
and9shows that there seem to be overlaps between theBrucellagroupings inFig. 8and the Rhodobactergroupings inFig. 9.Fig. 10shows the neighbourhood aroundBrucellaspecies and Rhodobacter speciesin (a) the 3-way best edge Czekanowski network and (b) the gene family enrichment network. Group 1Brucellaspecies cluster withBartonellaspecies andRhodobacter capsulatusand Group 2Brucellaspecies cluster witthBordetellaspecies,Ochrobactrum athropi andRhodobacter sphaeroides. This amount of detail in groupings of species was not found in any of the 2-way networks.
Combined 2-way and 3-way networks. Merging the 3-way best edge Sørensen network
(Fig. 2) and the 2-way Sørensen MST (Fig. 3b) results in an interesting network which is shown inS4 Fig. This network combines the modularity of the 3-way network showing the connec-tions within genera and a few cross-genera connecconnec-tions with the MST which shows the overall connections across genera. This combined 2-way and 3-way Czekanowkski network (S5 Fig.) was also constructed by merging the 3-way best edge Czekanowski network (Fig. 4) and the 2-way Czekanowski MST (Fig. 5b). These combination networks provide an interesting,“best of both worlds”view. They combine the connectedness and simplicity of an MST, which allows for no modularity, but forces all nodes to connected to the network, and the modularity and complex relationships provided by the 3-way networks which show a mixture of within-mod-ule connection and inter-modwithin-mod-ule connections, and show relationships missed by standard 2-way networks.
Conclusions
3-way networks were explored for their use in comparative genomics and their utility in model-ling more complex relationships. These networks, when used to model the phylogenomic rela-tionships between 211 bacterial species revealed relarela-tionships between the species which were not found when using standard 2-way network models. These networks will be a useful tool for comparative genomics in order to model and reveal complex relationships.
Materials and Methods
Bacterial Gene Family Construction
Gene families were constructed using the TribeMCL pipeline [17]. An all-vs-all protein BLAST [19] was performed on the translated genomes of 211 bacterial species to calculate the sequence similarity between all pairs of proteins across the 211 bacterial genomes. An E-value cutoff of 10−5was used. The Perl scriptorthomclBlastParserfrom the OrthoMCL package [27]
Fig 9. Separation ofRhodobacterspecies.Subnetworks containingRhodobacterspecies constructed by selectingRhodobacterspecies and all neighbouring species nodes from (a) 3-way best edge Sørensen Network (b) 3-way best edge Czekanowski Network (c) Gene family enrichment network.
pair. For each gene pairab, a scoreSabwas calculated as [17]:
Sab¼log2
EabþEba
2
ð11Þ
whereEabandEbaare the E-values for the reciprocal BLAST hits between geneaand geneb. This resulted in a network in which each node represented a gene and each edgeabrepresented the similarity between the two nodes (aandb) which it connects, weighted by the similarity scoreSab. MCL was then applied using an inflation value of 2 to cluster the network into gene families [28]. From the resulting gene families, a matrix was constructed called the Species-Family (SF) matrix, in which the rows represented bacterial gene families constructed using TribeMCL, and columns represented bacterial species, and each entryijrepresented the num-ber of genes in gene familyipresent in speciesj.
3-way Network Construction
The 3-way Sørensen Index and the 3-way Czekanowski Index was used to quantify the similari-ty between each triplet of species. LetXiandYiandZirepresent theithelement in columnsX,Y andZof the SF-matrix (i.e. the number of members of gene familyiin speciesXspeciesYand speciesZrespectively. LetXB,YBandZBbe the binary vectors associated with vectorsX,Yand Zrespectively. For each triplet of species (X,Y,Z) the Sørensen Index was calculated using Equation 7and the Czekanowski Index was calculated usingEquation 9. This resulted in a Sørensen 3-way network and a Czekanowski 3-way network. Using Theorem 1, any threshold set above 0.75 will exclude any 3-way relationships with no 3-way intersection contribution. Thus, a threshold of 0.76 was applied to each network and visualized in Cytoscape [29] using an Allegro layout. These networks can be seen inS1andS2Figs. Cytoscape can only visualize 2-way networks in the sense that it can only handle edges connecting 2 nodes. To our knowl-edge, no visualization software exists for 3-way networks. Thus, the 3-way network had to be transformed such that it could be visualized in Cytoscape. To do so, each 3-way-edge was rep-resented by a node with degree 3, connected to the bacterial species nodes which the 3-way-edge connected. In the transformed network, each node thus either represented a bacterial spe-cies or a 3-way edge (referred to as an‘edge-node’). A close-up of these 3way-edges can be seen inS3 Fig.
A best-edge approach was also used to prune the 3-way networks. For each bacterial species node, the best and second best edges (edges with the highest and second highest weight) were selected. A network was constructed and transformed into a format which can be visualized in Cytoscape as described above. The resulting networks can be seen in Figs.2and4.
2-way Network Construction
inverted edge weightw0was calculated as
w0¼1 w
:
A Minimum Spanning Tree algorithm was then applied to the distance network using the Dijkstra algorithm from the Graph Perl Module (Jarkko Hietaniemi,http://www.cpan.org/). For best edge selection, the best and second best edge for each node was selected based on edge weight. These pruned networks were visualized in Cytoscape [29] using an Allegro layout, and can be seen in Figs.3a, 3b,5a and 5b.
Combined 2-way and 3-way Network Construction
For both the Sørensen Index and the Czekanowski Index, the union of the 3-way best-edge net-work and the 2-way MST was calculated, resulting in a combined netnet-work model. These can be seen inS4andS5Figs.
Gene Family Enrichment
Fisher’s exact test [18], followed by Holm-Bonferroni multiple hypothesis correction [30] was used to determine enrichment of gene families within species. A p-value cutoff of 0.05 was used. Gene families which were enriched in more than one species (so-called shared-enriched families) were selected and a new network was constructed in which each node represented ei-ther a bacterial species or a gene family, and each edge connected a gene family to bacterial spe-cies in which it was enriched. The spespe-cies were coloured according to their genera. The
network was visualized in Cytoscape [29] using an Allegro layout (Fig. 6).
Supporting Information
S1 Text. NCBI IDs.NCBI IDs for each of the 211 bacterial genomes.
(PDF)
S1 Table. Measure of disagreement.Difference between the ratios of inbound over outbound
edges (Di
o), as well as the difference between the reciprocal ratios (Do
i) for each genus in the 2-way and 3-way best edge networks.
(PDF)
S1 File. Cytoscape session.A Cytoscape session file containing the 2-way and 3-way networks.
(ZIP)
S1 Fig. Thresholded 3-way Sørensen Network.Network constructed by setting a 0.76
thresh-old for the 3-way Sørensen Network, and removing all 3-way edges below this threshthresh-old. (TIFF)
S2 Fig. Thresholded 3-way Czekanowski Network.Network constructed by setting a 0.76
threshold for the 3-way Czekanowski Network, and removing all 3-way edges below this threshold.
(TIFF)
S3 Fig. 3-way edges.Close-up of a section of the thresholded 3-way network showing the
3-way edges. Large, coloured nodes represent bacterial species, whereas small white nodes and their respective 3 edges represent 3-way edges connecting the bacterial nodes.
(TIFF)
S4 Fig. Union Sørensen MST and Sørensen 3-way Best Edge Network.Network constructed
(Fig. 3b). (TIFF)
S5 Fig. Union Czekanowski MST and Czekanowski 3-way Best Edge Network.Network
constructed by taking the union of the Czekanowski 3-way Best Edge Network (Fig. 4) and the Czekanowski MST (Fig. 5b).
(TIFF)
S6 Fig. Distributions.Distributions of the 2-way and 3-way similarity metrics.
(TIFF)
Acknowledgments
The authors would like to acknowledge The Centre for High Performance Computing and the Stellenbosch High Performance Computing Cluster for computing resources.
Author Contributions
Conceived and designed the experiments: DAW DAJ. Performed the experiments: DAW. Ana-lyzed the data: DAW DAJ. Contributed reagents/materials/analysis tools: DAW DAJ. Wrote the paper: DAW DAJ.
References
1. Barabasi AL, Oltvai ZN (2004) Network biology: understanding the cell’s functional organization. Nature Reviews Genetics 5: 101–113. doi:10.1038/nrg1272PMID:14735121
2. Zhou D, Huang J, Schölkopf B (2006) Learning with hypergraphs: Clustering, classification, and embedding. In: Advances in neural information processing systems. pp. 1601–1608.
3. Papa DA, Markov IL (2007) Hypergraph partitioning and clustering. Approximation algorithms and metaheuristics: 61–1.
4. Karypis G, Kumar V (1998). hmetis—hypergraph and circuit partitioning.http://glaros.dtc.umn.edu/ gkhome/metis/hmetis/overview. Accessed November 16, 2014.
5. Diserud OH,Ødegaard F (2007) A multiple-site similarity measure. Biology letters 3: 20–22. doi:10.
1098/rsbl.2006.0553PMID:17443955
6. Santini G, SoldanoH, PothierJ(2010) Use of ternary similarities in graph based clustering for protein structural family classification. In: Proceedings of the First ACM International Conference on Bioinfor-matics and Computational Biology. ACM, pp. 457–459.
7. Zhang L, Gao Y, Hong C, Feng Y, Zhu J, et al. (2013) Feature correlation hypergraph: Exploiting high-order potentials for multimodal recognition. IEEE Transactions on Cybernetics.
8. Mithani A, Preston GM, Hein J (2009) Rahnuma: hypergraph-based tool for metabolic pathway predic-tion and network comparison. Bioinformatics 25: 1831–1832. doi:10.1093/bioinformatics/btp269 PMID:19398450
9. Seref O, Brooks JP, Fong SS (2013) Decomposition of flux distributions into metabolic pathways. Computational Biology and Bioinformatics, IEEE/ACM Transactions on 10: 984–993. doi:10.1109/ TCBB.2013.115
10. Wang Z, Zhu XG, Chen Y, Li Y, Hou J, et al. (2006) Exploring photosynthesis evolution by comparative analysis of metabolic networks between chloroplasts and photosynthetic bacteria. BMC genomics 7: 100. doi:10.1186/1471-2164-7-100PMID:16646993
11. Kim SJ, Ha JW, Zhang BT (2013) Constructing higher-order mirna-mrna interaction networks in pros-tate cancer via hypergraph-based learning. BMC systems biology 7: 47. doi:10.1186/1752-0509-7-47 PMID:23782521
12. Kim SJ, Ha JW, Zhang BT (2014) Bayesian evolutionary hypergraph learning for predicting cancer clini-cal outcomes. Journal of biomediclini-cal informatics.
13. Gross JL, Yellen J (2003) Handbook of graph theory. CRC press.
14. Sørensen T (1948) {A method of establishing groups of equal amplitude in plant sociology based on
15. Wolda H (1981) Similarity indices, sample size and diversity. Oecologia 50: 296–302. doi:10.1007/ BF00344966
16. Bray JR, Curtis JT (1957) An ordination of the upland forest communities of southern wisconsin. Eco-logical monographs 27: 325–349. doi:10.2307/1942268
17. Enright A, Van Dongen S, Ouzounis C (2002) An efficient algorithm for large-scale detection of protein families. Nucleic acids research 30: 1575–1578. doi:10.1093/nar/30.7.1575PMID:11917018
18. Fisher RA (1935) The logic of inductive inference. Journal of the Royal Statistical Society: 39–82. doi: 10.2307/2342435
19. Altschul S, Gish W, Miller W, Myers E, Lipman D, et al. (1990) Basic local alignment search tool. Journal of molecular biology 215: 403–410. doi:10.1016/S0022-2836(05)80360-2PMID:2231712
20. Johnson M, Zaretskaya I, Raytselis Y, Merezhuk Y, McGinnis S, et al. (2008) Ncbi blast: a better web in-terface. Nucleic acids research 36: W5–W9.
21. Traag BA, Pugliese A, Eisen JA, Losick R (2013) Gene conservation among endospore-forming bacte-ria reveals additional sporulation genes in bacillus subtilis. Journal of bacteriology 195: 253–260. doi: 10.1128/JB.01778-12PMID:23123912
22. Stragier P, Losick R (1996) Molecular genetics of sporulation in bacillus subtilis. Annual review of ge-netics 30: 297–341. doi:10.1146/annurev.genet.30.1.297PMID:8982457
23. Fukushima T, Tanabe T, Yamamoto H, Hosoya S, Sato T, et al. (2004) Characterization of a polysac-charide deacetylase gene homologue (pdab) on sporulation of bacillus subtilis. Journal of biochemistry 136: 283–291. doi:10.1093/jb/mvh151PMID:15598884
24. Fukushima T, Yamamoto H, Atrih A, Foster SJ, Sekiguchi J (2002) A polysaccharide deacetylase gene (pdaa) is required for germination and for production of muramicδ-lactam residues in the spore cortex of bacillus subtilis. Journal of bacteriology 184: 6007–6015. doi:10.1128/JB.184.21.6007-6015.2002 PMID:12374835
25. Paredes CJ, Alsaker KV, Papoutsakis ET (2005) A comparative genomic view of clostridial sporulation and physiology. Nature Reviews Microbiology 3: 969–978. doi:10.1038/nrmicro1288PMID:16261177
26. Foster JT, Beckstrom-Sternberg SM, Pearson T, Beckstrom-Sternberg JS, Chain PS, et al. (2009) Whole-genome-based phylogeny and divergence of the genus brucella. Journal of bacteriology 191: 2864–2870. doi:10.1128/JB.01581-08PMID:19201792
27. Li L, Stoeckert C, Roos D (2003) Orthomcl: identification of ortholog groups for eukaryotic genomes. Genome research 13: 2178–2189. doi:10.1101/gr.1224503PMID:12952885
28. van Dongen S (2000) Graph clustering by flow simulation. Ph.D. thesis, University of Utrecht.
29. Shannon P, Markiel A, Ozier O, Baliga N, Wang J, et al. (2003) Cytoscape: a software environment for integrated models of biomolecular interaction networks. Genome research 13: 2498–2504. doi:10. 1101/gr.1239303PMID:14597658