Abstract—Eddy current (EC) nondestructive testing (NDT) based on probe impedance changes in the crack regions is considered in this paper. For this a numerical simulation is introduced for the development of the EC-NDT system using 3D finite element software. This model is used to simulate the rectangular cracks with various dimension and prepares the data required for artificial neural network. The neural network estimates dimension of new cracks using impedance changes of eddy current probe.
Index Terms—Nondestructive testing, eddy current, artificial neural network, finite element method
I. INTRODUCTION
NONDESTRUCTIVE testing (NDT) is a settled technique in several applications. It has become a routine tool in goods production [1]. Its general goal can be described as finding a defect in a specimen under test without destroying it in order to decide its acceptance or the necessity/possibility of repair. The physical phenomena used to this purpose are different [2]: ultrasounds, thermography, radiography, etc. The electromagnetic techniques (E-NDT) are less widespread in industry, but they are receiving growing attention by the international scientific community. Such techniques are particularly effective in several applications, including inspection of tubes for fluid transport or of part of airplanes. In these cases, it is possible to exploit all the benefits of these methodologies, such as velocity, cheapness, possible absence of contact with the inspected body, and the possibility of investigating inaccessible defects [2].
In the eddy-current method of nondestructive testing (NDT), current-carrying excitation loops of various shapes are commonly used for the induction of eddy currents in a conducting specimen [3]. The existence of flaws or the variations in physical properties of the specimen will perturb the eddy-current flow, and the resultant electromagnetic variations is monitored and analysed using appropriate
Manuscript received november 22, 2008
A.Babaei is M.sc student in Arak University Faculty of Engineering, (corresponding author to provide phone: 0988652230745; e-mail: [email protected]).
A.A.Suratgar is Assistant Professor, Faculty of Engineering, Arak University, (e-mail: [email protected]).
A.H.Salemi is Assistant Professor, Faculty of Engineering, Arak University (e-mail: [email protected]).
sensors [3].
The theoretical prediction of eddy-current probe output signals for various NDT applications usually involves solution of the electromagnetic field due to a current-carrying loop in the vicinity of a flawless conductor. A general solution of this problem can be sought through the use of various numerical techniques, including the finite element method [4], the boundary element method [5] and the volume integral method [6].
II. DATA ACQUISITION
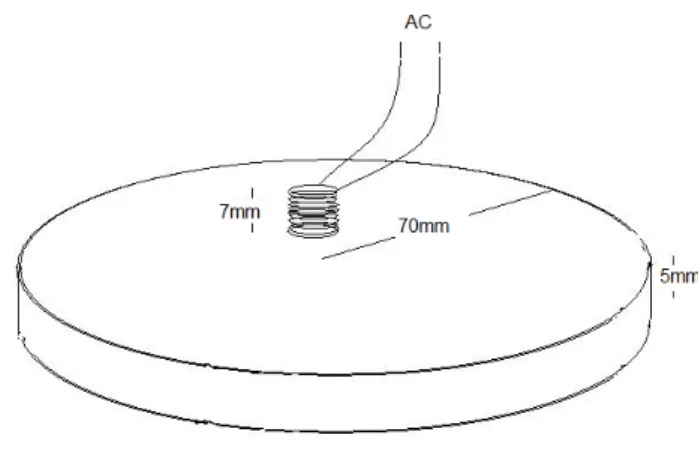
For train network, we need data sets with specific targets. The finite element method was used to obtain data. In this paper, the simulated specimen is a cylindrical conductive plate with these dimension: radius=70 mm, height=5 mm. The physical characteristics of plate are: relative magnetic permeability (
μ
r=500), electric conductivity (σ =l.0×107 S/m).The coil specification is as follow: interior radius of coil is 6mm, exterior radius is 7mm, and height of coil is 7mm. (Fig. 1)
Fig. 1: Used plate schematic
Dimension Estimation of Rectangular Cracks
Using Impedance Changes of Eddy Current
Probe with Neural Network
Abolghasem babaei, Amir Abolfazl suratgar, Amir Hosein Salemi
Proceedings of the International MultiConference of Engineers and Computer Scientists 2009 Vol I IMECS 2009, March 18 - 20, 2009, Hong Kong
The exciting coil has 700 turns, and current density of coil is 1×10⁸ A/m2 and relative permeability of an amorphous core which is used in coils is 2000. The exciting frequency is 10 Hz.
In this study, a rectangular crack backside of the plate was created in each simulation. For each data the dimension of crack was changed in each specimen; as the minimum dimension of cracks is (1 mm, 0.05 mm, 0.5 mm), and the maximum of those is (20 mm, 0.5 mm, 3 mm). 63 specimens were examined.
The creation of the data sets required the determination of the impedance changes of the coil. This parameter was evaluated by subtracting the impedance obtained for the plate without crack from the impedances obtained for the plate with crack. For each crack the coil moves parallel to the x-axis at a 1mm of distance from surface of plate, placed along the crack length direction and scan the crack in 45 different points.(For each data we carried out simulation in 45 times: starting from x = -12 mm till x = 32 mm at every 1 mm along the crack direction).
In each stage the voltage and current of coil were resulted from simulation, and the impedance and impedance changes of coil finally were calculated from them. In this study, imaginary part of impedance changes were used for train network. Fig. 2 demonstrates magnetic flux density of coil in plate. One can see that the magnetic flux density has reduced environs of crack.
Fig. 2: Flux density in plate and around the crack in a specific crack
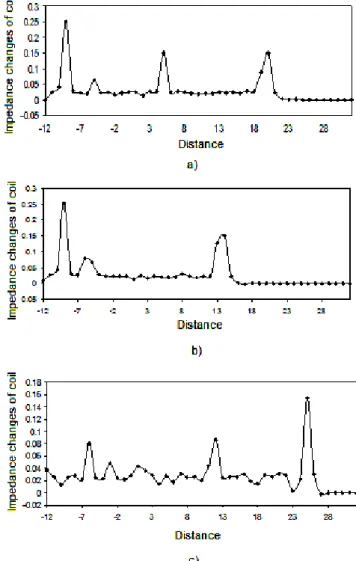
As you see, fig. 3 demonstrates some of the imaginary part of impedance changes used for train neural network.
Fig. 3: Some of imaginary part of coil impedance changes resulted from: a) Crack with (10, 0.4, 1) mm dimension, b) Crack with (4, 0.5, 1) mm
dimension, c) Crack with (13, 0.4, 3) mm dimension
III. Simulation Results
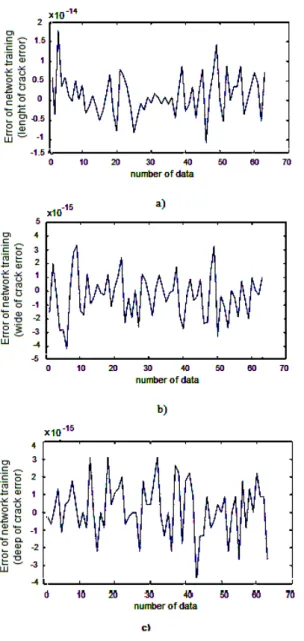
The used network in this work was feed forward Backpropagation (Fig. 4). By training this network, error of network was obtained about (10-15), you can see curve of error’s network in fig. 5.
Here, some data that there aren’t in training data sets, are used for Simulating and testing the network. For example fig. 6 shows some of these specimens that were used for testing network. As you see the target data and outputs of network are shown in table. 1. comparing outputs of network and targets, the results of neural network were acceptable.
Fig. 4: Used neural network
Proceedings of the International MultiConference of Engineers and Computer Scientists 2009 Vol I IMECS 2009, March 18 - 20, 2009, Hong Kong
Fig. 5: Error of network: a) Error of crack length vector b) Error of crack wide vector c) Error of crack deep vector
Input data Fig. 6. a Fig. 6. b Out put of network (1.01, 0.109, 2.01) (8.13, 0.387, 0.978)
Target data (1, 0.1, 2) (8, 0.4, 1)
Table. 1: Result of network for two between data
Fig. 6: Two test data: a) Crack with (1, 0.1, 2) mm dimension b) Crack with (8, 0.4, 1) mm dimension
REFERENCES
[1] “IEE colloquium on new applications in modeling and inversion techniques for nondestructive testing” in IEE Colloq., 1999, pp. 0–38 [2] Andrea Bernieri, Giovanni Betta, Senior Member, IEEE, Luigi
Ferrigno, and Marco Laracca,”A Biaxial Probe for Nondestructive Testing on Conductive Materials”.IEEE TRANSACTIONS ON INSTRUMENTATION AND MEASUREMENT, VOL. 53, NO. 3, JUNE 2004
[3] S.H.H.Sadeghi and A.H.Salemi,”Electromagnetic field distributions around conducting slabs, produced by eddy-current probes with arbitrary shape current-carrying excitation loops” IEE Proc.-Sci. Mrm. Technol., Vol. 148, No. 4, July 2001
[4] IDA, N., PALANISAMY, R., and LORD, W,”Eddy current probe design using finite element analysis”. Muter. Evul., 1983, 41, (12), pp. 1389-1394
[5] MURPHY, R.K., SABBAGH, H.A., TREECE, J.C., and WOO, L.W,”A volume-integral code for electromagnetic nondestructive
Evaluation”, Proceedings of 1 1 th annual review of progress in applied computational electromagnetics, March 1995, pp. 109-1 16
[6] CHAO, J., NAKAGAWA, N., RAULERSON, D., and MOULDER, J.A general boundary integral equation approach to eddy current crack modelling. Proceedings of 23rd symposium on Quantitative nondestructive evaluation, Brunswick, USA, July 1996,pp. 279-285
Proceedings of the International MultiConference of Engineers and Computer Scientists 2009 Vol I IMECS 2009, March 18 - 20, 2009, Hong Kong