Formation of secondary organic aerosol in the Paris pollution plume
and its impact on surrounding regions
Q. J. Zhang1,a, M. Beekmann1, E. Freney2, K. Sellegri2, J. M. Pichon2, A. Schwarzenboeck2, A. Colomb2, T. Bourrianne3, V. Michoud1,b, and A. Borbon1
1Laboratoire Interuniversitaire des Systèmes Atmosphériques (LISA/IPSL), UMR CNRS 7583, Université Paris Est Créteil
(UPEC) and Université Paris Diderot (UPD), Paris, France
2Laboratoire de Météorologie Physique, Clermont-Ferrand, France
3Centre National de Recherches Météorologiques, Météo-France, Toulouse, URA1357, France anow at: Aria Technologies, Boulogne-Billancourt, France
bnow at: Mines Douai, SAGE, 59508 Douai, France
Correspondence to:Q. J. Zhang (qzhang@aria.fr)
Received: 19 January 2015 – Published in Atmos. Chem. Phys. Discuss.: 17 March 2015 Revised: 6 September 2015 – Accepted: 16 November 2015 – Published: 18 December 2015
Abstract.Secondary pollutants such as ozone, secondary in-organic aerosol, and secondary in-organic aerosol formed in the plumes of megacities can affect regional air quality. In the framework of the FP7/EU MEGAPOLI (Megacities: Emis-sions, urban, regional and Global Atmospheric POLlution and climate effects, and Integrated tools for assessment and mitigation) project, an intensive campaign was launched in the greater Paris region in July 2009. The major objective was to quantify different sources of organic aerosol (OA) within a megacity and in its plume. In this study, we use air-borne measurements aboard the French ATR-42 aircraft to evaluate the regional chemistry-transport model CHIMERE within and downwind of the Paris region. Two mechanisms of secondary OA (SOA) formation are used, both including SOA formation from oxidation and chemical aging of pri-mary semivolatile and intermediate volatility organic com-pounds (SI-SOA) in the volatility basis set (VBS) frame-work. As for SOA formed from traditional VOC (volatile or-ganic compound) precursors (traditional SOA), one applies chemical aging in the VBS framework adopting different SOA yields for high- and low-NOxenvironments, while
an-other applies a single-step oxidation scheme without chemi-cal aging. Two emission inventories are used for discussion of emission uncertainties. The slopes of the airborne OA lev-els versus Ox(i.e., O3+NO2) show SOA formation
normal-ized with respect to photochemical activity and are used for specific evaluation of the OA scheme in the model. The
simu-lated slopes were overestimated slightly by factors of 1.1, 1.7 and 1.3 with respect to those observed for the three airborne measurements, when the most realistic “high-NOx” yields
for traditional SOA formation in the VBS scheme are used in the model. In addition, these slopes are relatively stable from one day to another, which suggests that they are character-istic for the given megacity plume environment. The config-uration with increased primary organic aerosol (POA) emis-sions and with a single-step oxidation scheme of traditional SOA also agrees with the OA / Oxslopes (about±50 % with
respect to the observed ones); however, it underestimates the background. Both configurations are coherent with observed OA plume buildup, but they show very different SI-SOA and traditional anthropogenic SOA (ASOA) contributions. It is hence concluded that available theoretical knowledge and available data in this study are not sufficient to discern the rel-ative contributions of different types of anthropogenic SOA in the Paris pollution plume, while its sum is correctly simu-lated. Based on these simulations, for specific plumes, the an-thropogenic OA buildup can reach between 8 and 10 µg m−3.
Figure 1.Ratios of OOA vs. Oxfrom studies in Mexico City,
Hous-ton, Los Angeles, Tokyo and Paris. Ratios for HousHous-ton, Los Ange-les and Tokyo are derived from ground-based measurements during typically 1 month and located in the metropolitan area. For Hous-ton, the ratio derived during influences from a combination of urban and petrochemical emissions, typically 0.03 µg m−3ppb−1(Wood et al., 2010), is presented. Ratios for Paris and Mexico City are de-rived from three and two individual flights, respectively, performed at about 100–150 km downwind from the agglomeration.
is an important contributor to regional OA levels (inside and outside the Paris plume).
1 Introduction
The number of large agglomerations (“megacities”) is in-creasing due to population clustering in urban regions (UN, 2014). Human activities in the megacities cause important negative effects on air quality (Gurjar et al., 2010). Pollu-tants like ozone and fine particulate matter (PM2.5) have
re-cently been the focus of several studies as a result of concerns for human health, impacts on ecosystem (Seinfeld and Pan-dis, 2006) and climate (IPCC, 2013). Due to their lifetime (several days to weeks), PM2.5 and ozone have impacts at
both the local and regional level. Therefore, adequate emis-sion control strategies for air quality management need to take into account impacts on different scales.
Photochemical ozone formation is related to precursor molecules: nitrogen oxides (NOx), and volatile organic
com-pound (VOC) species, emitted mainly from human activities – such as traffic, industrial production and solvent use – as well as from biogenic emissions. In large European agglom-erations, a VOC-limited chemical regime is in general real-ized (Beekmann and Vautard, 2010), where ozone produc-tion is directly related to that of VOC precursors. Secondary aerosol formation is induced by formation of condensable or semivolatile species from precursors like NOx, SO2, NH3
and VOCs (Seinfeld and Pandis, 2006). Due to the large num-ber of chemical reactions occurring in different phases, sec-ondary organic aerosol (SOA) formation pathways are still uncertain (e.g., Hallquist et al., 2009), its formation is still
difficult to estimate quantitatively (e.g., Hodzic et al., 2010; Zhang et al., 2013), and the contribution of anthropogenic versus biogenic sources are still under debate (e.g., Hallquist et al., 2009; Beekmann et al., 2015). Also, the relative contri-bution of SOA from traditional anthropogenic VOC precur-sors (ASOA) and from semivolatile (SVOC) or intermediate volatility (IVOC) organic compounds (SI-SOA) is still under debate and difficult to constrain from field data (as for ex-ample discussed in Hayes et al., 2015, for the case of Los Angeles).
Field data provide strong constraints on SOA-related pro-cesses. In particular, the relation between SOA and Ox(O3+
NO2) has been used to express SOA formation as a function
of photochemical products formation (Herndon et al., 2008; Wood et al., 2010; Hayes et al., 2013; Morino et al., 2014). Indeed, in a “VOC-limited regime” in an urban area, such as Paris, VOC oxidation by OH, ozone or NO3is the rate
limit-ing step for both SOA and ozone or Oxproduction.
VOC+OH→. . .→. . .→αOx+βSOA+. . . (1)
The ratio or slope of SOA vs. Ox, given by the term β/α
represents the ratio of the photochemical production of SOA to the photochemical production of Ox, both from VOC
ox-idation, that is, the SOA yield normalized by current pho-tochemical conditions characterized by the availability of VOC precursors and oxidant agents. It is expected to vary for different VOC species, in particular as a function of their SOA yields, which are for instance large for aromat-ics and terpenes while low for alkanes and alkenes (Wood et al., 2010). This is reflected in larger SOA vs. Ox slopes
observed in Mexico City (typically 0.16 µg m−3ppb−1),
Los Angeles (0.15 µg m−3ppb−1; Hayes et al., 2013) and
Tokyo (0.19 µg m−3ppb−1; Morino et al., 2014), where
aromatic emissions are large, than in Houston (typically 0.03 µg m−3ppb−1) where petrochemical alkene emissions are large (Wood et al., 2010) (Fig. 1).
The main objective of the MEGAPOLI (Megacities: Emis-sions, urban, regional and Global Atmospheric POLlution and climate effects, and Integrated tools for assessment and mitigation) Paris campaign in summer 2009 was to deter-mine organic aerosol sources in a post-industrial megacity and in its plume. In this work, we apply the regional chem-istry transport model (CTM) CHIMERE (Menut et al., 2013) in order to evaluate the model performance against airborne measurements especially for organic aerosol and to assess the impact of Paris agglomeration emissions on OA (organic aerosol) formation in surrounding regions.
For megacities, sources of organic aerosol are still under debate and need to be quantified (e.g., Molina et al., 2010). While in Beekmann et al. (2015), the local versus advected and the fossil versus non-fossil nature of OA sources within the agglomeration is analyzed, here we focus on additional OA buildup in the agglomeration plume and on its impact on aerosol concentrations in the surrounding of Paris. In the framework of the MEGAPOLI project, airborne measure-ments were performed with the French ATR-42 aircraft oper-ated by SAFIRE (a CNRS-MétéoFrance–CNES-headed unit) in order to document the evolution of pollutants within the Paris agglomeration pollution plume during the MEGAPOLI summer campaign (Freney et al., 2014). The advantage of the airborne measurements over the ground-based ones is that they allow following the evolution of the city plume over time and space up to 200 km downwind of the emissions. Data from these flights will be used to extend the model eval-uation performed in Zhang et al. (2013) for urban and subur-ban sites in the Paris agglomeration to plume conditions. The focus is to monitor the buildup of secondary organic aerosol within the plume in relation with tracers of primary emis-sions and photochemical activity. Among the various formu-lations that have been derived in the framework of the VBS scheme (for example, Lane et al., 2008a; Murphy and Pan-dis, 2009; Dzepina et al., 2011; Shrivastava et al., 2013; Zhao et al., 2015, etc.), specifically two are chosen for this paper (as already for Zhang et al., 2013) because they either fa-vor large ASOA or large SI-SOA buildup in the plume. In this way, we intend to address uncertainty linked to the co-existence of different VBS schemes in the formation of dif-ferent SOA types within the plume. Another important aspect of this paper is to analyze the OA/Oxratio, specifically used
for model evaluation, as it normalizes SOA formation with respect to photochemical reactivity and precursor load.
The paper is organized as follows. In Sect. 2, the air-borne measurements during the MEGAPOLI summer cam-paign are described. The model configurations and simula-tion setups for the VBS approach to model POA and SOA are introduced in Sect. 3. The evaluation of model performance for plume simulations is presented in Sect. 4, and the impact on regional air quality is described in Sect. 5. From compar-ison of different setups of the VBS scheme, uncertainties in the formation of different SOA types in the Paris plume are discussed.
sen ranging from 50 to 100 km in order to sample both the plume and rural background conditions at the lateral plume edges. Taking into account the aircraft autonomy of about 3.5 h, this allowed flying four legs across the plume. The maximal distance for a flight was about 200 km from the Paris agglomeration center. The flight level was chosen to lie well inside of the well-developed afternoon convective boundary layer, at about 500–700 m above ground. In ad-dition to measurements inside and outside the Paris plume, each flight included a complete circle around the agglomera-tion, performed after takeoff and before landing at the Cergy– Pontoise airport. In this work, we focus only on measure-ments downwind of Paris to study the pollution production from Paris emissions. The measurements started in the early afternoon in order to sample photochemically processed air. Because of a limited number of flight hours, and in line with the principal objective of documenting the photochemical production of pollutants, flights were performed on days with light wind (<3 m s−1) and cloud-free weather conditions. For this study, three flights were chosen on the 16, 21 and 29 July, all of which encountered well-pronounced plumes of primary and secondary pollutants. Meteorological condi-tions for these days were characterized by southerly winds, low wind speed over the agglomeration, elevated temperature and cloudless skies. These conditions favor the accumulation of primary pollutants and photochemical processes leading to the formation of secondary pollutants like O3and SOA.
An extensive set of gas-phase pollutants, aerosol species and properties were measured on each flight (Freney et al., 2014). For this work, for each flight a complete measure-ment set of primary pollutants, BC and NOx(NO and NO2),
and secondary pollutants, O3 and OA, is available and
ana-lyzed. Measurement frequencies of all instruments, including the aerosol chemical composition, are rapid enough (<40 s) to have a relatively good spatial resolution. All measure-ments during the flights are corrected to temperature (22◦C) and pressure (950 hPa) of the plane (Freney et al., 2014). Thus, compared to other values given in this paper and taken at standard conditions, our values are about 5 % lower. Ta-ble 1 summarizes the deployed instruments and the measured concentration levels for these pollutants during these flights. Only measurements at a stable flight altitude are used for this study.
The 30th percentile concentration of a pollutant on the flight legs downwind of Paris is close to the median concen-tration outside the Paris plume and represents its background level. For NOxand BC, the 30th percentile concentrations are
Figure 2.Comparison of measured(a1, a2, a3)and modeled BC from VBS-LA(b1, b2, b3)and VBS-LNOX(c1, c2, c3)during the flights on 16, 21 and 29 July, respectively.
Table 1.Airborne chemical instruments deployed, the measurements including the maximum and 30th percentile (P30) of pollutant con-centrations by these instruments are used to discuss general findings during the campaign (Freney et al., 2014) and evaluate the model simulations.
Pollutant Instrument Time resolution Unit Statistics Concentration
16 Jul 21 Jul 29 Jul
NOx MONAa 30 s ppb Max. 13.5 7.98 12.2
P30 1.11 1.03 1.14 O3 UV analyzerb 30 s ppb Max. 62.0 79.0 62.4
P30 49.0 58.0 50.0 BC PSAPc 1 s µg m−3 Max. 2.00 2.01 2.30 P30 0.33 0.49 0.38 OA C-ToF-AMSd 30 s µg m−3 Max. 5.97 12.3 7.36 P30 3.87 6.47 4.13
aMeasurement of nitrogen on aircraft developed by the Laboratoire Interuniversitaire des Systems Atmosphériques (LISA). NO, NO2and NOyare measured (Freney et al., 2014, Supplement).
bThermal-environmental instruments O
3UV analyzer. cRadiance research®particulate soot absorption photometer. dAerodyne compact time-of-flight aerosol mass spectrometer.
16, 21 and 29 July, respectively (Table 1). The rather homo-geneous background pollutant levels (Figs. 2, 3) correspond to the absence of major urban pollution sources in the south of the Paris agglomeration (rural “center” region). The Paris pollution plumes are always clearly identifiable as sharp con-centration increases, with continuity on all flight legs at
dif-ferent distances from the agglomeration (Figs. 2, 3). The plume half-widths are about several tens of kilometers. Max-imum plume concentrations of NOx and BC are 13.5, 7.98
Figure 3.Comparison of measured(a1, a2, a3)and modeled NOxfrom VBS-LA(b1, b2, b3)and VBS-LNOX(c1, c2, c3)during the flights
on 16, 21 and 29 July, respectively.
The maximum plume ozone concentrations are 62.0, 79.0 and 62.4 ppb during these flights, respectively, compared to the 30th percentile (i.e., background) concentrations of 49.0, 58.0 and 50.0 ppb (Table 1). The largest O3values are
ob-served at the flight leg most distant from the agglomeration, allowing for the longest photochemical processing (Fig. 4). For the 16 July, the transects across the plume show a dou-ble maximum and a relative central minimum due to ozone titration by NO.
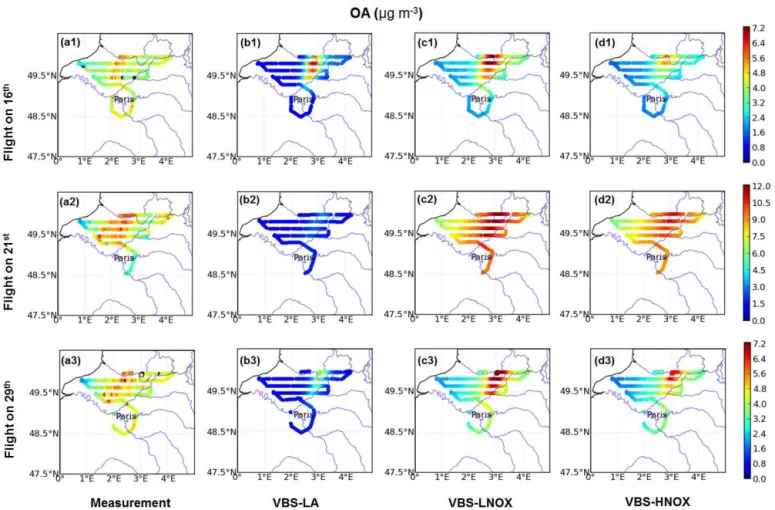
The background concentrations of OA are 3.87, 6.47 and 4.13 µg m−3, respectively, during these three flights (Table 1, Fig. 5). Maximum plume OA concentrations are 5.97, 12.33 and 7.36 µg m−3, respectively. Thus, additional OA buildup
within the plume is about 2–6 µg m−3 (see also below in
Sect. 4.2). Maximum concentrations appear in the three outer flight legs. OA plumes are wider and less homogeneous than primary pollutant ones, which could be due to a secondary organic aerosol production from additional biogenic sources in addition to formation from emissions in the Paris agglom-eration.
OA versus Ox(Ox=O3+NO2) plots from measurements
on these flights are used to study the ratio of the photo-chemical productivity of OA and Ox buildup in the plume
from Paris emissions, following an approach first proposed by Herndon et al. (2008). In this study, OA is used
in-stead of SOA, because it is directly measured. Among OA factors derived from positive matrix factorization (PMF) of AMS (aerosol mass spectrometer) measurements, LV-OOA (low-volatility-oxygenated OA) and SV-OOA (semivolatile-oxygenated OA) are commonly attributed to SOA (Hallquist et al., 2009). These LV-OOA and SV-OOA factors con-tributed on average about 65 % of resolved OA factors and 37 % of the total OA during these three MEGAPOLI flights. HOA (hydrocarbon-like OA) makes up for the remaining 35 % of resolved OA factors and 20 % of the total OA. While the HOA factor is generally attributed to POA, it might partly also correspond to oxidized POA, considered as SOA (Au-mont et al., 2012; Cappa and Wilson, 2012), and to cooking-related OA (Freutel et al., 2013). Using total OA avoids these problems arising from the interpretation of PMF-derived fac-tors.
The Pearson R correlation between OA and Ox on the
three flights on 16, 21 and 29 July is around 0.70 (Ta-ble 4, Fig. 6). It indicates a similar ratio of photochemical production of ozone and OA from VOC precursors, though as expected the match between OA and Ox is not perfect,
due to differences in SOA and Ox yields for different VOC
precursors. The OA / Ox slopes for these flights are 0.14–
Figure 4.Comparison of measured(a1, a2, a3)and modeled O3from VBS-LA(b1, b2, b3)and VBS-LNOX(c1, c2, c3)during the flights
on 16, 21 and 29 July, respectively.
(0.14–0.15 µg m−3ppb−1, Wood et al., 2010). It is also close to ground-based studies of downwind urban emissions from ground-based measurements in Mexico City (median OOA vs. Ox slope of 0.16 µg m−3ppb−1; Wood et al., 2010), in
Los Angeles (0.15 µg m−3ppb−1; Hayes et al., 2013) and in Tokyo (0.19 µg m−3ppb−1; Morino et al., 2014).
3 Simulations
3.1 Model configuration
In this work, we used the CHIMERE v2008b model (see http: //www.lmd.polytechnique.fr/chimere/) (Vautard al., 2001; Bessagnet et al., 2009; Menut et al., 2013), widely used for operational regional air quality forecasts (Honoré et al., 2008; Zhang et al., 2012) and simulations in Europe (e.g., Beekmann and Vautard, 2010; Sciare et al., 2010). With a few exceptions (noted below), the same model configura-tion as in Zhang et al. (2013) was set up. Two nested domains are applied: a continental domain covering Europe with a res-olution of 0.5◦(35–57.5◦N, 10.5◦W–22.5◦E) and a regional domain over northern France covering all the flight patterns during this campaign with a resolution of 3 km (called MEG3 domain). Eight hybrid-sigma vertical layers are used, with the first layer extending from the ground to about 40 m, and
a model top at 500 hPa. Tropospheric photochemistry is rep-resented using the reduced MELCHIOR chemical mecha-nism (Lattuati, 1997; Derognat et al., 2003), including 120 reactions and 44 prognostic gaseous species. For the simula-tion of the particulate phase, eight bins of particulate sizes are used in the model with diameters ranging from 0.04 to 10 µm. The thermodynamic equilibrium of the inorganic species (sulfate, nitrate, and ammonium) between the gas and particle phase is interpolated from a tabulation calculated with the ISORROPIA model (Nenes et al., 1998). The evapo-ration and condensation processes related to departures from the thermodynamic equilibrium are kinetically controlled.
Two SOA formation mechanisms are used and are de-scribed in more detail in Sect. 3.2. For SI-SOA (SOA from oxidation of primary semivolatile and intermediate volatile VOCs, previously referred to as OPOA in Zhang et al., 2013) formation, both mechanisms use the VBS formulation as described in Robinson et al. (2007). For traditional anthro-pogenic and biogenic SOA (ASOA and BSOA) formation from VOC precursors, one uses the classical single-step oxi-dation scheme (Pun et al., 2006; Bessagnet et al., 2009) and the other one a volatility basis set (VBS) scheme with differ-ences in high-NOxand low-NOxparametrizations. The VBS
Figure 5.Comparison of measured(a1, a2, a3)and modeled OA from VBS-LA(b1, b2, b3), VBS-LNOX(c1, c2, c3)and VBS-HNOX(d1, d2, d3)during the flights on 16, 21 and 29 July, respectively.
gas-phase aging is also included with the same rate con-stant as for ASOA (1×10⁻¹¹mol cm3s−1). Gas-phase
chem-ical aging of BSOA is supported by laboratory (see in Zhao et al., 2015) and box model experiments with the very de-tailed GECKO-A mechanism (Generator of Explicit Chem-istry and Kinetics of Organics in the Atmosphere; Valorso et al., 2011). In Zhang et al. (2013), it had been shown that in-cluding BSOA aging was necessary to reproduce several OA peaks occurring during the summer campaign at Paris urban sites in the model.
For the large domain, anthropogenic gas-phase emis-sions are calculated from EMEP (European Monitoring and Evaluation Programme)annual totals (http://www.ceip. at/emission-data-webdab/), while black carbon (BC) and pri-mary organic aerosol (POA) are prescribed from an emis-sions inventory prepared by Laboratoire d’Aérologie (LA) (Junker and Liousse, 2008). In the different simulation set-up’s in Sect. 3.2, emissions for the inner domain MEG3 over northern France are either taken from the same EMEP-LA in-ventory or from an alternative inin-ventory specifically designed for the MEGAPOLI project, the Airparif-TNO-MEGAPOLI inventory, in which the refined Paris emissions from Airparif
with a resolution of 1 km are integrated into the European-wide TNO inventory (Timmermans et al., 2013). In this lat-ter inventory, BC and POA emissions for the Paris agglom-eration are about 2 and 3 times lower than in the EMEP-LA inventory, respectively, and VOC emissions are about a third lower, while NOx emissions are similar. These
Figure 6.OA vs. Ox(a1, a2, a3), SI-SOA vs. Ox(b1, b2, b3), ASOA vs. Ox(c1, c2, c3)and BSOA(d1, d2, d3)vs. Oxduring the flights
on 16, 21 and 29 July, respectively. For OA vs. Ox(a1, a2, a3), results from the measurement, VBS-LA, VBS-LNOX and VBS-HNOX are
presented. For others, only results from VBS-LA and VBS-HNOX are presented.
in more detail in Zhang et al. (2013), POA / SVOC emission factors for the main source in summer, traffic, are obtained from laboratory measurements under low level of dilution (with OA loading of 1000 µg m−3). Under these conditions, the POA / SVOC emissions are emitted mostly in the par-ticle phase. A volatility distribution following Robinson et al. (2007) was affected to these emissions. Additional IVOC emissions (factor 1.5 of POA / SVOC) were also considered according to Robinson et al. (2007).
Biogenic emissions are calculated using the MEGAN (Model of Emissions of Gases and Aerosols from Na-ture) model data and parametrizations (Guenther et al., 2006). Meteorological fields are simulated with the MM5 mesoscale model (PSU/NCAR mesoscale model; Dudhia, 1993). Boundary conditions are taken from a monthly cli-matology of the LMDz-INCA2 and LMDz-AERO general circulation models (Hauglustaine et al., 2004).
3.2 Simulation configurations
Here, a brief summary on the three distinct simulation config-urations used in this study is given. They are intended to take into account both uncertainties in SOA formation schemes and in POA / SI-VOC emissions.
– The VBS-LNOX (low-NOx) simulation, in which all
SI-SOA, ASOA and BSOA are affected by chemical aging with the VBS approach. High SOA yields under low-NOx conditions (Murphy and Pandis, 2009; Lane
et al., 2008a) are used for both simulation domains (the same as the so-called VBS-MPOLI simulation in Zhang et al., 2013; see Table 2), assuming that most of the OA is advected to the Paris agglomeration from outside (Pe-tetin et al., 2014) and probably formed under low-NOx
conditions. Usually, a limiting VOC/NOxratio of 3 and
10 ppb C ppb−1is used to discern a high- and a low-NOx
ALK5 0 0.3 0 0 0 0.15 0 0 OLE1c 0.0045 0.009 0.06 0.225 0.0008 0.0045 0.0375 0.15 OLE2d 0.0225 0.0435 0.129 0.375 0.003 0.0255 0.0825 0.27 ARO1e 0.075 0.225 0.375 0.525 0.003 0.165 0.3 0.435 ARO2f 0.075 0.3 0.375 0.525 0.0015 0.195 0.3 0.435 TERPg 0.1073 0.0918 0.3587 0.6075 0.012 0.1215 0.201 0.507 ISOPh 0.009 0.03 0.015 0 0.0003 0.0225 0.015 0
an-Pentane,n-hexane, branched C5–C6 alkanes, cyclopentane, trimethyl butane, trimethyl pentane, isopropyl alcohol,
n-propyl alcohol.
bC7–C22n-alkanes, C6–C16 cycloalkanes, branched/unspeciated C8–C18 alkanes. cPropene, C4–C15 terminal alkanes.
dIsobutene, C4–C15 internal alkenes, C6–C15 cyclic or diolefins, styrenes. eToluene, benzene, ethylbenzene, C9–C13 monosubstituted benzenes.
fXylenes, ethyl toluenes, dimethyl and trimethyl benzenes, ethylbezenes, naphthalene, C8–C13 di-, tri-, tetra-, penta-, and hexasubstituted benzenes, unspeciated C10–C12 aromatics.
gα-Pinene and sabinene,β-pinene andδ3-carene, limonene, ocimene and myrcene. hIsoprene.
a low-NOx regime, it is close to or below the ratio of
3 ppb C ppb−1on the north of Paris in the plume region (Fig. S1 in the Supplement). This low-NOx
configura-tion is thus expected to overestimate ASOA formaconfigura-tion in the Paris pollution plume under high-NOxconditions
around Paris. The emission inventory for the MEG3 do-main is the specific MEGAPOLI inventory.
– The VBS-HNOX (high-NOx) simulation, in which
lower SOA yields under high-NOxconditions (Murphy
and Pandis, 2009; Lane et al., 2008a) are used for the in-ner MEG3 domain (see Table 2). This is more realistic for SOA formation in its plume close to the Paris ag-glomeration than in low-NOxconditions. The low-NOx
condition is still applied on the continental domain for background OA simulation. All other model settings are equal to the VBS-LNOX configuration. Although us-ing high-NOx conditions with lower yields, which are
more realistic for the plumes from Paris emissions, this configuration might still overestimate ASOA formation in the plume following the new ASOA yields fitted to laboratory experiments in SOA formation schemes de-scribed in Zhao et al. (2015).
– The VBS-LA simulation (same as VBS-T1 simulation in Zhang et al., 2013), in which a single-step oxida-tion scheme (Pun et al., 2006) is used for tradioxida-tional ASOA and BSOA formation, as is VBS scheme for SI-SOA formation and for the other two configurations. The EMEP-LA emission inventory with 3 times larger POA / SI-VOC emissions is used for the inner MEG3 domain. The fact that POA / SI-VOC emissions are 3 times larger and the absence of chemical aging for
ASOA will favor SI-SOA with respect to ASOA for-mation.
4 Model evaluation with airborne measurements In this section, modeling results of NOx, BC, Ox, and OA
are presented and compared to the airborne measurements at the same location and time. Outputs from simulations are in-terpolated to the exact flight location and time. NOxand BC
are compared as primary urban tracers to indicate the loca-tion of the Paris plume in observaloca-tions and in simulaloca-tions. Only the VBS-LNOX simulations are used for BC, NOxand
Ox, because a change of the SOA yields does not affect the
simulation of the concentrations of these species between the VBS-LNOX and VBS-HNOX simulations. The evalua-tion with the VBS-LA simulaevalua-tions gives an insight on effects of emission uncertainties. Individual species comparisons are presented in Sect. 4.1 while model observation comparisons of the OA/Oxratio are presented in Sect. 4.2. For each of the
four to five transects through the pollution plume of a flight, the simulated and observed maximum concentrations are de-picted and averaged over all transects of a flight. The same procedure is applied for the 30th percentiles (P30) over each transect, considered as representative for background condi-tions outside of the plume.
4.1 Individual species model to observation comparisons
Table 3.Model statistics for maximum and 30th percentile (P30) of pollutant concentrations from VBS-LNOX (and VBS-HNOX for OA as well) and VBS-LA.
Pollutant Unit Statistics VBS-LNOX VBS-LA
16 Jul 21 Jul 29 Jul 16 Jul 21 Jul 29 Jul
NOx ppb Max. 9.18 2.82 4.92 6.16 2.25 3.54
P30 0.47 0.61 0.55 0.62 0.67 0.63 BC µg m−3 Max. 1.3 0.52 0.69 2.41 0.77 1.08 P30 0.16 0.18 0.16 0.11 0.15 0.11 O3 ppb Max. 69.5 83.3 70.7 74.9 83.3 72.2
P30 53.3 69.3 53.0 53.6 69.7 53.3 Ox ppb Max. 72.1 84.2 72.2 76.7 84.2 73.4
P30 53.7 69.8 53.4 54.1 70.3 53.8 OA µg m−3 Max. 7.66 12.74 8.87 6.97 3.13 4.14 P30 2.28 8.77 3.09 0.81 1.55 0.91 OA∗ µg m−3 Max. 5.48 11.31 6.88
P30 1.95 8.35 2.85
OA∗: OA from VBS-HNOX simulations.
16 July (Fig. 2). This will have little influence on the study of the OA impact from Paris on its surroundings due to the rather circular structure of the agglomeration (Shaiganfar et al., 2015). In both the modeled fields and observations, the largest concentrations appear close to the Paris agglomera-tion during these three flights.
The modeled maximum BC concentrations from VBS-LNOX are underestimated by−0.7 (−35 %),−1.5 (−74 %)
and−1.6 µg m−3(−70 %) with respect to the measurement,
respectively, for 16, 21, and 29 July, while they are overes-timated by 0.4 (21 %) and underesoveres-timated by−1.2 (−62 %)
and−1.2 µg m−3 (−53 %) from VBS-LA, respectively
(Ta-bles 3, S1; Fig. 2). Thus, for the last two flights, the BC un-derestimation appears for both emission inventories. An av-erage underestimation of plume BC measurements by−20 % (over 10 flights during July 2009) was already noticed by Petetin et al. (2015), which could be attributed to errors in emission inventories, uncertainty in measurements and in the choice of the mass specific absorption coefficient (Petetin et al., 2015). Our study focusses on 3 days with particularly low wind speeds with variable wind direction during morning hours in the Paris agglomeration, allowing for primary pol-lution buildup and subsequent secondary polpol-lution buildup in the plume. As shown in Petetin et al. (2015), it turns out that the meteorological model (MM5, but similar results are obtained for WRF) forcing the CTM simulations is not capa-ble of simulating these wind direction variations for two of the 3 flight days, on 21 and 29 July, thus underestimating the pollution accumulation in the Paris region and subsequently in the plume. The modeled 30th percentile BC concentra-tions taken as representative for background concentraconcentra-tions are also underestimated by−0.17 (−51 %),−0.31 (−62 %) and−0.22 µg m−3(−59 %) from VBS-LNOX and by−0.22
(67 %), −0.34 (−69 %) and −0.27 µg m−3 (−71 %) from
VBS-LA, respectively, during these flights (Tables 3, S1; Fig. 2).
Similar to BC, VBS-LNOX underestimates NOx
con-centrations by−4.3 (−32 %),−5.2 (−65 %) and−7.3 ppb
(−60 %) for the maximum concentrations and by −0.64
(−58 %), −0.42 (−41 %) and −0.59 ppb (−52 %) for the
background concentrations with respect to the measurements (Tables 3, S1; Fig. 3). VBS-LA shows slightly more underes-timation by−7.3 (−54 %),−5.3 (−72 %) and−8.7 (−71 %)
ppb for the maximum concentrations and slightly less un-derestimated for the background concentrations by −0.57
(−51 %),−0.36 (−35 %) and−0.51 (56 %) ppb (Tables 3,
S1). Also similar to BC, the modeled NOx maximum
con-centrations for both simulations are located close to the Paris agglomeration (Figs. 2, 3).
The modeled O3concentrations are slightly overestimated
with respect to the measured O3 concentrations, by 7.5
(12 %), 4.3 (5 %) and 8.3 ppb (13 %) from VBS-LNOX and 12.9 (21 %), 4.3 (5 %) and 9.8 ppb (16 %) from VBS-LA for the maximum concentrations, and by 4.3 (9 %), 11.3 (20 %) and 3.0 ppb (6 %) from VBS-LNOX and 4.6 (9 %), 11.7 (20 %) and 3.3 ppb (7 %) from VBS-LA for the back-ground concentrations during the three flights, respectively (Tables 3, S1; Fig. 4). Note that, for Ox, the concentrations
can be slightly less overestimated than for O3 by,
respec-tively, 3.0 (6 %), 11.0 (19 %) and 1.8 ppb (4 %) from VBS-LNOX and 3.4 (7 %), 11.4 (19 %) and 2.1 ppb (4 %) from VBS-LA for the background concentrations due to the oppo-site sign in measured O3and NOx differences (Tables 1, 3,
S1; Fig. S2) and sometimes for the maximum concentrations by 8.5 (13 %), 3.6 (4 %), 8.0 ppb (12 %) from VBS-LNOX and 13.1 (21 %), 3.5 (4 %) and 9.2 ppb (14 %) from VBS-LA. Similar to the observations, the modeled maximum O3
However, the BC underestimation in simulations lets us also expect a POA underestimation.
Consequences of these underestimations in primary pollu-tants on the buildup of secondary pollupollu-tants are briefly dis-cussed here.
– First, as shown above for BC, the underestimation is alleviated in the alternative VBS-LA simulation with larger BC (and POA) emissions. Thus, unexpressed un-certainty in meteorological data is partly taken into ac-count by that in emissions.
– Second, the use of OA vs. Ox slopes for evaluation of
the SOA production efficiency normalizes the effect of errors in primary pollutants, as in Eq. (1); it merely de-pends on the ratio of the product yields. This is why the use of this ratio is important for this study.
– Third, in a VOC-limited regime, as is characteristic for the Paris region (e.g., Deguillaume et al., 2008), the rate of secondary pollutant buildup is far from proportional to the primary precursor concentration. On the contrary, in the extreme case that NOxcompounds represent the
only OH loss, NOxand OH concentrations are inversely
proportional (e.g., Kleinman et al., 1997). When assum-ing a constant ratio in primary pollutants, the flux in Eq. (1) is then independent of VOC concentrations and only depends on the production rate of odd hydrogen radicals (OH+HO2+RO2).
The measured OA plume is correlated with the measured BC plume on 16 July, while it appears translated to the west on 21 and 29 July, as is also the ozone plume (Figs. 3–5). This is probably due to an additional contribution from other sources besides the Paris emissions, such as background lev-els from regional contributions related to both anthropogenic and biogenic sources. In the simulations, OA, O3, BC, and
NOx plumes coincide for all dates indicating a contribution
from the Paris emissions. As expected from results in Zhang et al. (2013) for urban and suburban Paris sites, the VBS-LA simulation with single-step oxidation scheme for ASOA and BSOA formation generally underestimates OA measure-ments, in particular for the background concentrations, by up to 80 % (Fig. 5). A slight overestimation of 1 µg m−3is ob-served in the plume for the maximum concentration during the flight on 16 July. This is related to high POA and SI-SOA contributions of up to 70 % to the total OA concentrations in the plume (Figs. S3, S4). Thus, apparently, the increased plume SI-SOA buildup due to increased POA emissions in
chosen for both simulation configurations in the larger do-main. The maximum concentration of OA simulated with VBS-LNOX is overestimated with respect to the measure-ment by 1.7 (28 %), 0.4 (3 %) and 1.5 µg m−3 (21 %) on 16, 21 and 29 July, respectively, while it fits well with the observations in VBS-HNOX, being slightly underestimated by−0.5 (−8 %),−1 (−8 %) and−0.5 µg m−3(−7 %)
(Ta-bles 3, S1; Fig. 5). The modeled OA background concentra-tions are underestimated both on 16 and 29 July by VBS-LNOX by, respectively, −1.6 (−41 %) and −1.0 µg m−3
(−25 %) and by VBS-HNOX by, respectively,−1.9 (−50 %) and−1.4 µg m−3(−33 %). They are overestimated with both configurations on 21 July by 2.3 (36 %) and 1.9 µg m−3 (29 %), respectively (Tables 3, S1). All in all, simulated and observed OA concentrations are rather similar, which is a sat-isfying result in light of often very large model to observa-tion differences reported in literature (e.g., Sciare et al., 2010, for the Paris region). However, as the primary pollutants are generally underestimated by the model, this might be the re-sult of compensating errors for different OA compounds. In a later section (Sect. 4.3), we will thus rely on OA versus Ox
slopes in the Paris plume for further analysis.
4.2 OA plume buildup
First, the plume productions of OA (and of Ox)are derived
here from the difference between maximum and background (30th percentile) concentrations over flight transects as given in the last section. Ox is preferred here with respect to O3
since it is not affected by titration with NO. For the 3 flight days (16, 21 and 29 July), the measured values of OA plume buildup are 2.1, 5.9 and 3.2 µg m−3, respectively, while they are 5.4, 4.0 and 5.8 µg m−3 in VBS-LNOX, 3.5, 3.0 and 4.1 µg m−3 in VBS-HNOX and 5.9, 1.4 and 3.1 µg m−3 in VBS-LA (Tables 1, 3). Thus, independent of the model con-figuration used, overestimations of plume OA occur on 2 days (16 and 29 July), while an underestimation appears on 21 July. The plume’s Ox production for the 3 flight days,
calculated again from the difference between the maximum concentrations and the background concentrations are, re-spectively, 12.9, 21.8 and 12.6 ppb from the measurements, 18.3, 14.4 and 18.8 ppb from VBS-LNOX, and 22.5, 13.9 and 19.7 ppb from VBS-LA (Tables 1, 3). As for OA, we encounter an overestimation of plume Oxon 16 and 29 July,
Table 4.Correlation coefficients between OA and Ox, SI-SOA and Ox, ASOA and Oxand BSOA and Ox for the flights on 16, 21 and
29 July, both from the measurements (AMS) and simulations with VBS-LNOX, VBS-HNOX and VBS-LA.
Data Date OA / Ox SI-SOA / Ox ASOA / Ox BSOA / Ox
AMS 16 Jul 0.70 21 Jul 0.71 29 Jul 0.72
VBS-LNOX 16 Jul 0.95 0.91 0.96 0.57 21 Jul 0.95 0.77 0.85 0.90 29 Jul 0.98 0.79 0.93 0.84
VBS-HNOX 16 Jul 0.96 0.90 0.96 0.45 21 Jul 0.95 0.77 0.92 0.88 29 Jul 0.98 0.78 0.95 0.80
VBS-LA 16 Jul 0.87 0.88 0.89 0.89 21 Jul 0.67 0.83 0.68 0.65 29 Jul 0.88 0.86 0.88 0.94
Table 5.Slopes of OA vs. Ox, SI-SOA vs. Ox, ASOA vs. Ox and BSOA vs. Ox for the flights on 16, 21 and 29 July, both from the
measurements (AMS) and simulations with VBS-LNOX, VBS-HNOX and VBS-LA.
Data Date OA / Ox SI-SOA / Ox ASOA / Ox BSOA / Ox
AMS 16 Jul 0.13 21 Jul 0.14 29 Jul 0.15
VBS-LNOX 16 Jul 0.23 0.04 0.18 0.02 21 Jul 0.29 0.02 0.11 0.16 29 Jul 0.26 0.03 0.14 0.09
VBS-HNOX 16 Jul 0.15 0.04 0.10 0.01 21 Jul 0.24 0.02 0.08 0.15 29 Jul 0.19 0.03 0.09 0.08
VBS-LA 16 Jul 0.19 0.15 0.01 0.02 21 Jul 0.07 0.03 0.00 0.03 29 Jul 0.11 0.07 0.01 0.03
the given data set could not be used directly for evaluation of the OA scheme in the model.
To overcome these problems, we analyze here OA versus Oxplots. As explained in the introduction, the slopes of these
plots can represent in-plume OA buildup, normalized with respect to the availability of VOC precursors and oxidant agents (OH, O3and NO3). This holds under the ideal
hypoth-esis of a constant mix of VOC, SVOC and IVOC precursors on one hand, and oxidant agents on the other hand, for the considered data points of a flight. As explained in Sect. 2, we did not plot OOA or SOA vs. Oxbecause of the uncertainties
related to PMF analysis and the definition of HOA comparing to POA or/and SI-SOA and cooking-related OA. In Sect. 2 we also presented correlations of about 0.7 (R) between OA and Oxmeasured on the flight legs for a given day. Modeled
OA and Oxon these flight legs show an even higher
correla-tion of about 0.87 from VBS-LA, except for 0.67 on 21 July,
and of more than 0.95 from VBS-HNOX and VBS-LNOX (Table 4). These good correlations suggest that we are close enough to the “constant mix” hypothesis to make the OA vs. Ox slope a useful metric. The simulated slopes of OA / Ox
are 0.23, 0.29 and 0.26 µg m−3ppb−1 with the VBS-LNOX configuration for the three flights on 16, 21 and 29 July, re-spectively (Fig. 6, Table 5). They overestimate the measured slopes of 0.13, 0.14 and 0.15 µg m−3ppb−1by a factor be-tween 1.7 and 2. We noticed that the small variability in the relative differences between flights are due to the normaliz-ing method (i.e., plottnormaliz-ing OA vs. Ox to normalize with
re-spect to photochemical conditions). This overestimation can be related to the SOA formation scheme: it is likely that the high-SOA yields under low-NOxconditions are incorrect
un-der plume conditions. The corresponding slopes in the VBS-HNOX simulation with lower yields under high-NOx
similar range of errors with respect to the observed slopes (even if the sign of errors is different). However, as we will show in Sect. 5, these two simulations show a very differ-ent distribution of ASOA, BSOA and SI-SOA buildup in the plume (Figs. S4–S6). Apparently, observed OA / Ox slopes
cannot constrain these distributions.
The measured slopes of OA vs. Ox during the first two
flight legs on these days are close to the ones during the last two flight legs (Figs. S7, S8). This analysis focuses on the VBS-HNOX scheme. The modeled slopes of OA vs. Ox
(0.12, 0.23 and 0.17 µg m−3ppb−1for the 3 flights) are close
to the measured ones (0.12, 0.18 and 0.16 µg m−3ppb−1) dur-ing the first two flight legs. Conversely, these slopes (0.17, 0.25 and 0.21 µg m−3ppb−1) are overestimated by factors of 1.3, 1.9, and 1.3 with respect to the measured ones during the last two flight legs. Thus, the overestimation of slopes occurs especially during the last two flight legs, which is related to relatively higher anthropogenic SOA formation due to con-tinuous chemical aging when flights are farther away from fresh Paris emissions. The higher slopes during the last two flight legs than during the first two flight legs are not seen for BSOA, probably because the biogenic VOC emissions are more diffuse (Figs. S7, S8). Even if some differences are made evident, the good agreement of OA vs. Ox slopes
be-tween simulations and measurements represents a valuable validation of the VBS-HNOX scheme for the conditions of the Paris plume.
5 Impact of the Paris plume on surrounding regions In this section we analyze the contribution of OA buildup from emissions in or near the Paris agglomeration to re-gional OA levels. This analysis is based on simulations with the VBS-HNOX configuration and the VBS-LA simulations, which show similar errors with respect to observed OA / Ox
slopes indicative for plume OA buildup. The VBS-LNOX simulation clearly showed larger errors. We will first analyze the individual buildup of OA species for the 3 flight days (Sect. 5.1), then we will study the time evolution of a pollu-tion plume on 16 July (Sect. 5.2) and, finally, we will present the averaged results for July 2009.
5.1 Plume buildup of individual OA species 5.1.1 VBS-HNOX simulation
The slopes of modeled SI-SOA, ASOA (anthropogenic SOA) and BSOA (biogenic SOA) versus Ox are well correlated,
ble 5). They represent 27, 8, and 16 % of the total OA vs. Ox slopes. Thus, SI-SOA has only a minor contribution to
the Paris plume OA formation in this simulation. The anthro-pogenic photochemical production of ASOA from aromat-ics dominates the OA production on 16 and 29 July, with slopes of 0.10 and 0.09 µg m−3ppb−1, respectively, and of 0.08 µg m−3ppb−1 on 21 July (Table 5). On 29 and espe-cially on 16 July, the SOA production is strongly influenced by anthropogenic emissions (by more than 90 %). A major contribution of anthropogenic VOC emissions to OA buildup in the Paris plume during MEGAPOLI flights has also been found by Freney et al. (2014), from a conjoint analysis by AMS OA measurements and PTR-MS (proton transfer re-action - mass spectrometry) VOC compounds. These results imply important SOA formation from the Paris agglomera-tion VOCs and to a lesser extent POA / SI-VOC emissions. Borbon et al. (2013) found emission ratios for C7–C9 aro-matics in Paris which were by a factor of 2–3 higher than in Los Angeles and other French and European Union urban areas. This clearly could favor large anthropogenic SOA for-mation of OA in the Paris plume. Conversely, BSOA forma-tion dominates the SOA producforma-tion on 21 July, with a slope of BSOA vs. Oxof 0.15 µg m−3ppb−1(Table 5), about 63 %
of the slope of OA vs. Ox. BSOA formation can be due to
both fresh BVOC (biogenic VOC) emissions from mainly isoprene emitting forests north of Paris and from condensa-tion of biogenic SVOC when temperatures decrease in the later afternoon. Recently, the comparison of different VBS-based SOA schemes to chamber measurements in Zhao et al. (2015) suggests lower SOA formation from traditional VOC precursors (ASOA), by explicitly simulating the first-generation products, than when using the parametrization from Lane et al. (2008a) as in our study. In addition, Lane et al. (2008a) do not account for BSOA chemical aging, while we do based on the results of Zhang et al. (2013). Thus, the relative contributions of ASOA and BSOA to plume SOA buildup in the VBS-LNOX and VBS-HNOX configurations used in this paper are considered as an upper limit, while the primary SI-VOC emissions for SI-SOA formation are con-sidered as a lower limit. Others studies taking into account fragmentation reactions (Jimenez et al., 2009; Shrivastava et al., 2011; Murphy et al., 2012) reduce OA formation.
5.1.2 VBS-LA simulation
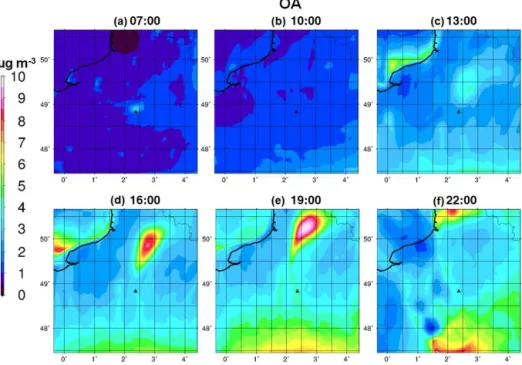
Figure 7.Urban OA (PM10fraction) plume (µg m−3) evolution on 16 July from VBS-HNOX, the triangle represents the location of Paris,
illustrated by six panels (fromatof) corresponding to 07:00–22:00 (UTC+2) with a time step of 3 h.
0.07 µg m−3ppb−1for the three flights, respectively, and
rep-resent 79, 42, and 64 % of the total OA vs. Oxslopes. ASOA
vs. Ox slopes are negligible (0.00 or 0.01 µg m−3ppb−1).
BSOA vs. Ox slopes are 0.02, 0.03, and 0.03 µg m−3ppb−1
for the three flights, respectively, and represent 10, 42, and 27 % of the total OA vs. Oxslopes. However, we noticed that
for the VBS-LA simulation the uncertainty in the determina-tion of the slope is larger than for VBS-HNOX. For all three SI-SOA vs. Oxplots, two regimes with two different slopes
are observed. If the slope was only taken for points with larger SI-SOA and Oxvalues, which are closer to the plume,
a larger slope would have been determined. To a lesser ex-tent, this feature also appears for VBS-LNOX simulations.
The larger SI-SOA vs. Ox slopes in the VBS-LA
simula-tion are easily explained by the larger POA emissions in this configuration. The range of SI-SOA vs. Ox slopes between
the VBS-HNOX and the VBS-LA configuration represents the uncertainty due to POA emissions (Table 5). Even larger SI-SOA vs. Oxslopes during these flights would also be
ex-pected if the more aggressive SI-SOA formation scheme by Grieshop et al. (2009) had been used. With the Grieshop et al. (2009) formulation, SVOC species have a reaction rate constant 2 times lower than in this study with Robinson et al. (2007) but are shifted to 2 orders of magnitude lower volatility (instead of one), with a mass increase by 40 % for each oxidation step (instead of 7.5 %). Box simulations by Dzepina et al. (2011) for Mexico City and by Hayes et al. (2015) for Los Angeles yield about 2 times larger SI-SOA yields with the Grieshop et al. (2009) scheme than with the Robinson et al. (2007) scheme. These results suggest an
addi-tional possibility to increase SI-SOA contributions to plume SOA.
As a result of these comparisons, we come to the conclu-sion that, due to uncertainty both in POA emisconclu-sions and in the SOA formation formulations, the constraint of observed OA vs. Oxslopes on the SOA distribution in the Paris plume
is unfortunately weak. ASOA and SI-SOA could be the ma-jor anthropogenic SOA products for two flights, with varying contributions of BSOA.
5.2 Time evolution of the plume on 16 July
Figure 7 gives a typical picture of the OA species evolution in the Paris plume (at surface), simulated with both the VBS-HNOX scheme and the VBS-LA scheme.
Figure 8.Urban POA(a), SI-SOA(b), ASOA(c)and BSOA(d)
(in PM10) plumes (µg m−3) from VBS-HNOX at 16:00 (UTC+2)
on 16 July; the triangle represents the location of Paris.
of (i) the time needed for processing of precursor emissions and (ii) the largest accumulation of precursor emissions in the early morning hours when wind speeds over the agglom-eration are very low (also seen in the POA peak at the same location). BSOA contributes to the regional background and is little affected by the anthropogenic Paris agglomeration emissions (Fig. 8). The highest OA concentrations of about 10 µg m−3 occur in the evening at 19:00 UTC in northern
France (at∼150 km from the agglomeration center) due to
continuous photochemical SVOC production and aging, and due to lower temperatures. At 22:00 UTC, the plume is leav-ing the MEG3 model domain.
This phenomenon of continuing SOA formation which is detached from the original rush hour emission area due to transport is very similar to that observed for Los Angeles in the CalNex study (Hayes et al., 2013).
The corresponding results obtained with the VBS-LA scheme are shown in the Supplement (Fig. S9). Morning OA concentrations are about 3 times larger than in VBS-HNOX due to larger emissions, while the background con-centrations are all lower than 1 µg m−3. At 13:00 UTC, an
OA plume with a concentration about 6 µg m−3higher than
in VBS-HNOX is formed at about 50 km from the agglom-eration center. While ASOA is the major contributor to OA plume formation in VBS-HNOX, SI-SOA formation con-tributes the most to the plume in VBS-LA and produces the maximum concentration of about 6 µg m−3in the later after-noon at 16:00 UTC towards northern France. POA, ASOA and/or BSOA contribute less than 1 µg m−3to the OA plume maximum (Fig. S10).
Figure 9. Modeled monthly mean OA concentration in PM10
(µg m−3) from VBS-HNOX; the triangle represents the location of Paris.
Figure 10.Modeled monthly mean POA(a), SI-SOA(b), ASOA(c)
and BSOA(d)concentration in PM10(µg m−3) from VBS-HNOX;
the triangle represents the location of Paris.
5.3 Average July 2009 urban OA contribution to the surroundings of Paris
150 km in the N–NE of Paris. Contrary to VBS-HNOX, OA values from VBS-LA show a distinct OA plume from the Paris agglomeration: the absolute plume concentrations are lower. This behavior can be analyzed by considering specifi-cally the contributions to OA.
For the VBS-HNOX simulation, the average POA from Paris emissions is only about 0.15 µg m−3 over Paris and the area of enhanced values extends to the E–NE because of the largest climatological frequency of southwesterly to westerly winds in July (Fig. 10). The areas of enhancements of POA occur on a length scale of some tens of kilome-ters around the agglomeration. ASOA is enhanced within the agglomeration and within the SW and NNE plume, up to 100–150 km downwind of the agglomeration, respectively. The maximum concentrations in these plumes are 0.4 and 0.35 µg m−3, respectively (always for the July 2009 average).
In the NNE direction, enhanced values originate from pol-lution events under SW flow, such as those studied in this work (see Sect. 5.2). The enhanced values in the SW orig-inate from a pronounced pollution plume occurring in the beginning of July, for which no measurements were avail-able. SI-SOA is most enhanced in the NNE direction, where its maximum concentration is about 0.35 µg m−3, thus some-what smaller than the ASOA concentration. It is worth not-ing that these increases in ASOA and SI-SOA concentrations are much larger when analyzing individual events than when looking at averages, due to different plume angles on dif-ferent days and thus diluting the average fields. The BSOA component does not show distinct plumes, but a continuous NW/W–SE/E gradient that is the continental character of air masses implies large average BSOA concentrations. BSOA is the strongest contributor to OA over the domain. Its gra-dient is responsible for the W–E OA gragra-dient noticed earlier, with smaller contributions from the other components.
For the VBS-LA simulation, the larger primary S/IVOC emissions within the LA inventory lead to a larger average POA concentration of up to 0.7 µg m−3within the Paris ag-glomeration. The monthly maximum plume SI-SOA con-centration is about 0.3 µg m−3 in VBS-LA (Fig. S12). The lower SI-SOA concentration albeit with higher POA concen-trations is due to lower OA load in the plume. Indeed, the monthly average plume ASOA concentration is small, below 0.05 µg m−3, and the plume BSOA concentration is below 0.3 µg m−3. BSOA shows a similar spatial pattern in VBS-LA but with lower absolute values than in VBS-HNOX.
In conclusion, both the VBS-HNOX and VBS-LA simu-lations show different monthly average OA product distri-butions. As discussed above, the ASOA and BSOA contri-butions in VBS-HNOX represent an upper limit for ASOA and BSOA produced in the plume (and in background air masses). Conversely, the small plume and background val-ues in VBS-LA simulated without any chemical aging are probably underestimated, in particular because they under-estimate the SOA observations within the Paris agglomera-tion (Zhang et al., 2013). Moreover, for SI-SOA, the
differ-ences between both simulations are weak. However, alterna-tive VBS schemes (Grieshop et al., 2009) would simulate a higher SI-SOA formation, as noted above (about a factor 2 from box model studies in other urban plumes).
6 Conclusion
CHIMERE simulations are used to study the secondary pol-lutant formation in the Paris plume and its impact on the sur-rounding regions. This study focusses on 3 photochemically active days for which airborne observations are available. Three simulation configurations are set up in order to cover the range of uncertainty in emissions and in different formu-lations of the SOA buildup in the frame of the VBS scheme. Primary pollutants within the plume, such as NOx, BC and
probably also POA, are clearly underestimated in the model when using the MEGAPOLI inventory, and to a lesser extent with the EMEP-LA inventory. For two of the three flights, this underestimation is probably due to too high wind speeds in the morning over the Paris agglomeration, not allowing for strong enough pollution accumulation. Conversely, ozone is slightly overestimated in the plume and in background air masses, as is Ox. This is not contradictory since the chemical
regime in Paris and its surroundings is generally NOx
sat-urated (Deguillaume et al., 2008). Both in observations and simulations, predicted (and measured) OA is very well cor-related with predicted (and measured) Ox. The ratio of the
photochemical productivities of SOA and Ox(represented by
the slope of OA vs. Ox)is well simulated (overestimation of
less than 30 % on the average of 3 days) for the Paris plume from VBS-HNOX when low SOA yields are applied on the SOA formation scheme. The overestimation might be related to too large yields of ASOA in the VBS scheme set up in this work, which was based on the parameters given in Lane et al. (2008a) and Murphy and Pandis (2009). Nevertheless, this good agreement is an important result in evaluating the VBS scheme with field data. Combined with similar recent results for the Tokyo megacity (Morino et al., 2014), it shows good performance of the VBS schemes in large urban areas and in their plumes. When considering the OA to Oxslopes,
the day to day variability in model to observation results is much lower than for OA alone. Observed OA vs. Ox slopes
of about 0.14–0.15 µg m−3ppb−1compare well to those ob-served in the Mexico City, Los Angeles and Tokyo plumes with different emissions and photochemical conditions dur-ing different seasons (Fig. 1).
However, an alternative scheme with 3 times larger POA emissions, and without ASOA and BSOA aging, also shows good agreement with observed OA vs. Ox slopes, though
Predicted maximum OA is found on the flight leg most dis-tant from the agglomeration (at about 150 km), as for obser-vations, indicating secondary anthropogenic SOA formation from Paris emissions over all the distances and during several hours. On a monthly average, OA from Paris emissions con-tributes to the OA regional buildup at different length scales, from several tens of kilometers for POA to several hundreds of kilometers for ASOA and SI-SOA. Clearly, a combination of ASOA and SI-SOA buildup from precursor emissions in the Paris agglomeration affects atmospheric composition at a regional scale. Simulating this buildup has been possible only after an original model evaluation showing good agree-ment between simulated and observed OA to Oxslopes. This
slope is an interesting parameter to measure the SOA buildup efficiency of a given environment.
The Supplement related to this article is available online at doi:10.5194/acp-15-13973-2015-supplement.
Acknowledgements. The research leading to these results has received funding from the European Community’s Seventh Framework Programme FP/2007-2011 under grant agreement no. 212520. Support from the French ANR project MEGAPOLI – PARIS (ANR-09-BLAN-0356), from the CNRS-INSU/FEFE via l’ADEME (no. 0962c0018) and the Ile de France/SEPPE are acknowledged. We would like to thank the pilots, the flight crew, and the whole SAFIRE team for operating the ATR-42 aircraft. A part of the work was supported by a PhD grant from CIFRE (ANRT) to Q. J. Zhang (at LISA/CNRS and ARIA Technologies).
Edited by: J.-L. Jimenez
References
Aumont, B., Valorso, R., Mouchel-Vallon, C., Camredon, M., Lee-Taylor, J., and Madronich, S.: Modeling SOA formation from the oxidation of intermediate volatility n-alkanes, Atmos. Chem. Phys., 12, 7577–7589, doi:10.5194/acp-12-7577-2012, 2012. Beekmann, M. and Vautard, R.: A modelling study of
pho-tochemical regimes over Europe: robustness and variability, Atmos. Chem. Phys., 10, 10067–10084, doi:10.5194/acp-10-10067-2010, 2010.
Beekmann, M., Prévôt, A. S. H., Drewnick, F., Sciare, J., Pandis, S. N., Denier van der Gon, H. A. C., Crippa, M., Freutel, F., Poulain, L., Ghersi, V., Rodriguez, E., Beirle, S., Zotter, P., von der
late matter levels in the Paris megacity, Atmos. Chem. Phys., 15, 9577–9591, doi:10.5194/acp-15-9577-2015, 2015.
Bessagnet, B., Menut, L., Curci, G., Hodzic, A., Guillaume, B., Li-ousse, C., Moukhtar, S., Pun, B., Seigneur, C., and Schulz, M.: Regional modeling of carbonaceous aerosols over Europe – focus on secondary organic aerosols, J. Atmos. Chem., 61, 175–202, 2009.
Borbon, A., Gilman, J. B., Kuster, W. C., Grand, N., Chevaillier, S., Colomb, A., Dolgorouky, C., Gros, V., Lopez, M., Sarda-Esteve, R., Holloway, J., Stutz, J., Perrussel, O., Petetin, H., McKeen, S., Beekmann, M., Warneke, C., Parrish, D. D., and de Gouw, J. A.: Emission ratios of anthropogenic VOC in northern mid-latitude megacities: observations vs. emission inventories in Los Angeles and Paris, J. Geophys. Res., 118, 2041–2057, 2013.
Cappa, C. D. and Wilson, K. R.: Multi-generation gas-phase oxida-tion, equilibrium partitioning, and the formation and evolution of secondary organic aerosol, Atmos. Chem. Phys., 12, 9505–9528, doi:10.5194/acp-12-9505-2012, 2012.
Crippa, M., DeCarlo, P. F., Slowik, J. G., Mohr, C., Heringa, M. F., Chirico, R., Poulain, L., Freutel, F., Sciare, J., Cozic, J., Di Marco, C. F., Elsasser, M., Nicolas, J. B., Marchand, N., Abidi, E., Wiedensohler, A., Drewnick, F., Schneider, J., Borrmann, S., Nemitz, E., Zimmermann, R., Jaffrezo, J.-L., Prévôt, A. S. H., and Baltensperger, U.: Wintertime aerosol chemical compo-sition and source apportionment of the organic fraction in the metropolitan area of Paris, Atmos. Chem. Phys., 13, 961–981, doi:10.5194/acp-13-961-2013, 2013.
Deguillaume, L., Beekmann, M., and Derognat, C.: Uncertainty evaluation of ozone production and its sensitivity to emission changes over the Ile-de-France region during summer periods, J. Geophys. Res., 113, D02304, doi:10.1029/2007JD009081, 2008. Derognat, C., Beekmann, M., Baeumle, M., Martin, D., and Schmidt, H.: Effect of biogenic volatile organic compound emis-sions on tropospheric chemistry during the atmospheric Pollution Over the Paris Area (ESQUIF) campaign in the Ile-de-France re-gion, J. Geophys. Res., 108, 8560, doi:10.1029/2001JD001421, 2003.
Donahue, N. M., Robinson, A. L., Stanier, C. O., and Pandis, S. N.: Coupled partitioning, dilution, and chemical aging of semivolatile organics, Environ. Sci. Technol., 40, 2635–2643, 2006.
Dudhia, J.: A nonhydrostatic version of the Penn State/NCAR mesoscale model: validation tests and simulation of an Atlantic cyclone and cold front, Mon. Weather Rev., 121, 1493–1513, 1993.
Freney, E. J., Sellegri, K., Canonaco, F., Colomb, A., Borbon, A., Michoud, V., Doussin, J.-F., Crumeyrolle, S., Amarouche, N., Pi-chon, J.-M., Bourianne, T., Gomes, L., Prevot, A. S. H., Beek-mann, M., and Schwarzenböeck, A.: Characterizing the impact of urban emissions on regional aerosol particles: airborne measure-ments during the MEGAPOLI experiment, Atmos. Chem. Phys., 14, 1397–1412, doi:10.5194/acp-14-1397-2014, 2014.
Freutel, F., Schneider, J., Drewnick, F., von der Weiden-Reinmüller, S.-L., Crippa, M., Prévôt, A. S. H., Baltensperger, U., Poulain, L., Wiedensohler, A., Sciare, J., Sarda-Estève, R., Burkhart, J. F., Eckhardt, S., Stohl, A., Gros, V., Colomb, A., Michoud, V., Doussin, J. F., Borbon, A., Haeffelin, M., Morille, Y., Beekmann, M., and Borrmann, S.: Aerosol particle measurements at three stationary sites in the megacity of Paris during summer 2009: meteorology and air mass origin dominate aerosol particle com-position and size distribution, Atmos. Chem. Phys., 13, 933–959, doi:10.5194/acp-13-933-2013, 2013.
Grieshop, A. P., Logue, J. M., Donahue, N. M., and Robinson, A. L.: Laboratory investigation of photochemical oxidation of or-ganic aerosol from wood fires 1: measurement and simulation of organic aerosol evolution, Atmos. Chem. Phys., 9, 1263–1277, doi:10.5194/acp-9-1263-2009, 2009.
Guenther, A., Karl, T., Harley, P., Wiedinmyer, C., Palmer, P. I., and Geron, C.: Estimates of global terrestrial isoprene emissions using MEGAN (Model of Emissions of Gases and Aerosols from Nature), Atmos. Chem. Phys., 6, 3181–3210, doi:10.5194/acp-6-3181-2006, 2006.
Gurjar, B. R., Jain, A., Sharma, A., Agarwal, A., Gupta, P., Nagpure, A. S., and Lelieveld, J.: Human health risksin megacities due to air pollution, Atmos. Environ., 44, 4606–4613, 2010.
Hallquist, M., Wenger, J. C., Baltensperger, U., Rudich, Y., Simp-son, D., Claeys, M., Dommen, J., Donahue, N. M., George, C., Goldstein, A. H., Hamilton, J. F., Herrmann, H., Hoff-mann, T., Iinuma, Y., Jang, M., Jenkin, M. E., Jimenez, J. L., Kiendler-Scharr, A., Maenhaut, W., McFiggans, G., Mentel, Th. F., Monod, A., Prévôt, A. S. H., Seinfeld, J. H., Surratt, J. D., Szmigielski, R., and Wildt, J.: The formation, properties and im-pact of secondary organic aerosol: current and emerging issues, Atmos. Chem. Phys., 9, 5155–5236, doi:10.5194/acp-9-5155-2009, 2009.
Hauglustaine, D. A., Hourdin, F., Jourdain, L., Filiberti, M. A., Walters, S., Lamarque, J.-F., and Holland, E. A.: Interac-tive chemistry in the Laboratoire de Meteorologie. Dynamique general circulation model: Description and background tropo-spheric chemistry evaluation, J. Geophys. Res., 109, D04314, doi:10.1029/2003JD003957, 2004.
Hayes, P. L., Ortega, A. M., Cubison, M. J., Froyd, K. D., Zhao, Y., Cliff, S. S., Hu, W. W., Toohey, D. W., Flynn, J. H., Lefer, B. L., Grossberg, N., Alvarez, S., Rappenglück, B., Taylor, J. W., Allan, J. D., Holloway, J. S., Gilman, J. B., Kuster, W. C., Gouw, J. A., Massoli, P., Zhang, X., Liu, J., Weber, R. J., Corri-gan, A. L., Russell, L. M., Isaacman, G., Worton, D. R., Kreis-berg, N. M., Goldstein, A. H., Thalman, R., Waxman, E. M., Volkamer, R., Lin, Y. H., Surratt, J. D., Kleindienst, T. E., Of-fenberg, J. H., Dusanter, S., Griffith, S., Stevens, P. S., Brioude, J., Angevine, W. M., and Jimenez, J. L.: Organic aerosol com-position and sources in Pasadena, California during the 2010 CalNex campaign, J. Geophys. Res.-Atmos., 118, 9233–9257, doi:10.1002/jgrd.50530, 2013.
Hayes, P. L., Carlton, A. G., Baker, K. R., Ahmadov, R., Washen-felder, R. A., Alvarez, S., Rappenglück, B., Gilman, J. B., Kuster, W. C., de Gouw, J. A., Zotter, P., Prévôt, A. S. H., Szidat, S., Kleindienst, T. E., Offenberg, J. H., Ma, P. K., and Jimenez, J. L.: Modeling the formation and aging of secondary organic aerosols in Los Angeles during CalNex 2010, Atmos. Chem. Phys., 15, 5773–5801, doi:10.5194/acp-15-5773-2015, 2015.
Herndon, S., Onasch, T., Wood, E. C., Kroll, J. H., Canagaratna, M., Jayne, J., Zavala, M., Knighton, W. B., Mazzoleni, C., Dubey, M. K., Ulbrich, I., Jimenez, J. L., Seila, R., de Gouw, J. A., De Foy, B., Fast, J., Molina, L., Kolb, C. E., and Worsnop, D. R.: The correlation of secondary organic aerosol with odd oxygen in Mexico City, Geophys. Res. Lett., 35, L15804, oi:10.1029/2008GL034058, 2008.
Hodzic, A., Jimenez, J. L., Madronich, S., Canagaratna, M. R., De-Carlo, P. F., Kleinman, L., and Fast, J.: Modeling organic aerosols in a megacity: potential contribution of semi-volatile and inter-mediate volatility primary organic compounds to secondary or-ganic aerosol formation, Atmos. Chem. Phys., 10, 5491–5514, doi:10.5194/acp-10-5491-2010, 2010.
Honoré, C., Rouil, L., Vautard, R., Beekmann, M., Bessagnet, B., Dufour, A., Elichegaray, C., Flaud, J.-M., Malherbe, L., Meleux, F., Menut, L., Martin, D., Peuch, A., Peuch, V. H., and Poisson, N.: Predictability of European air quality: The assessment of three years of operational forecasts and analy-ses by the PREV’AIR system, J. Geophys. Res., 113, D04301, doi:10.1029/2007JD008761, 2008.
IPCC: Climate Change 2013: The Physical Science Basis: Sum-mary for Policymakers, Cambridge, UK, 2013.
Jimenez, J. L., Canagaratna, M. R., Donahue, N. M., Prevot, A. S. H., Zhang, Q., Kroll, J. H., DeCarlo, P. F., Allan, J. D., Coe, H., Ng, N. L., Aiken, A. C., Docherty, K. S., Ulbrich, I. M., Grieshop, A. P., Robinson, A. L., Duplissy, J., Smith, J. D., Wil-son, K. R., Lanz, V. A., Hueglin, C., Sun, Y. L., Tian, J., Laak-sonen, A., Raatikainen, T., Rautiainen, J., Vaattovaara, P., Ehn, M., Kulmala, M., Tomlinson, J. M., Collins, D. R., Cubison, M. J., Dunlea, E. J., Huffman, J. A., Onasch, T. B., Alfarra, M. R., Williams, P. I., Bower, K., Kondo, Y., Schneider, J., Drewnick, F., Borrmann, S., Weimer, S., Demerjian, K., Salcedo, D., Cot-trell, L., Griffin, R., Takami, A., Miyoshi, T., Hatakeyama, S., Shimono, A., Sun, J. Y., Zhang, Y. M., Dzepina, K., Kimmel, J. R., Sueper, D., Jayne, J. T., Herndon, S. C., Trimborn, A. M., Williams, L. R., Wood, E. C., Middlebrook, A. M., Kolb, C. E., Baltensperger, U., and Worsnop, D. R.: Evolution of Or-ganic Aerosols in the Atmosphere, Science, 326, 1525–1529, doi:10.1126/science.1180353, 2009.
Junker, C. and Liousse, C.: A global emission inventory of car-bonaceous aerosol from historic records of fossil fuel and biofuel consumption for the period 1860–1997, Atmos. Chem. Phys., 8, 1195–1207, doi:10.5194/acp-8-1195-2008, 2008.
Kleinman, L. I., Daum, P. H., Lee, J. H., Lee, Y.-N., Nunnermacker, L. J., Springston, S. R., Newman, L., Weinstein-Lloyd, J., and Sillman, S.: Dependence of ozone production on NO and hydro-carbons in the troposphere, Geophys. Res. Lett., 24, 2299–2302, 1997.