87
SUMMARY
Authors analysed field test data (collected and owned by the National Institute for Agricultural Quality Control between 1994-1999) of various pig breeds (Belgian Landrace, Duroc, Pietrain), and constructions (Duroc × Belgian Landrace, Belgian Landrace × Hampshire, Pietrain × Hampshire, Pietrain × Duroc, the D and E-lines of the Ka-Hyb hybrid pig). Gilts are kept in groups up to 25 pigs while boars are raised in smaller groups up to 15 on an ad libitum feeding regime. In the field test three ultrasonic back fat measurements are taken from boars and gilts between 80 and 110 kg at the middle of the spinal chord (shoulder, mid-back, loin). Average back fat thickness is calculated as the average of these three measurements. Heritability of average back fat depth was estimated using the REML method. The estimates varied between 0.12-0.51 depending on the genotype. The existence of genetic ties between the herds of the various pig populations was measured through the use of boars across the herds. Concerning the Belgian Landrace breed and the E-line of the Ka-Hyb hybrid pig no genetic ties were found, which means that the boars of these populations were only used within the herds. On the other hand week connections (5-14%) were found for the other genotypes. Boars having been used in two or more herds showed more reliable breeding values (lower prediction error variance) than those animals, which had progeny in one herd only. Based on the results authors suggested the exclusive application of the BLUP method in the Hungarian pig evaluation.
KEY WORDS
pig, heritability, REML method ORIGINAL SCIENTIFIC PAPER
Agriculturae Conspectus Scientificus, Vol. 69 (2004) No. 4 (87-90)
Examination of the Genetic
Connectedness of Various Hungarian
Pig Populations
1 University of Kaposvár, Faculty of Animal Sciences
Guba Sándor Street 40, H-7400 Kaposvár, Hungary
2 National Institute for Agricultural Quality Control
Keleti Károly Street 24, H-1024 Budapest, Hungary *Corresponding author
Received: February 2, 2004 László CSATÓ1
Agric. conspec. sci. Vol. 69 (2004) No. 4 László CSATÓ, István NAGY, János FARKAS, László RADNÓCZI, Zsófia VÍGH
88
INTRODUCTION
During the last decade genetic evaluation by Best Linear Unbiased Prediction has become the common method for ranking animals in many countries’ breeding programme of various livestock. It has been applied routinely for ten year in most West-European countries (Groeneveld, 1993) but during the recent years several EU member candidate countries (Czech Republic, Estonia, Lithuania, Latvia, Slovak Republic, Slovenia) have also adopted the method in their pig breeding sector (Groeneveld, 2002). Now days, annual genetic trends of 20 grams daily gain, 0.5% lean meat and 0.2 piglet per litter can be realised by most European pig breeding programmes (Merks, 2000).
At present stage in Hungary the BLUP procedure is only being used in the cattle sector officially since 1985, where the animal model was introduced in 1999. In the Hungarian pig-breeding sector the BLUP procedure is used as an unofficial helping tool and among the various indexes only the one utilises the slaughterhouse data is based on the breeding values predicted by BLUP.
The lack of the exclusive adaptation of the BLUP procedure in the Hungarian pig-breeding sector can be explained by many factors. One of them is the relatively small proportion of artificial insemination, which could be used to connect the herds. In case the herds are closed genetically and still evaluated together then the predicted breeding values and the
! "
#$ %&& '( ) **& * %+
'&+ + ) ),' * )&*
- &%, ( % &+, * ,,,
#$ %+). (% ) (** * (*+
#$ (%( +% ) *+. * ,.(
- (*( (( % ('% * ,,,
- ++* *%. ( % * (*.
/0 )% '' + .%' '(&
/01 %&) & *, ' , .,)
! "2 *! 30 &! '!
#$ * * &+ (*(
+ * %. ')'%
- . * %. &.')
#$ & * %. ('+)
#$ , * %' .(.
- *& * %. (++,
- *+ * %. .)*.
/0 ' * %, *,+
/01 ( * &. (.
!4 *!4 &!04 '!
estimated herd effects are totally confounded which means that evaluations can only be made within herds.
The objective of the study was to evaluate usage of BLUP procedure with respect of the potential lack of connectedness.
MATERIALS AND METHODS
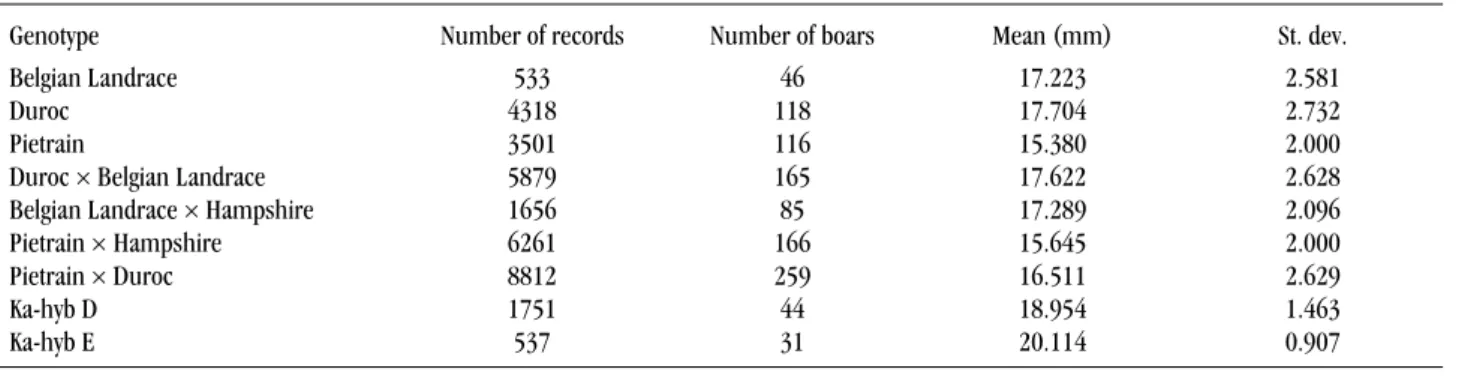
The present investigation was based on field test data collected and owned by the National Institute for Agricultural Quality Control between 1994-1999. The various genotypes took part in the investigations can be seen in table 1.
In the conventional field-test the back fat of the test animals (weighing between 80-110 kg) are measured (table 2).
The heritability of the back fat was estimated in each genotype using the REML method (Groeneveld, 1998).
The following linear model was used:
Average back fat = live weight (Covariate) + year-month (Fixed effect) + sex (Fixed effect) + herd (Fixed effect) + animal (Random effect)
On order to detect genetic connectedness across the herds investigations were made according to Nagy et al. (1999). The applied method was a programme (written in Foxpro) which demonstrates the distribution of the progeny of boars across the herds. By running the software an upper triangular
Table 1. Descriptive statistics for the average backfat depth in various Hungarian pig populations
Agric. conspec. sci. Vol. 69 (2004) No. 4
EXAMINATION OF THE GENETIC CONNECTEDNESS OF VARIOUS HUNGARIAN PIG POPULATIONS
89
*
#$ , *. , ,)!
, *% , ,*!
- , % , ,&! #$ , &) , ,*!
#$ , &) , ,'!
- , &. , ,*!
- , && , ,*!
/0 , *& , ,'!
/01 , * , ,)!
matrix is obtained which describes the characteristics of the use of the boars within and across the herds. The numbers in the diagonal elements give the number of boars used within the herds. The ij-th element of the matrix gives the number of boars whose progeny made records both in flock i and j respectively. Applying the described procedure it was possible to follow the use of the boars within and across the herds.
Based on the average back fat depth values measured in the field test, the breeding values and their predicted error variances (PEV) were estimated for all boars using PEST (Groeneveld, 1990). The sire model and the direct Sparse Matrix Package (smp) solver (which performs a Cholesky factorisation on a re-ordered system of equations then performs a backward substitution) were used.
Prediction Error Variance (PEV) could be regarded as the fraction of additive genetic variance not accounted for by prediction (Mrode, 1996).
PEV = (1-r2)σ2a
Where r2 = squared correlation between the true and predicted breeding value, σ2a = additive genetic variance. The reliability of the breeding value increases with the decreasing value of its PEV. The estimated PEV values for those boars used within and across herds were separately averaged.
RESULTS
The back fat depth heritability estimates of the examined genotypes (table 3.) varied substantially (0.12-0.51). However they range within the interval (0.12-0.88) found in literature (Willms et al., 1998; Bidanel at al., 1994; Li and Kennedy, 1994; Clutter and Brascamp, 1998; Váradi et al., 1997; Wolf et al., 2001; Pescovicova et al., 2002)
The use of boars within and across the herds is presented in table 4. The genetic connections for every genotype are given as the ratio of the actual and possible number of pair-wise connection between the herds.
It is apparent that there is no genetic connectedness exists across the Belgian Landrace herds. This phenomenon is unfortunate from the aspect of the genetic evaluation as the predicted breeding values and the estimated herd effects are totally confounded. In this case theoretically ranking of boars across the herds is not possible. The lack of connectedness could also be observed in the D line of the Ka-Hyb hybrid pig and the consequences are the same as previously. For the other genotypes the degree of the genetic connectedness was low.
Nagy et al. (1999) found 11.7% (pair wise) connectedness across the Hungarian Merino flocks, which value was
Table 3. Heritability estimates with standard errors (in brackets) for the average backfat depth in various Hungarian pig populations
Table 4. Degree of connectedness among different herds in various Hungarian pig populations
6
20 5 7!
#$ ,
' &
#$ ( '
#$
- ( &
- ' *
/0 ,
/01 ( (
similar to that of reported here. Nevertheless it has to be noted that there is neither a clear view about the ideal degree of genetic connectedness nor even about the unit of its measurement.
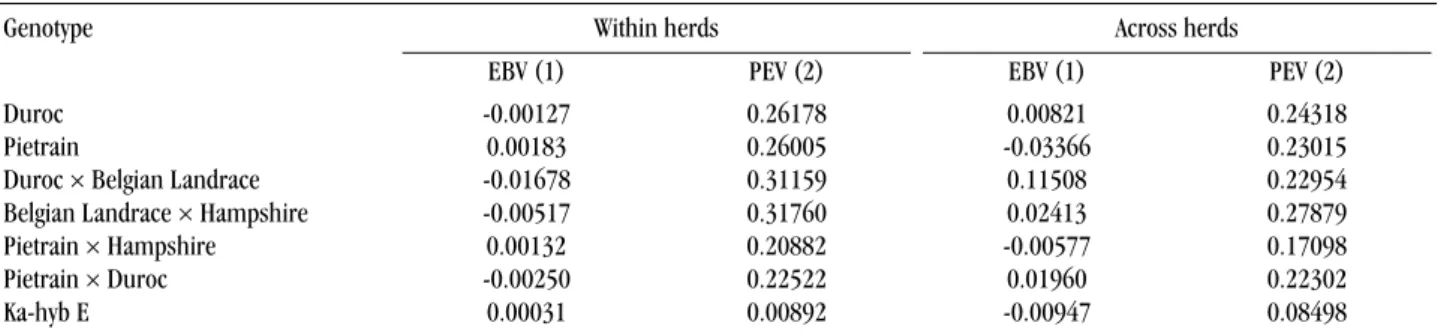
Viewing the results in table 5 it was very surprising that in several genotypes the breeding values of those boars established genetic connectedness across the herds (i.e. they were used at least in two herds) were worse than that of those boars used only within herds. The degree of genetic connectedness across the herds should be increased based on those boars show the highest breeding values (Sorensen, 1988). Increasing the genetic connectedness based on those boars, which presently used in more than one herd it is very unlikely that genetic gain could be increased. However as already been noted in Hungary the ranking of the boars is done according to their conventional index score rather on their predicted breeding values.
Agric. conspec. sci. Vol. 69 (2004) No. 4 László CSATÓ, István NAGY, János FARKAS, László RADNÓCZI, Zsófia VÍGH
90
This finding is in accordance with the results of Analla et al. (1995), Kennedy and Trus (1993), Nagy et al. (2001).
A lthough increasing the degree of genetic connectedness increases the reliability of the predicted breeding value, it can also cause the decrease of genetic variability (Laloë et al., 1996). Nevertheless the degree of the genetic connectedness in the Hungarian pig-breeding sector is low therefore it is very unlikely that increasing the genetic connectedness would shrink the genetic gain.
CONCLUSIONS
The individuals of the examined genotypes can be evaluated across the herds (except the Belgian Landrace and Ka-Hyb D line) because the populations are not closed genetically. The BLUP procedure should eventually replace the conventional index scores, and the boars with the highest (BLUP) breeding values should be used across the herds as it would have advantageous effects both from the aspect of genetic gain and from the aspect of genetic connectedness.
REFERENCES
Analla M.; Sanchez Palma A.; Müosz Serrano A.; Serradilla J. M. (1995): Simulation analysis with BLUP methodology of different data structures in goat selection schemes in Spain. Small Rum. Res. 17, 51-55.
Bidanel J. P.; Ducos A.; Labroue F.; Guéblez R.; Gasnier C. (1994): Genetic parameters of backfat thickness, age at 100 kg and meat quality traits in Pietrain pigs. Ann. Zoo-tech. 43, 141-149.
Clutter A. C.; Brascamp E. W. (1998): Performance traits. In: The Genetics of the pig. (Ed.) Rothschild, M. F.; Ruvinsky, A. CAB International, Wallingford, Oxon, UK. 634. Groeneveld E. (1990) PEST Users’ Manual. Institute of Animal
Husbandry and Animal Behaviour Federal Research Centre, Neustadt. 1-80.
Groeneveld E. (1993): Application of Mixed Linear Models in the Prediction of Genetic Merit in Pigs. Federal Research Centre for Agriculture, Mariensee, Germany 1-107.
Groeneveld E. (1998): VCE4 Users’ Guide. Institute of Animal Husbandry and Animal Behaviour Federal Research Centre, Neustadt. 1-61.
Groeneveld E. (2002): International workshop on genetic evaluation of pigs. Nitra, Slovak Republic.
Kennedy B. W.; Trus, D. (1993): Considerations on genetic connectedness between management units under an animal model. J. Anim. Sci. 1993. 71, 2341–2352 Laloë D.; Phocas F.; Ménissier F. (1996): Considerations
on measures of precision and connectedness in mixed linear models of genetic evaulation. Gen. Sel. Evol. 28, 359–378.
Li X. W.; Kennedy B. W. (1994): Genetic parameters for growth rate and backfat in Canadian Yorkshire, Landrace, Duroc and Hampshire pigs. J. Anim. Sci. 72, 1450-1454. Merks J. W. M. (2000): One century of genetic changes in
pigs and future needs. Occ. Publ. Br. Soc. Anim. Prod. 27, 8-19.
Mrode R. A. (1996): Linear models for the Prediction of Animal Breeding Values. CAB International, Wallingford, Oxon, UK. 187.
Nagy I.; Bálint P.; Komlósi I.; Sáfár L. (1999): Magyar merinó állományok közötti genetikai kapcsolat vizsgálata. Acta Agraria Kaposvariensis 3, 15-23.
Nagy I.; Tormod A.; Komlósi I.; Bálint P. (2001): Choosing a method for measuring genetic relation. Állattenyésztés és takarmányozás, 50, 4. 289-297.
Pescovicova D.; Wolf J.; Groeneveld E.; Wolfowa M. (2002): Simultaneous estimation of the covariance structure of traits from field tests, station test and litter recording in pigs. Livest. Prod. Sci. 77, 155-165.
Sorensen D. (1988): Effect of Selection Index Versus Mixed Model Methods of Prediction of Breeding Value on Response to Selection in a Simulated Pig Population. Livest. Prod. Sci. 20, 135-148.
Váradi G.; Bartos A.; Pozsgai É. 1997. The inheritance of sig-nificant quantitative characteristics of Hungarian Large White and Duroc pigs. Állattenyésztés és Takarmányozás. 46, 227-236.
Wilms F.; Röhe R.; Timm H. H.; Kalm E. (1998): Schätzung genetischer Parameter für die Mutterlinien Large White und Landrasse unter Berücksichtigung unterschidlichen Prüfumwelten. Züctungskunde. 70, 338-350.
Wolf J.; Pescovicova D.; Groeneveld E. (2001): Stability of genetic parameter estimates for production traits in pigs. J. Anim. Breed. Genet. 118, 161-172.
Table 5. Comparison of average breeding values and average prediction error variances of boars that were used only within or across herds in various Hungarian pig populations
B E
1#F ! -1F *! 1#F ! -1F *! 0, ,,*) , *()+ , ,,+* , *'&+ - , ,,+& , *(,,% 0, ,&&(( , *&,% #$ 0, ,()+ , &%. , %,+ , **.%'
#$ 0, ,,%) , &)(, , ,*'& , *)+).
- , ,,&* , *,++* 0, ,,%)) , ),.+
- 0, ,,*%, , **%** , ,.(, , **&,*
/01 , ,,,& , ,,+.* 0, ,,.') , ,+'.+ !-4