ACPD
9, 21011–21039, 2009Extreme ozone over Cotonou in December 2005
A. Minga et al.
Title Page
Abstract Introduction
Conclusions References
Tables Figures
◭ ◮
◭ ◮
Back Close
Full Screen / Esc
Printer-friendly Version
Interactive Discussion
Atmos. Chem. Phys. Discuss., 9, 21011–21039, 2009 www.atmos-chem-phys-discuss.net/9/21011/2009/ © Author(s) 2009. This work is distributed under the Creative Commons Attribution 3.0 License.
Atmospheric Chemistry and Physics Discussions
This discussion paper is/has been under review for the journalAtmospheric Chemistry and Physics (ACP). Please refer to the corresponding final paper inACPif available.
What caused extreme ozone
concentrations over Cotonou in
December 2005?
A. Minga1,2,3, V. Thouret1,2, M. Saunois1,2, C. Delon1,2, D. Serc¸a1,2, C. Mari1,2, B. Sauvage1,2, A. Mariscal1,2,*, M. Leriche1,2, and B. Cros1,2
1
Universit ´e de Toulouse, UPS, LA (Laboratoire d’A ´erologie), 14 avenue Edouard Belin, 31400, Toulouse, France
2
CNRS, LA (Laboratoire d’A ´erologie), 31400 Toulouse, France
3
Facult ´e des Sciences, Universit ´e Marien NGouabi, BP 2702 Brazzaville, Congo
*
now at: LGIT (Laboratoire de G ´eophysique Interne et Technophysique) , BP 53, 38 041 Grenoble, Cedex 09, France
Received: 28 July 2009 – Accepted: 21 September 2009 – Published: 6 October 2009 Correspondence to: V. Thouret ([email protected])
ACPD
9, 21011–21039, 2009Extreme ozone over Cotonou in December 2005
A. Minga et al.
Title Page
Abstract Introduction
Conclusions References
Tables Figures
◭ ◮
◭ ◮
Back Close
Full Screen / Esc
Printer-friendly Version
Interactive Discussion
Abstract
This paper reports the first record of extreme ozone measurement in Africa. As part of the AMMA program, the ozone vertical profile recorded on 20 December over Cotonou presents exceptionally high ozone concentrations with up to 295 ppbv at 1 km altitude. Retroplumes from the Flexpart model show that the air masses sampled at 1 km over
5
Cotonou on this day come from the burning area situated north-east of Cotonou and pass over Lagos, Nigeria, which is highly impacted by urban pollution. We used the Master Mechanism box model to simulate the chemical composition of the plume dur-ing its transit.
We find that neither the biomass burning emissions of ozone precursors nor
ad-10
ditional urban emissions from Lagos are high enough to simulate more than 120– 150 ppbv of ozone. The only way to reach almost 300 ppb of ozone within a few hours is to feed the air mass with large amounts of reactive VOCs as those recorded in the vicinity of petrochemical area. Sensitivity tests show that 250–600 ppbv of VOCs com-bined with 35–80 ppb of NOxallow the ozone concentrations to be higher than 250 ppb.
15
Nigeria is the first African country with gas extraction and petrochemical industries, and petrochemical explosions frequently happen in the vicinity of Lagos. The hypothesis of a petrochemical explosion in this area is the most likely scenario which explains the 295 ppbv ozone maximum measured over Cotonou, downwind of Lagos.
1 Introduction
20
Tropospheric ozone is an important trace gas regarding its role in the oxidative capacity of the global atmosphere, its climate effect and its impact on air quality. Two main rea-sons make the tropical regions of interest regarding tropospheric ozone. Firstly, pho-tochemistry and OH formation are more active in the tropics due to high UV radiation and humidity. Secondly, the tropics are important source regions of ozone precursors,
25
ACPD
9, 21011–21039, 2009Extreme ozone over Cotonou in December 2005
A. Minga et al.
Title Page
Abstract Introduction
Conclusions References
Tables Figures
◭ ◮
◭ ◮
Back Close
Full Screen / Esc
Printer-friendly Version
Interactive Discussion
2006), biogenic (Guenther et al., 1995, 2006; Serc¸a et al., 1998; Jaegl ´e et al., 2004, 2005; Aghedo et al., 2007) and lightning emissions (Moxim and Levy, 2000; Sauvage et al., 2007; H ¨oller et al., 2009). In addition, some of the biggest cities in the world are situated in tropical regions (e.g. Lagos, Mexico city, Bangkok, Bombay, etc.). These cities are subject to increasing anthropogenic emissions and suffer air quality
prob-5
lems. Air quality in the megacities is quite recent issue in our scientific field. Lawrence et al. (2007) emphasized the role of megacities in controlling the pollution at regional scales. Butler et al. (2008) questioned the representation of the megacities emissions in global models and pointed out large differences between available inventories.
Several African campaigns from TROPOZ in 1987 to TRACE-A and SAFARI in 1992
10
and SAFARI in 2000 have highlighted the importance of the tropical region, and par-ticularly Africa, as a source region of ozone precursors (e.g., Cros et al., 1992, 2000; Delmas et al., 1999; Jonqui `ere et al., 1998; Jacob et al., 1996; Thompson et al., 1996; Swap et al., 2003). However, these programs did not specifically address air quality issues in African cities. Few studies were dedicated to this issue in Sub-Saharan cities.
15
For example, Baumbach et al. (1995); Fanou et al. (2006); Linden et al. (2008) show exposure situations that exceed World Heath Organization (WHO) standards in Lagos (Nigeria), Cotonou (Benin) and Ouagadougou (Burkina Faso), respectively. More re-cently, the African Monsoon Multidisciplinary Analysis (AMMA) program is aimed at documenting the chemical composition of the West African atmosphere and its
varia-20
tions linked to dynamics and climate. Indeed, Hopkins et al. (2009) presented a first analysis of in situ data recorded over the city of Lagos during an aircraft flight dedicated to anthropogenic pollution. In the frame of AMMA, an ozone sounding station was set up in Cotonou, Benin (6.21◦N, 2.23◦E) thanks to the IRD (Institut de Recherche et
D ´eveloppement) and the SMN/ASECNA (Service M ´et ´eorologique National/Agence de
25
ACPD
9, 21011–21039, 2009Extreme ozone over Cotonou in December 2005
A. Minga et al.
Title Page
Abstract Introduction
Conclusions References
Tables Figures
◭ ◮
◭ ◮
Back Close
Full Screen / Esc
Printer-friendly Version
Interactive Discussion
characterized by very high ozone concentrations throughout the troposphere compared to the rest of the sampled period (December 2004–January 2007). Also, the vertical profile obtained on 20 December 2005 that they presented shows exceptionally high ozone concentrations in the lower troposphere. Ozone concentrations almost reached 300 ppb at around 1000 m altitude on this day. As far as we know, such extreme
con-5
centrations have never been recorded in the lower troposphere over Africa before. The highest ozone concentration ever reported in the literature has been measured in the metropolitan area of Mexico city with more than 300 ppb (West et al., 2004). Similar concentrations have also been recorded in pollution plumes originating from Beijing (286 ppbv, Wang et al., 2006), from Houston (238–251 ppbv, Berkowitz et al., 2004,
10
Kleinman et al., 2002), from Mexico city (243–250 ppbv, deFoy et al., 2005; Tie et al., 2007; Molina et al., 2007) and from the Po valley in Italy (200 ppbv, Spirig et al., 2002). The lack of measurements dedicated to air quality or pollution episodes did not allow the exploration of such phenomenon in Africa. We report here the first extreme values of ozone concentrations ever measured in this Sub-Saharan region.
15
The objectives of this paper are to present the extreme ozone concentrations recorded on 20 December 2005 in the lower troposphere and to propose an hypothetic scenario, which explains how near 300 ppbv concentrations of ozone can be produced in the vicinity of Cotonou. The radiosounding data and the synoptic situation in Decem-ber 2005 are presented in Sect. 2. The ozone anomaly is further detailed in Sect. 3.
20
ACPD
9, 21011–21039, 2009Extreme ozone over Cotonou in December 2005
A. Minga et al.
Title Page
Abstract Introduction
Conclusions References
Tables Figures
◭ ◮
◭ ◮
Back Close
Full Screen / Esc
Printer-friendly Version
Interactive Discussion
2 Data presentation and meteorological situation
2.1 Data acquisition
Three soundings have been launched in December 2005 (16th, 20th and 22nd around 10:00 UTC). The ozone measurements were made with balloon-borne ECC (Electro-chemical Concentration Cell) ozonesondes coupled with a standard radiosonde
includ-5
ing a sensor for relative humidity and temperature. We used the Vaisala manufactured RS80 radiosondes during the entire AMMA period. The air for the ozone measure-ments was sampled with a Science Pump 6A type. Further details on the entire data set along with quality and accuracy of ozone data can be found in Thouret et al. (2009).
2.2 Synoptic situation
10
Cotonou, located on the coast of the Gulf of Guinea is the economic capital of Benin with a population of 1.2 mill. inhabitants (data from 2008). The city is situated 110 km
east of Lagos (6.3◦N, 3.2◦E), which is the economic capital of Nigeria. The location
of these two cities is shown on Fig. 6. Lagos is the most populated city in West Africa and one of the biggest cities in the world, with more than 13 million people over only
15
3577 km2. The biggest power plant of the northern hemisphere part of Africa is situated in Lagos. Also, Lagos hosts around 75% of the commercial and industrial activities of the country (Hopkins et al., communication AMMA), including petrochemical activities. At this time of the year (dry season), ozone vertical profiles over Cotonou and Lagos are characterized by enhanced ozone concentrations (up to 70 or 80 ppb on monthly
20
average) in the Harmattan layer (between 1 and 3 km altitude) due to biomass burning
occuring all over the Soudano Guinean band between 8 and 12◦N (Sauvage et al.,
2005; Thouret et al., 2009).
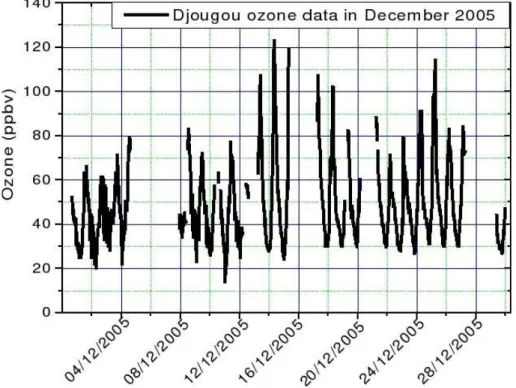
Ozone concentrations were measured at the ground based station of Djougou, about 400 km north of Cotonou as part of the AMMA program. Djougou is in the middle of the
25
ACPD
9, 21011–21039, 2009Extreme ozone over Cotonou in December 2005
A. Minga et al.
Title Page
Abstract Introduction
Conclusions References
Tables Figures
◭ ◮
◭ ◮
Back Close
Full Screen / Esc
Printer-friendly Version
Interactive Discussion
Soudano Guinean region and the measurements made there give typical values of the chemical composition of the air masses impacted by biomass burning during the dry season. Figure 2 gives the time series of ozone concentrations recorded at Djougou in December 2005. Ozone concentrations greater than 100 ppb were measured several days in a row (14, 15, 16, 18, 19 and 26) with peaks at 123 and 120 ppb on the 15 and
5
16, respectively.
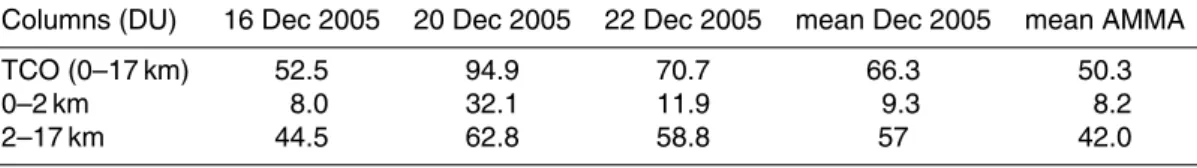
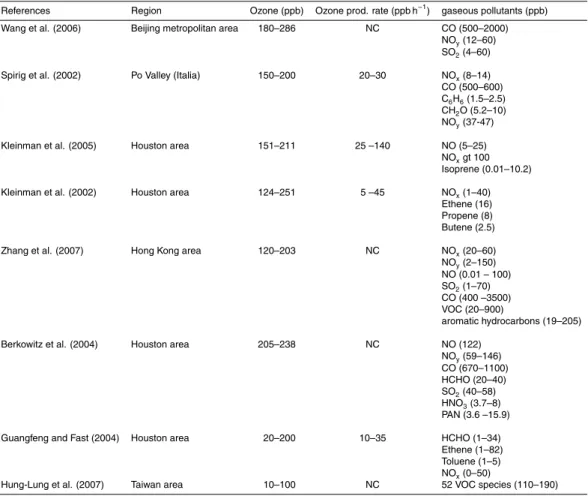
3 Case study of 20 December
Figure 1 presents the three vertical profiles recorded in December 2005 over Cotonou. Only the tropospheric part (up to 17 km) is shown. Based on satellite and ozone sound-ings data, Thouret et al. (2009) has shown that December 2005 is characterized by
rel-10
atively high ozone concentrations throughout the whole troposphere compared to the entire period of December 2004–January 2007. In the middle troposphere, the three profiles show similar ozone concentrations with values around 90 ppb between 6 and 10 km. The two profiles on the 20 and 22 December 2005 are very similar above 2 km and both of them show concentrations close to 70 ppb at the surface. This value is
15
the overall maximum of surface concentrations within the radiosounding data set. The most impressive feature of this figure is the ozone enhanced layer peaking at around 1 km altitude on the profiles of 20 December. This layer is about 1.5 km thick and ozone concentrations are up to almost 300 ppb.
Such high ozone concentrations have never been sampled before in this region. The
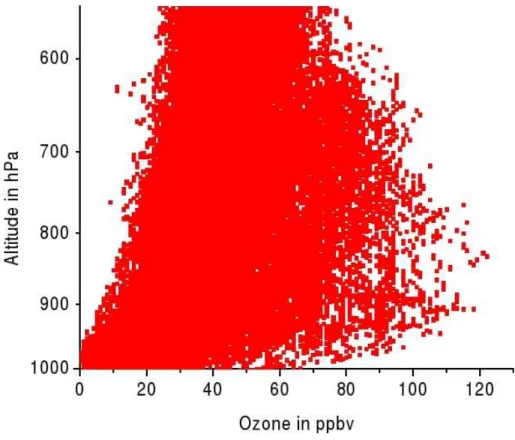
20
MOZAIC program (Marenco et al., 1998, Sauvage et al., 2005) provide quite a large sampling of the ozone distribution over Lagos, Nigeria between 1997 and 2004. Fig-ure 3 gives the scatter plot of all the MOZAIC measFig-urements over Lagos during this period. The ozone concentrations in the MOZAIC data set maximizes at 120 ppb of ozone between 800 and 900 hPa. Concentrations as high as those recorded on 20
De-25
ACPD
9, 21011–21039, 2009Extreme ozone over Cotonou in December 2005
A. Minga et al.
Title Page
Abstract Introduction
Conclusions References
Tables Figures
◭ ◮
◭ ◮
Back Close
Full Screen / Esc
Printer-friendly Version
Interactive Discussion
To better assess how large the discrepancies are on 20 December 2005 compared to other sampled December months, we calculate the tropospheric column of ozone (TCO) as well as the contributions of the 0–2 km and 2–17 km layers. Table 1 gives these ozone amounts in Dobson unit for the three individual ozone profiles of December 2005, the mean of December 2005 and the average of December 2004, December
5
2005 and December 2006. The TCO on 20 December 2005 is almost twice as large as a standard day (16 December 2005 for example). The 0–2 km layer accounts for almost 35% of the TCO on this day and is three to four times larger than usually observed at this altitude showing how exceptional the event is.
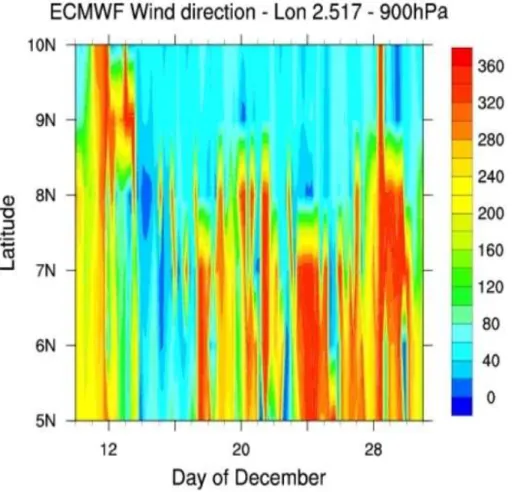
Figures 4 and 5 give the wind direction and speed, respectively at 900 hPa between
10
5 and 10◦N at the longitude of Cotonou for the month of December 2005. Data are
computed from ECMWF analysis. Cotonou is 6.2◦
N latitude. The wind patterns are
different between the 16 and the 20–22 December 2005. Around the 16, the
Harmat-tan flow (wind direction between 30 and 80◦) is well established . On the contrary, on
the 20 and 22 the monsoon flow (wind direction between 120 and 240◦
) still prevails,
15
especially on the 20. Also, the 20 December 2005 as well as the 18 and 19 Decem-ber are characterized by a particularly very slow southeastern wind, less than 1 or 2 m s−1
. This suggests that there can be an accumulation of pollutants in the stagnant air masses in the region of Cotonou and Lagos and indicates that an additional urban source of ozone and ozone precursors from Lagos might interfere and favour ozone
20
photochemical production during the travel between Lagos and Cotonou.
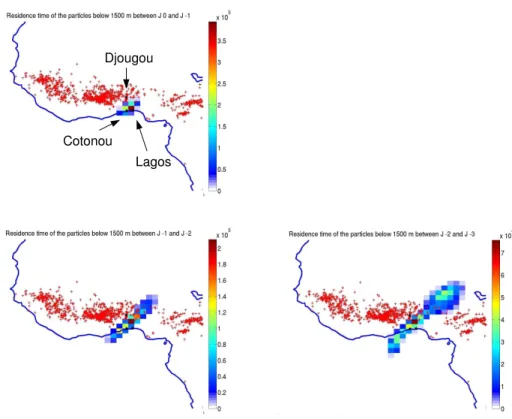
4 Hypothetical scenario
According to back trajectories analysis based on the FLEXPART lagrangian model (Stohl et al., 2005), the air masses in which very high ozone concentrations were mea-sured on 20 December 2005 originate mainly from the northeast (Fig. 6). These air
25
ACPD
9, 21011–21039, 2009Extreme ozone over Cotonou in December 2005
A. Minga et al.
Title Page
Abstract Introduction
Conclusions References
Tables Figures
◭ ◮
◭ ◮
Back Close
Full Screen / Esc
Printer-friendly Version
Interactive Discussion
between Lagos and Cotonou for more than one day (Fig. 6). The wind speed in the vicinity of Cotonou and Lagos was less than 2 m s−1
, meaning that air masses needed around 15 h to travel from Lagos to Cotonou and could be influenced by local pollution from Lagos.
We propose here a scenario that could explain this extreme and rare pollution event.
5
As seen from the literature and from Figs. 3 and 4, ozone concentrations in biomass burning plumes seem to maximize around 120 ppb but not more in West Africa. To produce the additional 180 ppb to reach the 300 ppb, the air mass needs to be fed with fresh NOxand reactive precursors such as volatil organic compounds (VOCs). Table 3
gives a non exhaustive overview of the possible ozone concentrations along with the
10
ozone production rate and the associated gaseous pollutants measured in different ur-ban areas known for episodes of high pollution. For example, ozone concentrations as high as 251 ppbv have been measured over Houston associated with high concentra-tions of ethene, propene and butene.
The Master Mechanism zero-dimensional model (Madronich and Calvert, 1990) has
15
been used to investigate the photochemical production of ozone in the region, one, two or three days before 20 December 2005. The Master Mechanism model consists of a detailed gas phase chemistry, with nearly 5000 reactions between nearly 2000 species. This model computes the time-dependent chemical evolution of an air par-cel initialized with known composition, assuming no additional emissions, no dilution
20
and no heterogeneous processes. This model cannot substitute a full 3-D Chemistry-Transport Model (CTM), but has the advantage of describing explicitly all intermediate chemical transformations (Madronich, 2006), which is necessary to describe such an extreme event. The calculated concentrations are not meant to be the exact values recorded but rather to give an order of magnitude of the ozone amount that can be
25
ACPD
9, 21011–21039, 2009Extreme ozone over Cotonou in December 2005
A. Minga et al.
Title Page
Abstract Introduction
Conclusions References
Tables Figures
◭ ◮
◭ ◮
Back Close
Full Screen / Esc
Printer-friendly Version
Interactive Discussion
value at this time of the year in this region. For the simulations, we have used the time frame resulting from the back trajectories shown in Fig. 6. The air mass travels from the biomass burning area to the vicinity of Lagos during 24 to 48 h and afterwards takes about 15–18 h to reach Cotonou, where high ozone concentrations were measured.
The first run is called ”Biomass Burning” and gives the chemical composition of the
5
air mass after passing over a fire of biomass in West African savanna. Even though we set up the run to last for 42 h (beginning 12:00, end 06:00 LT, 2 days after) to be consistent with the back trajectories analysis (Fig. 6), Fig. 7a shows a 100 h lasting run in order to exhibit the leveling off at 120 ppbv of ozone. This run is initialized according to concentrations that are characteristic of a savanna fire as described by
10
Poppe et al. (1998). Table 2 gives the amount of the total VOCs (which contain ethene, propene, ethane, benzene, propane, acetylene, butane, toluene), NOx (=NO+NO2),
and carbonyl compounds (which contain formaldehyde, acetic acid, acetone and ac-etaldehyde) used for this Biomass Burning run. Figure 7 (top) presents the results from this first run and shows that NOx decreases from 40 ppb to a few ppt after 40 h
15
of simulation. CO concentrations remains constant at 1000 ppbv during the first day, then CO decreases by 20 ppbv per day.The ozone concentrations reach 90 ppb after the first 24 h and 120 ppb after two days which is what we expect to be typical of the biomass burning plumes in agreement with results from Djougou or from MOZAIC-Lagos (Figs. 2 and 3, respectively).
20
The second run is called “Additional Lagos”, and simulates the passing of the air mass already charged in biomass burning compounds over Lagos. It begins at 06:00 UTC local time and lasts for 3 days (72 h). CO and ozone concentrations at the beginning of this second simulation are those calculated in the “Biomass Burning” run after 42 h. Other compounds are re-initialized. Additional fuel from Lagos urban
25
emissions provides fresh VOCs and NOx. We used the concentrations measured over
ACPD
9, 21011–21039, 2009Extreme ozone over Cotonou in December 2005
A. Minga et al.
Title Page
Abstract Introduction
Conclusions References
Tables Figures
◭ ◮
◭ ◮
Back Close
Full Screen / Esc
Printer-friendly Version
Interactive Discussion
run shows that ozone concentrations reach 150 ppb after a few hours (Fig. 7b) and stay around this value for the rest of the simulation. These results show that anthro-pogenic emissions from urban pollution in Lagos is not sufficient to produce enough ozone downwind and explain the near 300 ppbv of ozone as measured in Cotonou.
Several studies have been conducted in the region of Houston, where petrochemical
5
industries emit a large amount of VOCs and NOx in the atmosphere (Kleinman et al.,
2005; Berkowitz et al., 2004; Guangfeng and Fast, 2004), as well as in Asian petro-chemical complexes (Zhang et al., 2004; Hung-Lung et al., 2007). High ozone con-centrations have been measured downwind petrochemical industrial facilities, where
highly elevated concentrations of NOx(much more elevated than in urban zones) and
10
reactive VOCs are simultaneously present (Ryerson et al., 2003). Usual ozone concen-trations in Houston reported in Ryerson et al. (2003) remain half the ones measured in Cotonou the 20 December 2005 though. To simulate similar values as observed on
De-cember 20th over Cotonou, we suggest that an exceptional release of VOCs and NOx
took place near Lagos. A pipeline explosion due to a leak of hydrocarbons would emit
15
large quantities of reactive hydrocarbons and NOx. Such a pipeline explosion actually
occured on the morning of the 20 December 2005 in the vicinity of Port Harcourt in the Niger Delta river. The fire was not completely extinguished until 4 days later. The loss of gas has been estimated to be 7% of the daily production (Agence France Presse, 2006). Thus, it may be not surprising to have such accidents in the city of Lagos.
20
Therefore, we conduct a third run called “Additional petrochemical Accident” which simulates the passing of the air mass already charged in biomass burning over a
hy-pothetical release of VOCs and NOxfrom a petrochemical source. As with the second
run, it begins at 06:00 local time and lasts for 3 days (72 h). This time we feed the biomass burning plume with 200 ppb of extra reactive VOCs and 55 ppb of NOxto
rep-25
resent emissions of petrochemical compounds. Those values are based on different
indus-ACPD
9, 21011–21039, 2009Extreme ozone over Cotonou in December 2005
A. Minga et al.
Title Page
Abstract Introduction
Conclusions References
Tables Figures
◭ ◮
◭ ◮
Back Close
Full Screen / Esc
Printer-friendly Version
Interactive Discussion
tries. As an example, reports on high VOCs emissions are available in Canada (in the region of Montreal), mentioning a probable industrial incident on 20 October 2003,
with total VOCs concentration close to 1000 µg m−3
(http://www.ec.gc.ca/cleanair-airpur/caol/trackingbenzene/p4 f.cfm#journees, in french), and among them, benzene concentrations of 34 ppb (120 µg m−3
). Figure 7c shows the result of this last run.
5
Ozone concentration increases by 170 ppb in∼5 h (around noon local time) and reach
a maximum of 264 ppb. This gives an estimate of the ozone production rate of
34 ppb h−1
, which is in the range of the ozone production rates calculated in the stud-ies referenced in Table 3. The ozone concentration remains higher than 200 ppb for more than 3 days according to the model. The sounding recorded on 22 December
10
2005 shows that ozone concentrations were lower than those on 20 December 2005 down to 65–80 ppb but still higher than the ones recorded on the 16 December 2005 (40–70 ppb) as seen in Fig. 1. Either the sounding on the 22 December 2005 has not sampled the polluted plume or only its edge, or the concentrations have been diluted during these two days, which is not taken into account in the box model.
15
The run “Additional Petrochemical Accident” presented in Fig. 7c uses arbitrary
val-ues. To better assess the amounts of VOCs and NOx that are necessary to produce
ozone concentrations as high as observed on 20 December 2005 over Cotonou, we actually performed 49 sensitivity studies. In these test runs the NOx concentrations
vary from 6 to 78 ppbv and the VOCs amount from 55 to 555 ppb. Figure 8 shows the
20
isopleths of the maximum ozone concentrations reached before the end of the simu-lation as a function of the initial NOx and VOCs amounts. The results of the first two
simulations are recalled on this contour plot as the blue points on the left hand side.
Figure 8 shows that a combination of 250–600 ppbv of VOCs and 35–80 ppb of NOx
are necessary to produce more than 250 ppb of ozone. These ranges of
concentra-25
ACPD
9, 21011–21039, 2009Extreme ozone over Cotonou in December 2005
A. Minga et al.
Title Page
Abstract Introduction
Conclusions References
Tables Figures
◭ ◮
◭ ◮
Back Close
Full Screen / Esc
Printer-friendly Version
Interactive Discussion
5 Conclusions
As part of the AMMA program, ozone soundings over Cotonou were launched be-tween December 2004 and January 2007. In December 2005, particularly high ozone concentrations have been recorded throughout the troposphere (Thouret et al., 2009). This paper focuses on the ozone vertical profile measured on 20 December 2005. This
5
day is characterized by an exceptional ozone enhanced layer peaking at around 1 km altitude. This layer is about 1.5 km thick and ozone concentrations are up to almost 300 ppb within it. Such high concentrations were previously reported in China (Wang et al., 2006), in Mexico City (Molina et al., 2007) and close to petrochemical industries near Houston in USA (Kleinman et al., 2002, 2005). However such event has never
10
been reported over Africa and we reported here the first one of the region.
We have shown that the 294 ppbv of ozone measured on 20 December 2005 are far higher than the typical ozone concentrations recorded over West Africa provided by the MOZAIC and AMMA programs, which are lower than 120 ppbv. The wind pat-tern indicates that Cotonou is under the influence of the Harmattan flow at this time
15
of the year and that its atmosphere is impacted by biomass burning pollution. We used Flexpart backward trajectories and a photochemical zero-dimensional model to built a scenario that explain how such high ozone concentrations could be produced
in the vicinity of Cotonou. When the biomass burning emissions of VOCs and NOx
are included in the model as initilization, the model simulates only up to 120 ppbv of
20
ozone, which is in agreement with the typical ozone concentrations within biomass burning plumes. Adding urban emissions from the city of Lagos to the plume impacted by biomass burning does increase the ozone level but it remains below 150 ppb. To simulate ozone concentrations close to 300 ppb, we needed to assume that there was
a release of large quantities of VOCs and NOx as in a petrochemical accident. This
25
kind of accident is known to happen frequently in Nigeria and in the vicinity of Lagos.
Including these high emissions of VOCs and NOx in the box model allowed the model
ACPD
9, 21011–21039, 2009Extreme ozone over Cotonou in December 2005
A. Minga et al.
Title Page
Abstract Introduction
Conclusions References
Tables Figures
◭ ◮
◭ ◮
Back Close
Full Screen / Esc
Printer-friendly Version
Interactive Discussion
reach 264 ppbv. Sensitivity tests showed that only 250–600 ppbv of VOCs combined with 35–80 ppb of NOxallow the ozone concentrations to be higher than 250 ppb.
Unfortunately, we did not find any proof of such petrochemical accident in the area of Lagos during this period (16–19 December 2005) using satellite data or daily news. However, this scenario is the most likely one. Such event has been probably very
5
limited in time and space but it should be remembered in future studies regarding air quality issue in this region as a non negligeable source of ozone and its impact.
Acknowledgements. Based on a French initiative, AMMA was built by an international scien-tific group and is currently funded by a large number of agencies, especially from France, the UK, the United States, and Africa. It has been the beneficiary of a major financial
con-10
tribution from the European Communitys Sixth Framework Research Programme. Detailed information on scientific coordination and funding is available on the AMMA International Web site at www.amma-international.org. Besides, authors warmly thank all the people from IRD based in Cotonou for their help before, during and after this sounding operation, as well as Mrs F. Did ´e, A. Solete and D. Agbangla from SMN/ASECNA. Finally, collaborations with Mrs
15
A. Akpo, E. Houngninou and B. Kounouhewa from the University of Abomey-Calavi have been really appreciated.
The publication of this article is financed by CNRS-INSU.
20
References
ACPD
9, 21011–21039, 2009Extreme ozone over Cotonou in December 2005
A. Minga et al.
Title Page
Abstract Introduction
Conclusions References
Tables Figures
◭ ◮
◭ ◮
Back Close
Full Screen / Esc
Printer-friendly Version
Interactive Discussion
http://www.atmos-chem-phys.net/7/1193/2007/. 21013
Andreae, M. and Merlet, P.: Emission of trace gases and aerosols from biomass burning, Global Biogeochem. Cy., 15, 955–966, 2001. 21012
Baumbach, G., Vogt, U., Hein, K., Oluwole, A., Ogunsola, O., Olaniyi, H., and Akeredolu, F.: Air pollution in a large tropical city with a high traffic density – results of measurements in Lagos,
5
Nigeria, Sci. Total Environ., 169, 25–31, doi:10.1016/0048-9697(95)04629-F, 1995. 21013 Berkowitz, C. M., Jobson, T., Jiang, G., Spicer, C. W., and Doskey, P. V.: Chemical and
meteoro-logical characteristics associated with rapid increases of O3in Houston, Texas, J. Geophys. Res., 109, D10307, doi:10.1029/2003JD004141, 2004. 21014, 21020
Butler, T. M., Taraborrelli, D., Br ¨uhl, C., Fischer, H., Harder, H., Martinez, M., Williams, J.,
10
Lawrence, M. G., and Lelieveld, J.: Improved simulation of isoprene oxidation chemistry with the ECHAM5/MESSy chemistry-climate model: lessons from the GABRIEL airborne field campaign, Atmos. Chem. Phys., 8, 4529–4546, 2008,
http://www.atmos-chem-phys.net/8/4529/2008/. 21013
Cros, B., Fontan, J., Minga, A., Helas, G., Nganga, D., Delmas, R., Chapuis, A., Benech, B.,
15
Druilhet, A., and Andrea, M.: Vertical profiles of ozone between 0 and 400 m in and above an African Equatorial forest, J. Geophys. Res., 97, 12877–12877, 1992. 21013
Cros, B., Delon, C., Affre, C., Marion, T., Druilhet, A., Perros, P., and Lopez, A.: Sources and sinks of ozone in savanna forest areas during EXPRESSO: Airborne turbulent flux measure-ments, J. Geophys. Res., 105, 29347–29358, 2000. 21013
20
Delmas, R. A. and others: Experiment for Regional Sources and Sinks of Oxidants (EX-PRESSO): An overview, J. Geophys. Res., 104, 30609–30624, 1999. 21013
de Foy, B., Caetano, E., Maga ˜na, V., Zit ´acuaro, A., C ´ardenas, B., Retama, A., Ramos, R., Molina, L. T., and Molina, M. J.: Mexico City basin wind circulation during the MCMA-2003 field campaign, Atmos. Chem. Phys., 5, 2267–2288, 2005,
25
http://www.atmos-chem-phys.net/5/2267/2005/. 21014
Fanou, L., Mobio, T., Creppy, E., Fayomi, B., Fustoni, S., Moller, P., Kyrtopoulos, S., Geor-giades, P., Loft, S., Sanni, A., Skov, H., Ovrebo, S., and Autrup, H.: Survey of air pollu-tion in Cotonou, Benin – air monitoring and biomarkers, Sci. Total Environ., 358, 85–96, doi:10.1016/j.scitotenv.2005.03.025, 2006. 21013
30
ACPD
9, 21011–21039, 2009Extreme ozone over Cotonou in December 2005
A. Minga et al.
Title Page
Abstract Introduction
Conclusions References
Tables Figures
◭ ◮
◭ ◮
Back Close
Full Screen / Esc
Printer-friendly Version
Interactive Discussion
Guenther, A., Karl, T., Harley, P., Wiedinmyer, C., Palmer, P. I., and Geron, C.: Estimates of global terrestrial isoprene emissions using MEGAN (Model of Emissions of Gases and Aerosols from Nature), Atmos. Chem. Phys., 6, 3181–3210, 2006,
http://www.atmos-chem-phys.net/6/3181/2006/. 21013
Guenther, A., Hewitt, C. N., Erickson, D., Fall, R., Geron, C., Graedel, T., Harley, P., Klinger, L.,
5
Lerdau, M., McKay, W. A., Pierce, T., Scholes, B., Steinbrecher, R., Tallamraju, R., Taylor, J., and Zimmerman, P.: A global model of natural volatile organic compound emissions, J. Geo-phys. Res., 100, 8873–8892, 1995. 21013
H ¨oller, H., Betz, H.-D., Schmidt, K., Calheiros, R. V., May, P., Houngninou, E., and Scialom, G.: Lightning characteristics observed by a VLF/LF lightning detection network (LINET) in Brazil,
10
Australia, Africa and Germany, Atmos. Chem. Phys. Discuss., 9, 6061–6146, 2009, http://www.atmos-chem-phys-discuss.net/9/6061/2009/. 21013
Hopkins, J. R., Evans, M. J., Lee, J. D., Lewis, A. C., Marsham, J. H., McQuaid, J. B., Parker, D. J., Stewart, D. J., Reeves, C. E., and Purvis, R. M.: Direct estimates of emis-sions from the megacity of Lagos, Atmos. Chem. Phys. Discuss., 9, 8667–8682, 2009,
15
http://www.atmos-chem-phys-discuss.net/9/8667/2009/. 21013, 21019, 21030
Hung-Lung, C., Jiun-Horng, T., Shih-Yu, C., Kuo-Hsiung, L., and Sen-Yi, M.: VOC concentration profiles in an ozone non-attainment area: A case study in an urban and industrial complex metroplex in southern Taiwan, Atmos. Environ., 41(9), 1848–1860, 2007. 21020
Jacob, D. J., Heikes, E.G.,Fan, S.-M., Logan, J. A., et al.: Origin of ozone and NOxin the tropical
20
troposphere: A photochemical analysis of aircraft observations over the South Atlantic basin, J. Geophys. Res., 101(D19), 23889–23907, 1996. 21013
Jaegl ´e, L., Martin, R., Chance, K., Steinberger, L., Kurosu, T., Jacob, D., Modi, A., Yobou ´e, V., Sigha-Nkamdjou, L., and Galy-Lacaux, C.: Satellite mapping of rain-induced nitric oxide emissions from soils, J. Geophys. Res., 109, D21310, doi:10.1029/2004JD004787, 2004.
25
21013
Jaegl ´e, L., Steinberger, L., Martin, R., and Chance, K.: Global partitionning of NOx sources using satellite observations: relative roles of fossil fuel combustion, biomass burning and soils emissions, Faraday Discuss., 130, 1–17, 2005. 21013
Janicot, S., Thorncroft, C. D., Ali, A., et al.: Large-scale overview of the summer monsoon over
30
West during the AMMA field experiment in 2006, Ann. Geophys., 26, 2569–2595, 2008, http://www.ann-geophys.net/26/2569/2008/.
transat-ACPD
9, 21011–21039, 2009Extreme ozone over Cotonou in December 2005
A. Minga et al.
Title Page
Abstract Introduction
Conclusions References
Tables Figures
◭ ◮
◭ ◮
Back Close
Full Screen / Esc
Printer-friendly Version
Interactive Discussion
lantic transport from biomass burning emissions over West Africa during the airborne Tro-pospheric Ozone Campaigns TROPOZ I and TROPOZ II, J. Geophys. Res., 103, 19059– 19073, 1998. 21013
Kleinman, L. I., Daum, P. H., Imre, D., Lee, Y.-N., Nunnermacker, L. J., Springston, S. R., Weinstein-Lloyd, J., and Rudolph, J.: Ozone production rate and hydrocarbon reactivity in 5
5
urban areas: A cause of high ozone concentration in Houston, Geophys. Res. Lett., 29(10), 1467, doi:10.1029/2001GL014569, 2002. 21014, 21022
Kleinman, L. I., Daum, P. H., Lee, Y.-N., Nunnermacker, L. J., Springston, S. R., Weinstein-Lloyd, J., and Rudolph, J.: A comparative study of ozone production in five US metropolitan areas, J. Geophys. Res., 110, D02301, doi:10.1029/2004JD005096, 2005. 21020, 21022
10
Lawrence, M. G., Butler, T. M., Steinkamp, J., Gurjar, B. R., and Lelieveld, J.: Regional pollution potentials of megacities and other major population centers, Atmos. Chem. Phys., 7, 3969– 3987, 2007,
http://www.atmos-chem-phys.net/7/3969/2007/. 21013
Linden, J., Thorsson, S., and Eliasson, I.: Carbon Monoxide in Ouagadougou, Burkina Faso –
15
A comparison between urban background, roadside and in-traffic measurements, Water Air Soil Poll., 188, 345–353, doi:10.1007/s11270-007-9538-2, 2008. 21013
Madronich, S. and Calvert, J. G.: Permutation reactions of organic peroxy radicals in the tropo-sphere, J. Geophys. Res., 95, 5697–5715, 1990. 21018, 21030
Madronich, S.: Chemical evolution of gaseous air pollutants down-wind of tropical megacities:
20
Mexico City case study, Atmos. Environ., 40, 6012–6018, 2006. 21018
Marenco, A., Thouret, V., N ´ed ´elec, P., Smit, H., Helten, M., Kley, D., Karcher, F., Simon, P., Law, K., Pyle, J., Poschmann, G., Von Wrede, R., Hume, C., and Cook, T.: Measurement of ozone and water vapor by airbus in-service aircraft: The MOZAIC airborne program, An Overview, J. Geophys. Res., 103, 25631–25642, 1998. 21016
25
Molina, L. T., Kolb, C. E., de Foy, B., Lamb, B. K., Brune, W. H., Jimenez, J. L., Ramos-Villegas, R., Sarmiento, J., Paramo-Figueroa, V. H., Cardenas, B., Gutierrez-Avedoy, V., and Molina, M. J.: Air quality in North America’s most populous city – overview of the MCMA-2003 campaign, Atmos. Chem. Phys., 7, 2447–2473, 2007,
http://www.atmos-chem-phys.net/7/2447/2007/. 21014, 21022
30
ACPD
9, 21011–21039, 2009Extreme ozone over Cotonou in December 2005
A. Minga et al.
Title Page
Abstract Introduction
Conclusions References
Tables Figures
◭ ◮
◭ ◮
Back Close
Full Screen / Esc
Printer-friendly Version
Interactive Discussion
Poppe, D., Koppmann, R., and Rudolph, J.: Ozone formation in biomass burning plume: Influ-ence of atmospheric dilution, Geophys. Res. Lett., 25, 3823–3826, 1998. 21019, 21030 Ryerson, T. B., Trainer, M., Angevine, W. M., Brock, C. A., et al.: Effect of petrochemical
in-dustrial emissions of reactive alkenes and NOxon tropospheric ozone formation in Houston, Texas, J. Geophys. Res., 108(D8), 4249, doi:10.1029/2002JD003070, 2003. 21020
5
Sauvage, B., Thouret, V., Cammas, J.-P., Gheusi, F., Athier, G., and N ´ed ´elec, P.: Tropospheric ozone over Equatorial Africa: regional aspects from the MOZAIC data, Atmos. Chem. Phys., 5, 311–335, 2005,
http://www.atmos-chem-phys.net/5/311/2005/. 21015, 21016, 21017
Sauvage, B., Martin, R. V., van Donkelaar, A., Liu, X., Chance, K., Jaegl ´e, L., Palmer, P. I.,
10
Wu, S., and Fu, T.-M.: Remote sensed and in situ constraints on processes affecting tropical tropospheric ozone, Atmos. Chem. Phys., 7, 815–838, 2007,
http://www.atmos-chem-phys.net/7/815/2007/. 21013
Serc¸a, D., Delmas, R., Le Roux, X., Parsons, D. A. B., Scholes, M. C., Abbadie, L., Lensi, R., Ronce, O., and Labroue, L.: Comparison of nitrogen monoxide emissions from several
15
African tropical ecosystems and influence of season and fire, Global Biogeochem. Cy., 12, 637–651, 1998. 21013
Spirig, C., Neftel, A., Kleinman, L. I., and Hjorth, J.: NOx versus VOC limitation of O3 produc-tion in the Po valley: Local and integrated view based on observaproduc-tions, J. Geophys. Res., 107(D22), 8191, doi:10.1029/2001JD000561, 2002. 21014
20
Stohl, A., Forster, C., Frank, A., Seibert, P., and Wotawa, G.: Technical note: The Lagrangian particle dispersion model FLEXPART version 6.2, Atmos. Chem. Phys., 5, 2461–2474, 2005, http://www.atmos-chem-phys.net/5/2461/2005/. 21017
Swap, R. J., Suttles, J. T., King, M. D., Platnick, S., Privette, J. L., and Scholes, R. J.: Africa burning: A thematic analysis of the Southern African Regional Science Initiative (SAFARI
25
2000), J. Geophys. Res., 108(D13), 8465, doi:10.1029/2003JD003747, 2003. 21013
Thouret, V., Saunois, M., Minga, A., Mariscal, A., Sauvage, B., Solete, A., Agbangla, D., N ´ed ´elec, P., Mari, C., Reeves, C. E., and Schlager, H.: Two years of Ozone radio sound-ings over Cotonou as part of AMMA: overview, Atmos. Chem. Phys., 9, 6157–6174, 2009, http://www.atmos-chem-phys.net/9/6157/2009/. 21013, 21015, 21016, 21022
30
ACPD
9, 21011–21039, 2009Extreme ozone over Cotonou in December 2005
A. Minga et al.
Title Page
Abstract Introduction
Conclusions References
Tables Figures
◭ ◮
◭ ◮
Back Close
Full Screen / Esc
Printer-friendly Version
Interactive Discussion
1996 21013
Tie, X., Madronich, S., Li, G., Ying, Z., Zhang, R., Garcia, A. R., Lee-Taylor, J., and Liu, Y.: Characterizations of chemical oxidants in Mexico City: A regional chemical dynamical model (WRF-Chem) study, Atmos. Environ., 41, 1989–2008, 2007. 21014
van der Werf, G. R., Randerson, J. T., Giglio, L., Collatz, G. J., Kasibhatla, P. S., and Arellano
5
Jr., A. F.: Interannual variability in global biomass burning emissions from 1997 to 2004, Atmos. Chem. Phys., 6, 3423–3441, 2006,
http://www.atmos-chem-phys.net/6/3423/2006/. 21012
Wang, T., Ding, A., Gao, J., and Wu, W. S.: Strong ozone production in urban plumes from Beijing, China, Geophys. Res. Lett., 33, L21806, doi:10.1029/2006GL027689, 2006. 21014,
10
21022
West, J. J., Zavala, M. A., Molina, L. T., Molina, M. J., F. San Martini, McRae, G. J., Sosa– Iglesias, G., and Arriaga–Colina, J. L.: Modeling ozone photochemistry and evaluation of hydrocarbon emissions in the Mexico City metropolitan area, J. Geophy. Res., 109, D19312, doi:10.1029/2004jd004614, 2004. 21014
15
ACPD
9, 21011–21039, 2009Extreme ozone over Cotonou in December 2005
A. Minga et al.
Title Page
Abstract Introduction
Conclusions References
Tables Figures
◭ ◮
◭ ◮
Back Close
Full Screen / Esc
Printer-friendly Version
Interactive Discussion
Table 1. Tropospheric columns of ozone from the surface up to 17 km and contributions of the
0–2 km and 2–17 km layers in Dobson Unit. These ozone amounts are calculated for the three individual soundings of December 2005 (16, 20, 22), the mean vertical profile of December 2005 and the mean vertical profile of December from years 2004, 2005 and 2006 (called mean AMMA).
Columns (DU) 16 Dec 2005 20 Dec 2005 22 Dec 2005 mean Dec 2005 mean AMMA
TCO (0–17 km) 52.5 94.9 70.7 66.3 50.3
0–2 km 8.0 32.1 11.9 9.3 8.2
ACPD
9, 21011–21039, 2009Extreme ozone over Cotonou in December 2005
A. Minga et al.
Title Page
Abstract Introduction
Conclusions References
Tables Figures
◭ ◮
◭ ◮
Back Close
Full Screen / Esc
Printer-friendly Version
Interactive Discussion
Table 2. Ozone precursors concentrations used to initialized the three runs (Biomass burning,
Additional Lagos and Additional petrochemical accident) performed with the Master Mechanism box model (Madronich and Calvert, 1990).
Compounds (ppb) Biomass burninga Additional Lagosb Additional petrochemical accidentc
Total COV 36.55 6.9 200–600
NOx(Nitrogen oxide) 40 6 55–80
CH4(methane) 1981
CO (carbon monoxyde) 1000
SO2(sulfur dioxide) 5 10
NH3(ammoniac) 5 10
Carbonyl compounds 2 10.1 40
a
taken from Poppe et al. (1998)
b
taken from Hopkins et al. (2009)
c
ACPD
9, 21011–21039, 2009Extreme ozone over Cotonou in December 2005
A. Minga et al.
Title Page
Abstract Introduction
Conclusions References
Tables Figures
◭ ◮
◭ ◮
Back Close
Full Screen / Esc
Printer-friendly Version
Interactive Discussion
Table 3. Non-exhaustive list of studies reporting events of high ozone concentrations. The
ozone concentrations and production rates as well as the concentrations of some ozone pre-cursors are given.
References Region Ozone (ppb) Ozone prod. rate (ppb h−1) gaseous pollutants (ppb) Wang et al. (2006) Beijing metropolitan area 180–286 NC CO (500–2000)
NOy(12–60) SO2(4–60)
Spirig et al. (2002) Po Valley (Italia) 150–200 20–30 NOx(8–14) CO (500–600) C6H6(1.5–2.5) CH2O (5.2–10) NOy(37-47)
Kleinman et al. (2005) Houston area 151–211 25 –140 NO (5–25) NOxgt 100 Isoprene (0.01–10.2)
Kleinman et al. (2002) Houston area 124–251 5 –45 NOx(1–40) Ethene (16) Propene (8) Butene (2.5)
Zhang et al. (2007) Hong Kong area 120–203 NC NOx(20–60) NOy(2–150) NO (0.01 – 100) SO2(1–70) CO (400 –3500) VOC (20–900)
aromatic hydrocarbons (19–205)
Berkowitz et al. (2004) Houston area 205–238 NC NO (122) NOy(59–146) CO (670–1100) HCHO (20–40) SO2(40–58) HNO3(3.7–8) PAN (3.6 –15.9)
Guangfeng and Fast (2004) Houston area 20–200 10–35 HCHO (1–34) Ethene (1–82) Toluene (1–5) NOx(0–50)
ACPD
9, 21011–21039, 2009Extreme ozone over Cotonou in December 2005
A. Minga et al.
Title Page
Abstract Introduction
Conclusions References
Tables Figures
◭ ◮
◭ ◮
Back Close
Full Screen / Esc
Printer-friendly Version
Interactive Discussion
0 40 80 120 160 200 240 280
0 1 2 3 4 5 6 7 8 9 10 11 12 13 14 15 16 17
Ozone in ppbv
Altitude in km
16/12 20/12 22/12
Fig. 1. Vertical profiles of ozone up to 17 km over Cotonou provided by the three soudings
ACPD
9, 21011–21039, 2009Extreme ozone over Cotonou in December 2005
A. Minga et al.
Title Page
Abstract Introduction
Conclusions References
Tables Figures
◭ ◮
◭ ◮
Back Close
Full Screen / Esc
Printer-friendly Version
Interactive Discussion
Fig. 2. Time evolution of the ozone concentrations measured at the ground based station
ACPD
9, 21011–21039, 2009Extreme ozone over Cotonou in December 2005
A. Minga et al.
Title Page
Abstract Introduction
Conclusions References
Tables Figures
◭ ◮
◭ ◮
Back Close
Full Screen / Esc
Printer-friendly Version
Interactive Discussion
ACPD
9, 21011–21039, 2009Extreme ozone over Cotonou in December 2005
A. Minga et al.
Title Page
Abstract Introduction
Conclusions References
Tables Figures
◭ ◮
◭ ◮
Back Close
Full Screen / Esc
Printer-friendly Version
Interactive Discussion
Fig. 4. Hovmoeller diagram of the wind direction (degrees) at 900 hPa at the longitude of
ACPD
9, 21011–21039, 2009Extreme ozone over Cotonou in December 2005
A. Minga et al.
Title Page
Abstract Introduction
Conclusions References
Tables Figures
◭ ◮
◭ ◮
Back Close
Full Screen / Esc
Printer-friendly Version
Interactive Discussion
Fig. 5. Hovmoeller diagram of the wind speed (m s−1) at 900 hPa at the longitude of Cotonou
ACPD
9, 21011–21039, 2009Extreme ozone over Cotonou in December 2005
A. Minga et al.
Title Page
Abstract Introduction
Conclusions References
Tables Figures
◭ ◮
◭ ◮
Back Close
Full Screen / Esc
Printer-friendly Version
Interactive Discussion
Cotonou
Lagos Djougou
Fig. 6.Retroplumes calculated by the FLEXPART model for the first 24 h (top panel), between
ACPD
9, 21011–21039, 2009Extreme ozone over Cotonou in December 2005
A. Minga et al.
Title Page Abstract Introduction Conclusions References Tables Figures ◭ ◮ ◭ ◮ Back Close
Full Screen / Esc
Printer-friendly Version
Interactive Discussion
0 10 20 30 40 50 60 70 80 90 100
0 20 40 60 80 100 120 140 160
0 10 20 30 40 50 60 70 80 90 100
900 920 940 960 980 1000 1020 1040 1060 O 3 , N O x , in p p b v
Tim e (since the begining of the run) in hours O3 NOx C O i n p p b v CO
0 10 20 30 40 50 60 70
0 20 40 60 80 100 120 140 160
0 10 20 30 40 50 60 70
900 920 940 960 980 1000 1020 1040 1060 O 3 , N O x , in p p b v
Tim e (since the begining of the run) in hours O3 NOx C O i n p p b v CO
0 10 20 30 40 50 60 70
0 40 80 120 160 200 240 280
0 10 20 30 40 50 60 70
920 960 1000 1040 1080 1120 1160 1200 O 3 , N O x , in p p b v
Tim e (since the begining of the run) in hours O3 NOx C O i n p p b v CO (a) (c) (b)
Fig. 7.Time evolution of the ozone (black), CO (blue) and NOx(red) concentrations simulated
ACPD
9, 21011–21039, 2009Extreme ozone over Cotonou in December 2005
A. Minga et al.
Title Page
Abstract Introduction
Conclusions References
Tables Figures
◭ ◮
◭ ◮
Back Close
Full Screen / Esc
Printer-friendly Version
Interactive Discussion
Fig. 8. Isopleths of the ozone concentrations as a function of NOx and VOCs concentrations.