ACPD
14, 2773–2798, 2014Air quality impact of Indonesian biomass burning emissions
G. Engling et al.
Title Page
Abstract Introduction
Conclusions References
Tables Figures
◭ ◮
◭ ◮
Back Close
Full Screen / Esc
Printer-friendly Version Interactive Discussion
Discussion
P
a
per
|
D
iscussion
P
a
per
|
Discussion
P
a
per
|
Discuss
ion
P
a
per
|
Atmos. Chem. Phys. Discuss., 14, 2773–2798, 2014 www.atmos-chem-phys-discuss.net/14/2773/2014/ doi:10.5194/acpd-14-2773-2014
© Author(s) 2014. CC Attribution 3.0 License.
Atmospheric Chemistry and Physics
Open Access
Discussions
This discussion paper is/has been under review for the journal Atmospheric Chemistry and Physics (ACP). Please refer to the corresponding final paper in ACP if available.
Assessing the regional impact of
Indonesian biomass burning emissions
based on organic molecular tracers and
chemical mass balance modeling
G. Engling1, J. He2, R. Betha3,4, and R. Balasubramanian3,4
1
Department of Biomedical Engineering and Environmental Sciences, National Tsing Hua University, Hsinchu, Taiwan
2
Department of Chemical and Environmental Engineering, The University of Nottingham, Ningbo, China
3
Department of Civil and Environmental Engineering, National University of Singapore, Singapore
4
Singapore-MIT Alliance for Research and Technology (SMART), Centre for Environmental Sensing and Modeling (CENSAM), Singapore
Received: 27 November 2013 – Accepted: 5 January 2014 – Published: 28 January 2014
Correspondence to: R. Balasubramanian (ceerbala@nus.edu.sg)
ACPD
14, 2773–2798, 2014Air quality impact of Indonesian biomass burning emissions
G. Engling et al.
Title Page
Abstract Introduction
Conclusions References
Tables Figures
◭ ◮
◭ ◮
Back Close
Full Screen / Esc
Printer-friendly Version Interactive Discussion
Discussion
P
a
per
|
D
iscussion
P
a
per
|
Discussion
P
a
per
|
Discuss
ion
P
a
per
|
Abstract
Biomass burning activities commonly occur in Southeast Asia (SEA), and are particu-larly intense in Indonesia during dry seasons. The effect of biomass smoke emissions on air quality in the city state of Singapore was investigated during a haze episode in October 2006. Substantially increased levels of airborne particulate matter (PM) and
5
associated chemical species were observed during the haze period. Specifically, the enhancement in the concentration of molecular tracers for biomass combustion such as levoglucosan by as much as two orders of magnitude and diagnostic ratios of indi-vidual organic compounds indicated that biomass burning emissions caused a regional smoke haze episode due to their long-range transport by prevailing winds. With the aid
10
of air mass back trajectories and chemical mass balance modeling, large-scale for-est and peat fires in Sumatra and Kalimantan were identified as the sources of the smoke aerosol, exerting a significant impact on air quality in downwind areas, such as Singapore.
1 Introduction
15
Air quality in SEA is affected by multiple emission sources, including combustion of fos-sil fuels for power generation, transportation and industrial processes, biomass burn-ing, and primary as well as secondary emissions from biogenic sources (Balasubra-manian et al., 1999, 2003; See et al., 2006). Biomass burning is particularly an impor-tant source of carbonaceous aerosol, resulting from the open burning of agricultural
20
residues, slash-and-burn practices, grassland and forest fires, and residential combus-tion of biofuels for cooking and heating. Some of the most intense fires, associated with substantial smoke emissions, have occurred many times in Indonesia since the 1990s. Among the different types of biomass burned in Indonesia, peat fires are the key source of smoke haze (Page et al., 2002; See et al., 2007), particularly in El Nino years.
In-25
ACPD
14, 2773–2798, 2014Air quality impact of Indonesian biomass burning emissions
G. Engling et al.
Title Page
Abstract Introduction
Conclusions References
Tables Figures
◭ ◮
◭ ◮
Back Close
Full Screen / Esc
Printer-friendly Version Interactive Discussion
Discussion
P
a
per
|
D
iscussion
P
a
per
|
Discussion
P
a
per
|
Discuss
ion
P
a
per
|
scattered around the different provinces (Page et al., 2002). The burning of biomass and organic soil produces large quantities of carbonaceous particles comprising burnt or partially burnt carbon.
Lowland forests and plantations are burnt annually, especially during dry seasons (March through April and July through October), by farmers and plantation owners as
5
part of land-clearing activities. Such fires can easily get out of control and spread to adjacent forest and peat areas, resulting in large-scale fires. Moreover, the ground in these areas often consists of peat, which is known to sustain smoldering fires for ex-tended periods of time, partly occurring underground, and thus releasing large amounts of smoke. The most intensive fire event recorded in the literature occurred in Indonesia
10
in 1997 (Levine, 1999; Heil and Goldammer, 2002), followed by another severe regional haze episode in June 2013 which received considerable international attention.
Investigations of emissions from the combustion of peat are limited to laboratory-scale burning of peat in combustion chambers (e.g., Muraleedharan et al., 2000), and few field studies (See et al., 2007; Betha et al., 2013). The field studies showed
el-15
evated levels of PM number and mass concentrations as well as various chemical species at downwind locations from the biomass burning source regions in Indonesia. Christian et al. (2003) and Iinuma et al. (2007) quantified gaseous as well as particulate components of smoke derived from the combustion of Indonesian peat. It is important to note that combustion conditions are an important factor, influencing the physical and
20
chemical properties of the resulting smoke. In the case of peat, due to its chemical nature and high moisture content in typical environments, the combustion process typ-ically proceeds as a smoldering burn, characterized by low combustion efficiency. As a result, peat smoke emissions are high in particulate organic compounds and low in black carbon (BC) content. Despite the environmental significance of wildfires and
re-25
ACPD
14, 2773–2798, 2014Air quality impact of Indonesian biomass burning emissions
G. Engling et al.
Title Page
Abstract Introduction
Conclusions References
Tables Figures
◭ ◮
◭ ◮
Back Close
Full Screen / Esc
Printer-friendly Version Interactive Discussion
Discussion
P
a
per
|
D
iscussion
P
a
per
|
Discussion
P
a
per
|
Discuss
ion
P
a
per
|
contribution of Indonesian biomass burning to the levels of PM in other countries within SEA in relation to local air pollution sources remains poorly known.
We carried out ambient measurements of total suspended particulate matter (TSP) and its chemical composition in Singapore during a haze episode in 2006. The ob-jectives of this research include: (1) to identify suitable organic molecular tracers for
5
studying the influence of peat and biomass fires on regional air quality, and (2) to quantitatively estimate the fractional contribution of these fires to the atmospheric PM loading at a strategically located downwind site based on chemical mass balance mod-eling.
2 Experimental procedures
10
2.1 Sampling site and sample collection
Aerosol samples were collected during two observation periods between Septem-ber 2006 and January 2007 at the Tropical Marine Science Institute on St. John’s Island (SJI), Singapore (1◦13′10′′N; 103◦50′54′′E). The sampling site was located in an open coastal area in the southern part of Singapore, and was not influenced by local pollution
15
sources in the main island, but potentially by biomass burning emissions from Indone-sia. Additional information about the sampling location has been reported previously (Sundarambal et al., 2010). Total suspended particle (TSP) samples were collected for 24 h three times per week, using a High-Volume Air Sampler (HVAS, model 3800 AFC, HI-Q Environmental Products Company, USA). The air flow of the HVAS was
main-20
tained at 40 SCFM (standard cubic feet per minute) by a mass flow controller. TSP samples were collected on quartz fiber filters (QM-A, 20.3 cm×25.4 cm, Whatman, UK). All filters used in this study were inspected for defects under bright illumination and were handled with a pair of stainless steel forceps. The filters were folded in half lengthwise so that only surfaces with collected particulate matter were in contact, when
25
ACPD
14, 2773–2798, 2014Air quality impact of Indonesian biomass burning emissions
G. Engling et al.
Title Page
Abstract Introduction
Conclusions References
Tables Figures
◭ ◮
◭ ◮
Back Close
Full Screen / Esc
Printer-friendly Version Interactive Discussion
Discussion
P
a
per
|
D
iscussion
P
a
per
|
Discussion
P
a
per
|
Discuss
ion
P
a
per
|
box at constant temperature (22–25◦C) and relative humidity (30–35 %) for at least 24 h before weighing. The filters were weighed on a microbalance (model MC5, Sartorius AG, Goettingen, Germany) with a sensitivity of 0.0001 mg. The balance was regularly checked with NIST-traceable standard calibrated weights. The pre- and post-sampling weights were used to obtain the particulate mass collected on the filters. All filters were
5
stored in a refrigerator at 4◦C until analysis. Two field blank filters, one during each observation period, were collected by placing the filters in the sampler for a day without running the sampler and processed together with filter samples.
2.2 Chemical analyses
The TSP filter samples were subjected to a series of chemical analyses, including
10
quantification of the common inorganic ions, trace metals and various organic species. Blank filters were processed according to the same procedures as the sample filters, and the blank values were used to correct the ambient concentrations of the individual chemical species, provided that the blank values were above the method detection limits.
15
The carbonaceous content of the individual samples was measured in the form of organic carbon (OC) and elemental carbon (EC) by a thermo optical transmit-tance (TOT) method, using a Sunset semi-continuous carbon analyzer (Sunset Labs, Model 4, Tigard, OR, USA) in off-line mode, based on a modified NIOSH protocol (Birch and Cary, 1996). Polycyclic aromatic hydrocarbons (PAHs) were determined by
20
high-performance liquid chromatography with mass spectrometric detection (HPLC-MS) upon solvent extraction of an additional portion of the filter samples. A Wa-ters Alliance 2695 HPLC system (WaWa-ters, Milford, MA, USA), coupled with an API-3000 triple-quadrupole mass spectrometer (Applied Biosystems/MDS SCIEX, Toronto, Canada), equipped with an APPI source, was employed for the HPLC-MS analyses.
25
ACPD
14, 2773–2798, 2014Air quality impact of Indonesian biomass burning emissions
G. Engling et al.
Title Page
Abstract Introduction
Conclusions References
Tables Figures
◭ ◮
◭ ◮
Back Close
Full Screen / Esc
Printer-friendly Version Interactive Discussion
Discussion
P
a
per
|
D
iscussion
P
a
per
|
Discussion
P
a
per
|
Discuss
ion
P
a
per
|
Various carbohydrates, including anhydrosugars, polyols and monosaccharides were separated, identified and quantified by high-performance anion exchange chromatog-raphy coupled with pulsed amperometric detection (HPAEC-PAD). The detailed de-scription of the analytical method can be found elsewhere (Engling et al., 2006; Iinuma et al., 2009). Briefly, a portion (2.2 cm2) of each quartz fiber filter was extracted with
5
2.0 mL of de-ionized water (>18.2 MΩresistivity) under ultrasonic agitation for 60 min. The aqueous extracts were passed through syringe filters (0.45 µm, Pall Corporation, NY, USA) to remove insoluble material. All extract solutions were stored at 4◦C until sample analysis. The carbohydrate analyses were performed on a Dionex ICS-3000 system (Dionex, Sunnyvale, CA, USA), consisting of a DP pump module, DC
detec-10
tor/chromatography compartment and autosampler.
The separation of the individual carbohydrate species was carried out on a Dionex Carbopac MA1 analytical column (250×4 mm) and guard column with an aqueous sodium hydroxide (NaOH, 480 mM) eluent at a flow rate of 0.4 mL min−1. Method de-tection limits for the individual analytes ranged from 0.2 to 4.1 ng. Quantitative (nearly
15
100 %) extraction of the various carbohydrates was shown by analysis of spiked blank filters. None of the carbohydrate species were detected in the blank samples.
The common inorganic ions were determined in the same aqueous extracts as those prepared for HPAEC analysis, using a compact Dionex IC system (Model ICS-2000, Dionex Corp. USA). It consists of an eluent generator (EG with CR-TC), isocratic
20
pump, conductivity detector, anion self-regenerating suppressor (ASRS Ultra II-4 mm), rheodyne six-port injection valve with 25 µL injection loop, and AS-40 autosampler. An AS-11-HC (4 mm) analytical column in conjunction with an AG-11-HC guard column was used for anion measurement. For cations, the cation ion-exchange column, CS-12 (4 mm), was used with 11.0 mM H2SO4 as the eluent. The peaks corresponding
25
ACPD
14, 2773–2798, 2014Air quality impact of Indonesian biomass burning emissions
G. Engling et al.
Title Page
Abstract Introduction
Conclusions References
Tables Figures
◭ ◮
◭ ◮
Back Close
Full Screen / Esc
Printer-friendly Version Interactive Discussion
Discussion
P
a
per
|
D
iscussion
P
a
per
|
Discussion
P
a
per
|
Discuss
ion
P
a
per
|
Both water-soluble and insoluble metals were measured by a Perkin-Elmer Elan 6100 ICP-MS (Perkin-Elmer Inc., USA). The ICP-MS was quipped with a cross flow nebulizer and a quartz torch. The instrument with Pt sampler and skimmer cones was optimized daily and operated as recommended by the manufacturer. The nebulizer gas flow rate was adjusted to keep the CeO/Ce and BaO/Ba ratios less than 2 %. A Gilson
5
Miniplus 2 peristaltic pump was used to remove the waste from the nebulizer. An eight point calibration (1, 2, 5, 10, 20, 40, 60 and 100 µg L−1) was performed for 13 elements, and the regression coefficients for all 11 elements were better than 0.999. The coeffi -cient of variations for the 13 elements was found to be less than 5 % (n=10) at 5 µg L−1 concentration level. Sample handling and preparation were carried out in a laminar flow
10
hood equipped with a HEPA (high-efficiency particulate air) filter to prevent contamina-tion. In all experiments, reagent blanks were taken separately. The filter blanks and the final concentrations of metals in PM are reported after reagent blank correction.
2.3 Source apportionment
The chemical mass balance air quality receptor model CMB 8.2 (US EPA, 2004) was
15
used to estimate the relative contribution of peat fires and other sources to ambient TSP measured at the sampling site during the clear and hazy days. Source profiles of inorganic ions and trace elements used in the model were obtained from SPECIATE 4.3 (SPECIATE, 2011). Source profiles for Indonesian peat fires were obtained from our previous study (See et al., 2007).
20
2.4 Backward trajectories
The latest, updated Hybrid Single-Particle Lagrangian Integrated Trajectory (HYSPLIT) model (Version 4.9) (Draxler and Rolph, 2003; Rolph, 2003), developed by the National Oceanic and Atmospheric Administration (NOAA), was used to compute backward tra-jectories for air samples taken during the haze period (October 2006) and clear days
25
ACPD
14, 2773–2798, 2014Air quality impact of Indonesian biomass burning emissions
G. Engling et al.
Title Page
Abstract Introduction
Conclusions References
Tables Figures
◭ ◮
◭ ◮
Back Close
Full Screen / Esc
Printer-friendly Version Interactive Discussion
Discussion
P
a
per
|
D
iscussion
P
a
per
|
Discussion
P
a
per
|
Discuss
ion
P
a
per
|
National Centers for Environmental Prediction (NCEP) Global Data Assimilation Sys-tem (GDAS, global, 2006–present). Kinematic 3-D trajectories were used as they are reported to provide an accurate description of the history of air masses in comparison with all of the other approaches (isentropic, isobaric) (Stohl, 1998; Stohl and Seibert, 1998). Air mass backward trajectories reaching 4 days (96 h) back were calculated
us-5
ing start times of 08:00 of each sampling period. The calculation heights were fixed at 500, 1000 and 1500 m above the ground. The atmospheric level, 500 m a.g.l., is very frequently used (Lee et al., 2006; Erel et al., 2007) and ensures that the trajectory starts in the planetary boundary layer (ABL) (Dvorská et al., 2009).
3 Results and discussion
10
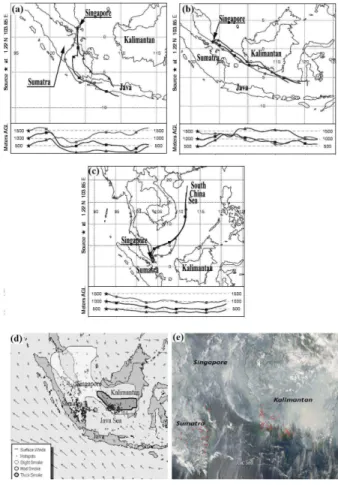
3.1 Trajectory analysis and temporal variations in TSP concentrations
The representative air mass backward trajectories for both haze and clear days are presented in Fig. 1 with a haze map in October 2006. The haze period (October 2006) occurred in the end of the Southwest Monsoon season, within which the climate in Singapore is governed mainly by Southwest (SW) or Southeast (SE) winds. In this
15
study, the predominant airflow direction was consistent with the general wind pattern and direction from SE. In October 2006, Singapore had been affected by smoke haze transported from uncontrolled biomass and peat burning due to “slash and burn” cul-tivation in Indonesia, where specifically dense hotspots were observed in Kalimantan and south Sumatra (Fig. 1d and e). During this period, some of the air masses
arriv-20
ing at Singapore arrived from Sumatra (Fig. 1a) while some of them were advected from the south-western coast or island of Kalimantan with thick haze (Fig. 1b); in ad-dition, on some sampling occasions, the air masses descended (from 1500 m altitude) or rose (from 500 m altitude) during the transport, indicating mixing of air masses from different layers on the way to Singapore. During the clear period (December 2006–
25
ACPD
14, 2773–2798, 2014Air quality impact of Indonesian biomass burning emissions
G. Engling et al.
Title Page
Abstract Introduction
Conclusions References
Tables Figures
◭ ◮
◭ ◮
Back Close
Full Screen / Esc
Printer-friendly Version Interactive Discussion
Discussion
P
a
per
|
D
iscussion
P
a
per
|
Discussion
P
a
per
|
Discuss
ion
P
a
per
|
the major air masses associated with cleaner source regions originated from the South China Sea, characteristic of the Northeast Monsoon season.
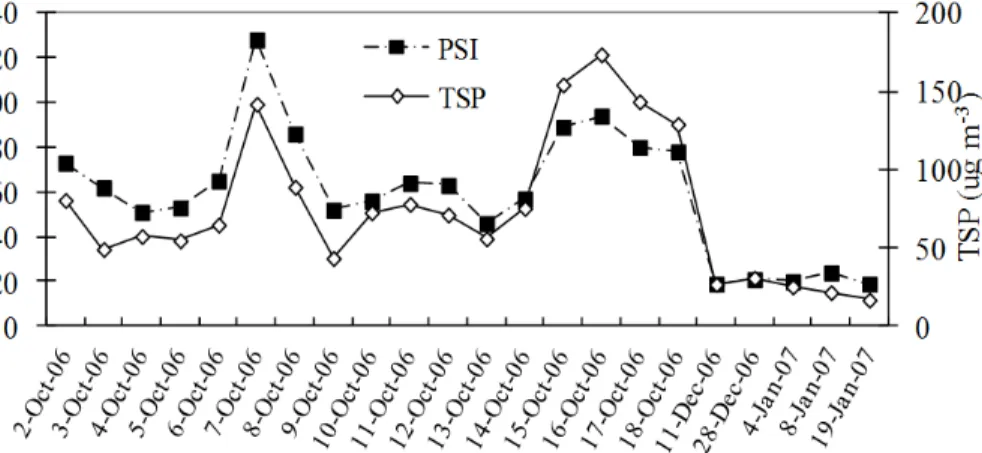
Figure 2 shows the daily average concentrations of total suspended particles (TSP) and Pollution Standard Index (PSI) readings (for south Singapore) which are typically based on PM10concentrations during haze episodes (Singapore National Environment
5
Agency). It is evident that the daily variation of PSI was well correlated with the variation in TSP concentrations during both haze and clear days.
3.2 TSP mass balance
Average concentrations of EC, OC, PAHs, ions, and trace elements are presented in Table 1, as observed during haze (October 2006) and clear (December 2006–
10
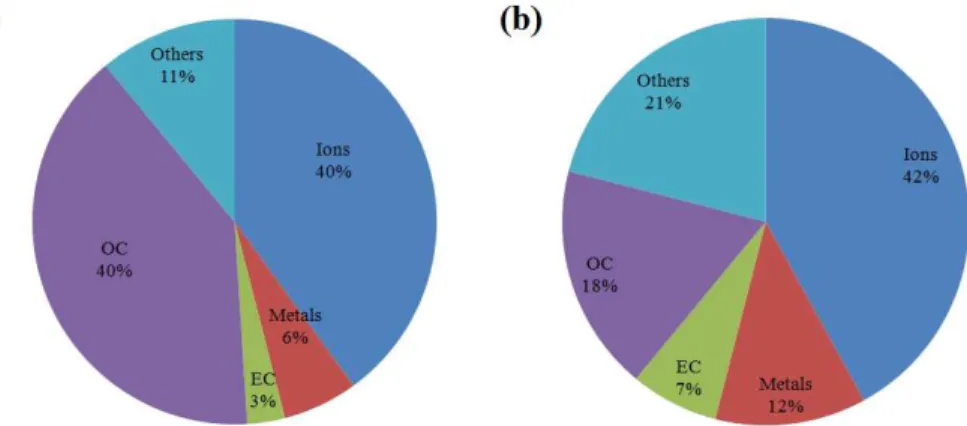
January 2007) days on St. John’s Island in Singapore. The mean concentration of TSP during the haze period was higher by a factor of 3.5 as compared to clear days. Simi-larly, the levels of the speciated chemical components of TSP were significantly higher during the haze period than those during clear days. The relative contributions of vari-ous chemical species to the total mass concentrations of TSP are shown in Fig. 3. In
15
this figure, “others” refers to the fraction of TSP that was not identifiable (See et al., 2007), where
others=TSP−(EC+OC+inorganic ions+total metals). (1)
During haze days, a noticeably enhanced carbonaceous fraction (OC+EC) was ob-served relative to clear days, accounting for 43 % of TSP mass on average (vs. 25 %
20
on clear days, Fig. 3). It is also worthwhile estimating the amount of organic matter (OM), accounting for hetero atoms in the organic compounds such as oxygen and nitrogen, by applying suitable OC/OM conversion factors. In the case of aerosols mea-sured downwind of biomass burning activities, OC/OM factors of more than 2 have been suggested (e.g., Turpin and Lim, 2001). When applying a factor of 2 to the OC
25
ACPD
14, 2773–2798, 2014Air quality impact of Indonesian biomass burning emissions
G. Engling et al.
Title Page
Abstract Introduction
Conclusions References
Tables Figures
◭ ◮
◭ ◮
Back Close
Full Screen / Esc
Printer-friendly Version Interactive Discussion
Discussion
P
a
per
|
D
iscussion
P
a
per
|
Discussion
P
a
per
|
Discuss
ion
P
a
per
|
Aside from the substantial increase in the OC or OM fraction, the OC/EC ratio was also very high on haze days (15.5 vs. 2.6) compared to clear days, which was higher than the values from most studies reported in the literature, suggesting a strong influ-ence by biomass burning emissions. It should be noted that high OC/EC ratios can also be due to contributions of organic species derived from biogenic sources and
5
secondary organic aerosol (SOA) in particular; however, the source strength of such processes is expected to be fairly constant throughout the year at a tropical location such as Singapore. Therefore, the substantially higher OC/EC ratios observed dur-ing the haze period (compared to clear days) confirmed the significant contributions of carbonaceous material derived from biomass burning.
10
3.3 Chemical speciation of TSP
As presented in Table 1, the chemical speciation data include a large number of compounds and elements, such as inorganic ions, trace metals, and various organic species (carbohydrates, PAHs, and carboxylic acids). The substantial increase in the OC mass (by about one order of magnitude) is obviously also reflected in elevated
15
ambient concentrations of individual organic species, specifically in terms of carbo-hydrates and carboxylic acids. Anhydrosugars, such as levoglucosan, mannosan and galactosan, are well established molecular tracers for biomass burning emissions, as they are solely derived from the thermal decomposition of cellulose and hemicellu-loses (Simoneit et al., 1999). Although recent laboratory studies have revealed that
20
these tracers may be degraded in the presence of strong oxidants, such as OH radi-cals (Hannigan et al., 2010; Hoffmann et al., 2010), the anhydrosugars can be used at least as qualitative indicators of biomass burning influence, but also for quantitative es-timates of biomass smoke contributions when transport distances are shorter (Mochida et al., 2010), as was the case with the haze episode in this study. The ambient
con-25
ACPD
14, 2773–2798, 2014Air quality impact of Indonesian biomass burning emissions
G. Engling et al.
Title Page
Abstract Introduction
Conclusions References
Tables Figures
◭ ◮
◭ ◮
Back Close
Full Screen / Esc
Printer-friendly Version Interactive Discussion
Discussion
P
a
per
|
D
iscussion
P
a
per
|
Discussion
P
a
per
|
Discuss
ion
P
a
per
|
The inspection of the relative abundance of individual tracers revealed character-istic patterns, which can be used to distinguish periods with smoke influence from the clear days. Specifically, the ratio of the anhydrosugars levoglucosan and man-nosan (LG/MN) can be used for qualitative assessments of contributions from spe-cific biomass species (Engling et al., 2009; Fabbri et al., 2009). For instance, smoke
5
particles derived from softwood combustion are characterized by low LG/MN values of 3–5, while hard wood smoke LG/MN ratios range from 15 to 25 and those for rice straw are even higher (∼40). Unlike during the clear days, the LG/MN ratios showed very little variation throughout the haze episode, implying that only one specific biomass type or a steady mix of species was subject to burning. The average LG/MN ratio (10)
10
observed during the haze period is in excellent agreement with chamber burn data from peat combustion (Iinuma et al., 2007) and ambient observations from Malaysia (Simoneit et al., 2004), confirming the biomass burning source to be the peat lands in Indonesia.
Two additional carbohydrates, the sugar alcohols arabitol and mannitol were
quan-15
tified in the TSP samples in Singapore. These polyols have recently been proposed as bioaerosol indicators and molecular tracers for fungal spores in particular (Bauer et al., 2008a; Elbert et al., 2007). Meanwhile, fungal spore contributions to the aerosol burden have been estimated based on ambient concentrations of these tracers in a few recent studies (Bauer et al., 2008b; Liang et al., 2013; Zhang et al., 2010), revealing
20
relatively large fungal spore content specifically in coarse particles in tropical environ-ments (Zhang et al., 2010b). The average TSP content of these tracers during the haze period in Singapore was not significantly different from that on clear days, indicating no apparent association of fungal spores with biomass smoke particles derived from peat combustion.
25
ACPD
14, 2773–2798, 2014Air quality impact of Indonesian biomass burning emissions
G. Engling et al.
Title Page
Abstract Introduction
Conclusions References
Tables Figures
◭ ◮
◭ ◮
Back Close
Full Screen / Esc
Printer-friendly Version Interactive Discussion
Discussion
P
a
per
|
D
iscussion
P
a
per
|
Discussion
P
a
per
|
Discuss
ion
P
a
per
|
the predominant influence of emissions from certain types of combustion. For instance, Ind/(Ind+B(g, h, i)P)>0.5 indicates sources of solid fuel combustion (such as coal, wood, grass, etc.) and ratios<0.2 indicate petroleum origin, while the ratios between 0.2–0.5 indicate liquid fossil fuel combustion (vehicles and crude oil) (Yunker et al., 2002). Similarly, Flt/(FIt+Pyr)<0.4 is attributable to unburned petroleum, and a ratio
5
at and above 0.5 indicates coal, grass and wood combustion origins, while ratios be-tween 0.4–0.5 indicate liquid fossil fuel combustion (Yunker et al., 2002). In this study the ratios of Ind/(Ind+B(g, h,i)P) and Flt/(FIt+Pyr) were found to be in the range of 0.51–0.57 and 0.47–0.55 respectively during haze days, while they ranged from 0.41–0.47 and 0.40–0.45 during clear days, suggesting that the dominant contributor
10
is biomass burning during the hazy period and local sources, such as ships and diesel engines, during clear days.
All of the common inorganic ions were present at higher levels in TSP during the haze period, with enhancements of up to one order of magnitude in some cases (e.g., ammonium). Aside from ammonium, potassium and nitrate also showed significantly
15
higher ambient concentrations in the haze vs. clear periods, confirming the strong in-fluence of biomass burning activities on the local aerosol burden.
During the haze period, dicarboxylic acids (succinate, malonate, glutarate and ox-alate) were much more abundant than monocarboxylic acids (acetate and formate); oxalate was the predominant dicarboxylic acid. Analogous to other organic species,
20
the mass concentrations of organic acids observed during the haze period were much higher than those obtained during the clear days, suggesting that biomass burning is an important source of organic acids. These acids could have been directly emitted from the biomass burning source (e.g., peat fires) and/or formed in the atmosphere as a result of chemical conversions in the biomass burning smoke plume (See et al.,
25
ACPD
14, 2773–2798, 2014Air quality impact of Indonesian biomass burning emissions
G. Engling et al.
Title Page
Abstract Introduction
Conclusions References
Tables Figures
◭ ◮
◭ ◮
Back Close
Full Screen / Esc
Printer-friendly Version Interactive Discussion
Discussion
P
a
per
|
D
iscussion
P
a
per
|
Discussion
P
a
per
|
Discuss
ion
P
a
per
|
organic acids, has also been reported from previous studies in SEA and elsewhere (Agarwal et al., 2010; Graham et al., 2002; Gao et al., 2003; Kundu et al., 2010).
Both total and water-soluble metal concentrations were determined in the TSP sam-ples collected during the haze period and clear days in Singapore. The concentrations of most trace metals were clearly enhanced during the haze period in relation to those
5
on clear days. Other than Cu, Al, Fe, and Ti were the most abundant trace metals found in haze samples. The substantial increase in the metallic species concentrations seems to be associated with re-mobilization of local soils via the air medium upon high-temperature combustion of the peat/vegetation, as these three metals are also the top three most abundant metals in the Earth’s crust (Lide, 2005). As for copper,
10
total Cu concentrations during the haze period were 30 times higher on average com-pared to those on clear days. This phenomenon may be due to the strong fixation ability of water-soluble copper compounds by rich humic and fulvic acids in the peat soils (Mutert et al., 1999); upon combustion, this part of copper can be subsequently discharged into the ambient air. The low solubility of this metal could be due to the
15
chemical form in which it exists, for example, as metal oxides are produced during high-temperature combustion; a metal oxide is in general less soluble as compared to metal nitrates/sulfates. However, whether or not the soil in this local area contains high concentration of copper needs to be further investigated. In addition, the water-soluble fraction of most metals was larger by factors of 5 or more during haze vs. clear
peri-20
ods. This could be due to strong (more effective) attachment of organic matter to the metals in the newly formed particles emitted during biomass burning processes. As mentioned earlier, organic acids were much more enriched in the haze aerosols than those on clear days. The presence of organic ligands can result in the formation of soluble heavy metal complexes (See et al., 2007; Gaberell et al., 2003).
25
3.4 Source apportionment
ACPD
14, 2773–2798, 2014Air quality impact of Indonesian biomass burning emissions
G. Engling et al.
Title Page
Abstract Introduction
Conclusions References
Tables Figures
◭ ◮
◭ ◮
Back Close
Full Screen / Esc
Printer-friendly Version Interactive Discussion
Discussion
P
a
per
|
D
iscussion
P
a
per
|
Discussion
P
a
per
|
Discuss
ion
P
a
per
|
TSP samples as part of this study, the chemical mass balance (CMB) modeling ap-proach was applied here, providing reliable estimates of the individual sources (Watson et al., 2002). Figure 4 shows the relative source contributions to ambient TSP at the sampling site during haze and clear days. The CMB performance measure indices are all within the target ranges recommended by the US EPA (r2: 0.8–1;χ2: 0–4; % mass:
5
80–120 %; degrees of freedom>5, t-stat>2 for all the contribution sources). The ma-jor pollution sources that affected the air quality at the sampling site were identified to be peat fires, diesel exhaust, petroleum refineries, ships, and power plants during the sampling period. From Fig. 4, it can be seen that diesel exhaust was the dominating source on a typical clear day. The sampling site is remotely located away from the
10
main land of Singapore, so that the power supply for the entire island is provided by diesel generators which could be the reason for the diesel exhaust to be a major con-tributor to PM (∼62 %) at the sampling site. Ships passing by the island to reach the Singapore port also contributed to TSP (27 %), followed by a nearby petroleum refin-ery (∼6 %) and power plants (∼5 %). During the haze episode, peat fires in Indonesia
15
were the predominant source (∼76 %) of TSP followed by diesel exhaust (19 %), and ship emissions (∼5 %).
4 Conclusions
In this study, the impact of a major smoke haze episode, caused by biomass burning and peat fires in Indonesia, on regional air quality in Singapore was investigated
dur-20
ing autumn of 2006. It was observed that the TSP concentration increased by a factor of 3.5 with the major contribution from the carbonaceous fraction (∼43 %) during the haze episode when compared to clear days (carbonaceous fraction∼25 %). Very high OC/EC ratios (15.5), concentrations of organic acids, PAHs, and trace metals, espe-cially Cu, Al, Fe and Ti, in TSP observed during the haze period reveal the impact
25
ACPD
14, 2773–2798, 2014Air quality impact of Indonesian biomass burning emissions
G. Engling et al.
Title Page
Abstract Introduction
Conclusions References
Tables Figures
◭ ◮
◭ ◮
Back Close
Full Screen / Esc
Printer-friendly Version Interactive Discussion
Discussion
P
a
per
|
D
iscussion
P
a
per
|
Discussion
P
a
per
|
Discuss
ion
P
a
per
|
diagnostic ratio of LG/MN of 10 observed during the haze period is in excellent agree-ment with the laboratory data from controlled peat combustion, confirming the biomass burning source to be the peat lands in Indonesia. Similarly, the diagnostic ratios of PAH species indicate that the TSP during the haze period was predominantly influenced by biomass burning while it was mainly influenced by local fossil fuel combustion and
5
specially diesel engine emissions during clear days. Source apportionment using the CMB model indicated that on clear days, TSP at the sampling location was mainly de-rived from exhaust (∼62 %) from local diesel generators which is the only source of power on the Island, followed by ships (27 %), petroleum refinery (∼6 %) and power plants (∼5 %). On the other hand, during the haze period nearly 76 % of the TSP was 10
derived from peat fires in Indonesia, reducing the source contribution of diesel exhaust and ship emissions at the sampling site to 19 % and 5 %, respectively.
Acknowledgements. The authors, R. Betha and R. Balasubramanian, acknowledge the finan-cial support from the National University of Singapore and from the National Research Founda-tion Singapore through the Singapore MIT Alliance for Research and Technology’s CENSAM 15
research programme and National university of Singapore (NUS) for carrying out this study. Thanks are also due to C. Liu for performing the HPLC-MS analyses.
References
Agarwal, S., Aggarwal, S. G., Okuzawa, K., and Kawamura, K.: Size distributions of dicarboxylic acids, ketoacids,α-dicarbonyls, sugars, WSOC, OC, EC and inorganic ions in atmospheric 20
particles over Northern Japan: implication for long-range transport of Siberian biomass burn-ing and East Asian polluted aerosols, Atmos. Chem. Phys., 10, 5839–5858, doi:10.5194/acp-10-5839-2010, 2010.
Balasubramanian, R., Victor, T., and Begum, R.: Impact of biomass burning on rainwater acidity and composition in Singapore, J. Geophys. Res., 104, 881–890, 1999.
25
ACPD
14, 2773–2798, 2014Air quality impact of Indonesian biomass burning emissions
G. Engling et al.
Title Page
Abstract Introduction
Conclusions References
Tables Figures
◭ ◮
◭ ◮
Back Close
Full Screen / Esc
Printer-friendly Version Interactive Discussion
Discussion
P
a
per
|
D
iscussion
P
a
per
|
Discussion
P
a
per
|
Discuss
ion
P
a
per
|
Bauer, H., Claeys, M., Vermeylen, R., Schueller, E., Weinke, G., Berger, A., and Puxbaum, H.: Arabitol and mannitol as tracers for the quantification of airborne fungal spores, Atmos. En-viron., 4, 588–593, 2008a.
Bauer, H., Schueller, E., Weinke, G., Berger, A., Hitzenberger, R., Marr, I. L., and Puxbaumm, H.: Significant contributions of fungal spores to the organic carbon and to the 5
aerosol mass balance of the urban atmospheric aerosol, Atmos. Environ., 42, 5542–5549, 2008b.
Betha, R., Pradani, M., Lestari, P., Joshi, U. M., Reid, J. S., and Balasubramanian, R.: Chemical speciation of trace metals emitted from Indonesian peat fires for health risk assessment, Atmos. Res., 122, 571–578, 2013.
10
Chandra, S., Ziemke, J. R., Bhartia, P. K., and Martin, R. V.: Tropical tropospheric ozone: implications for dynamics and biomass burning, J. Geophys. Res., 107, 4188, doi:10.1029/2001JD000447, 2002.
Christian, T. J., Kleiss, B., Yokelson, R. J., Holzinger, R., Crutzen, P. J., Hao, W. M., Sa-harjo, B. H., and Ward, D. E.: Comprehensive laboratory measurements of biomass-burning 15
emissions: 1. Emissions from Indonesian, African, and other fuels, J. Geophys. Res., 108, 4719, doi:10.1029/2003JD003704, 2003.
Critical Ecosystem Partinership Fund: Sumatra Forest Ecosystems Sundaland Biodiversity Hotspot, Arlington, VA, USA, 2001.
Draxler, R. R. and Rolph, G. D.: HYSPLIT (Hybrid Single-Particle Lagrangian Integrated Tra-20
jectory) Model access via NOAA ARL READY, NOAA Air Resources Laboratory, Silver Springs, M.D., USA, available at: http://www.arl.noaa.gov/ready/hysplit4.html (last access: 15 October 2013), 2003.
Duncan, B. N., Bey, I., Chin, M., Mickley, L. J., Fairlie, T. D., Martin, R. V., and Matsueda, H.: Indonesian wildfires of 1997: impact on tropospheric chemistry, J. Geophys. Res., 108, 4458, 25
doi:10.1029/2002JD003195, 2003.
Dvorská, A., Lammel, G., and Holoubek, I.: Recent trends of persistent organic pollutants in air in central Europe-air monitoring in combination with air mass trajectory statistics as a tool to study the effectivity of regional chemical policy, Atmos. Environ., 43, 1280–1287, 2009. Elbert, W., Taylor, P. E., Andreae, M. O., and Pöschl, U.: Contribution of fungi to primary biogenic 30
ACPD
14, 2773–2798, 2014Air quality impact of Indonesian biomass burning emissions
G. Engling et al.
Title Page
Abstract Introduction
Conclusions References
Tables Figures
◭ ◮
◭ ◮
Back Close
Full Screen / Esc
Printer-friendly Version Interactive Discussion
Discussion
P
a
per
|
D
iscussion
P
a
per
|
Discussion
P
a
per
|
Discuss
ion
P
a
per
|
Engling, G., Lee, J. J., Tsai, Y.-W., Lung, S.-C. C., Chou, C. C.-K„ and Chan. C. Y.: Size-resolved anhydrosugar composition in smoke aerosol from controlled field burning of rice straw, Aerosol Sci. Tech., 43, 662–672, 2009.
Erel, Y., Kalderon-Asael, B., Dayan, U., and Sandler, A.: European atmospheric pollution im-ported by cooler air masses to the Eastern Mediterranean during the summer, Environ. Sci. 5
Technol., 41, 5198–6003, 2007.
Fabbri, D., Torri, C., Simonei, B. R. T., Marynowski, L., Rushdi, A. I., and Fabianska, M. J.: Levoglucosan and other cellulose and lignin markers in emissions from burning of Miocene lignites, Atmos. Environ., 43, 2286–2295, 2009.
Ferreira, J., Reeves, C. E., Murphy, J. G., Garcia-Carreras, L., Parker, D. J., and Oram, D. E.: 10
Isoprene emissions modelling for West Africa: MEGAN model evaluation and sensitivity anal-ysis, Atmos. Chem. Phys., 10, 8453–8467, doi:10.5194/acp-10-8453-2010, 2010.
Gaberell, M., Chin, Y. P., Hug, S. J., and Sulzberger, B.: Role of dissolved organic matter compo-sition on the photoreduction of Cr(VI) to Cr(III) in the presence of iron, Environ. Sci. Technol., 37, 4403–4409, 2003.
15
Gao, S., Hegg, D. A., Hobbs, P. V., Kirchstetter, T. W., Magi, B. I., and Sadilek, M.: Water-soluble organic compounds in aerosols associated with savanna fires in southern Africa: identification, evolution, and distribution, J. Geophys. Res., 108, 8491–8506, 2003.
Graham, B., Mayol-Bracero, O. L., Guyon, P., Roberts, G. C., Decesari, S., Facchini, M. C., Artaxo, P., Maenhaut, W., Koil, P., and Andreae, M. O.: Water-soluble organic compounds 20
in biomass burning aerosols over Amazonia, 1. Characterization by NMR and GC-MS, J. Geophys. Res., 107, 8047–8062, 2002.
Heil, A. and Goldammer, J. G.: Smoke-haze pollution: a review of the 1997 episode in Southeast Asia, Reg. Environ. Change, 2, 24–37, 2001.
Hennigan, C. J., Sullivan, A. P., Collett, J. L., and Robinson, A. L.: Levoglucosan stability in 25
biomass burning particles exposed to hydroxyl radicals, Geophys. Res. Lett., 37, L09806, doi:10.1029/2010GL043088, 2010.
Hoffmann, D., Tilgner, A., Iinuma, Y., and Herrmann, H.: Atmospheric stability of levoglucosan: a detailed laboratory and modeling study, Environ. Sci. Technol., 44, 694–699, 2010. Iinuma, Y., Bruggemann, E., Gnauk, T., Mueller, K., Andreae, M. O., Helas, G., Parmar, R., 30
ACPD
14, 2773–2798, 2014Air quality impact of Indonesian biomass burning emissions
G. Engling et al.
Title Page
Abstract Introduction
Conclusions References
Tables Figures
◭ ◮
◭ ◮
Back Close
Full Screen / Esc
Printer-friendly Version Interactive Discussion
Discussion
P
a
per
|
D
iscussion
P
a
per
|
Discussion
P
a
per
|
Discuss
ion
P
a
per
|
Kulshrestha, U., Jain, M., Sekar, R., Vairamani, M., Sarkar, A., and Parashar, D.: Chemical characteristics and source apportionment of aerosols over Indian Ocean during INDOEX-1999, Curr. Sci. , 80, 180–185, 2001.
Kundu, S., Kawamura, K., Andreae, T. W., Hoffer, A., and Andreae, M. O.: Molecular distri-butions of dicarboxylic acids, ketocarboxylic acids and α-dicarbonyls in biomass burning 5
aerosols: implications for photochemical production and degradation in smoke layers, At-mos. Chem. Phys., 10, 2209–2225, doi:10.5194/acp-10-2209-2010, 2010.
Lee, K. H., Kim, Y. J., and Kim, J. J.: Characteristics of aerosol observed during two severe haze events over Korea in June and October 2004, Atmos. Environ., 40, 5146–5155, 2006. Lelieveld, J., Butler, T. M., Crowley, J. N., Dillon, T. J., Fischer, H., Ganzeveld, L., Harder, H., 10
Lawrence, M. G., Martinez, M., Taraborelli, D., and Williams, J.: Atmospheric oxidation ca-pacity sustained by a tropical forest, Nature, 452, 737–740, 2008.
Levine, J. S.: The 1997 fires in Kalimantan and Sumatra, Indonesia: gaseous and particulate emissions, Geophys. Res. Lett., 26, 815–818, 1999.
Liang, L., Engling, G., He, K., Du, Z., Cheng, Y., and Duan, F.: Evaluation of fungal spore 15
characteristics in Beijing, China, based on molecular tracer measurements, Environ. Res. Lett., 8, 014005, doi:10.1088/1748-9326/8/1/014005, 2013.
Lide, D. R.: Geophysics, astronomy, and acoustics, abundance of elements in the Earth’s crust and in the Sea, in: CRC Handbook of Chemistry and physics, CRC Press, Boca Raton, FL, 14 p., 2005.
20
Mochida, M., Kawamura, K., Fu, P. Q., and Takemura, T.: Seasonal variation of levoglucosan in aerosols over the western North Pacific and its assessment as a biomass-burning tracer, Atmos. Environ., 44, 3511–3518, 2010.
Marticorena, B., Haywood, J., Coe, H., Formenti, P., Liousse, C., Mallet, M., and Pelon, J.: Tropospheric aerosols over West Africa: highlights from the AMMA international program, 25
Atmos. Sci. Lett., 12, 19–23, 2011.
Martin, S. T., Andreae, M. O., Althausen, D., Artaxo, P., Baars, H., Borrmann, S., Chen, Q., Farmer, D. K., Guenther, A., Gunthe, S. S., Jimenez, J. L., Karl, T., Longo, K., Manzi, A., Müller, T., Pauliquevis, T., Petters, M. D., Prenni, A. J., Pöschl, U., Rizzo, L. V., Schneider, J., Smith, J. N., Swietlicki, E., Tota, J., Wang, J., Wiedensohler, A., and Zorn, S. R.: An overview 30
ACPD
14, 2773–2798, 2014Air quality impact of Indonesian biomass burning emissions
G. Engling et al.
Title Page
Abstract Introduction
Conclusions References
Tables Figures
◭ ◮
◭ ◮
Back Close
Full Screen / Esc
Printer-friendly Version Interactive Discussion
Discussion
P
a
per
|
D
iscussion
P
a
per
|
Discussion
P
a
per
|
Discuss
ion
P
a
per
|
Mutert, E., Fairhurst, T. H., and von Hexküll, H. R.: Agronomic management of oil palms on deep peat, Better Crops International, 13, 22–27, 1999.
Page, S. E., Siegert, F., Rieley, J. O., Boehm, H.-D. V., Jaya, A., and Limin, S.: The amount of carbon released from peat and forest fires in Indonesia during 1997, Nature, 420, 61–65, 2002.
5
Rolph, G. D.: Real-time Environmental Applications and Display sYstem (READY) Website, NOAA Air Resources Laboratory, Silver Spring, MD, USA, available at: http://www.arl.noaa. gov/ready/hysplit4.html (last access: 15 October 2013), 2003.
See, S. W., Balasubramanian, R., and Wang, W.: A study of the physical, chemical, and optical properties of ambient aerosol particles in Southeast Asia during hazy and nonhazy days, J. 10
Geophys. Res., 111, D10S08, doi:10.1029/2005JD006180, 2006.
See, S. W., Balasubramanian, R., Rianawati, E., Karthikeyan, S., and Streets, D. G.: Charac-terization and source apportionment of particulate matter≤2.5 µm in Sumatra, Indonesia,
during a recent peat fire episode, Environ. Sci. Technol., 41, 3488–3494, 2007.
Simoneit, B. R. T., Kobayashi, M., Mochida, M., Kawamura, K., and Huebert, B. J.: Aerosol 15
particles collected on aircraft flights over the northwestern Pacific region during the ACE-Asia campaign: composition and major sources of the organic compounds, J. Geophys. Res., 109, D19S09, doi:10.1029/2004JD004565, 2004.
Simoneit, B. R. T., Schauer, J. J., Nolte, C. G., Oros, D. R., Elias, V. O., Fraser, M. P., Rogge, W. F., and Cass, G. R.: Levoglucosan, a tracer for cellulose in biomass burning and 20
atmospheric particles, Atmos. Environ., 33, 173–182, 1999.
SPECIATE: VOC/PM speciation Database Management system Version 4.3; US Environmen-tal Protection Agency: Research Triangle Park, NC, available at: http://www.epa.gov/ttnchie1/ software/speciate/ (last access: 15 October 2013), 2011.
Stohl, A.: Computation, accuracy and applications of trajectories – a review and bibliography, 25
Atmos. Environ., 32, 947–966, 1998.
Stohl, A. and Seibert, P.: Accuracy of trajectories as determined from the conservation of me-teorological tracers, Q. J. Roy. Meteor. Soc., 124, 1465–1484, 1998.
USEPA, EPA-CMB8.2 Users Manual, EPA-452/R-04–011, Office of Air Quality Planning and Standards, Research Triangle Park, NC, USA, 2004.
30
ACPD
14, 2773–2798, 2014Air quality impact of Indonesian biomass burning emissions
G. Engling et al.
Title Page
Abstract Introduction
Conclusions References
Tables Figures
◭ ◮
◭ ◮
Back Close
Full Screen / Esc
Printer-friendly Version Interactive Discussion
Discussion
P
a
per
|
D
iscussion
P
a
per
|
Discussion
P
a
per
|
Discuss
ion
P
a
per
|
Yunker, M. B., Macdonald, R. W., Vingarzan, R., Mitchell, R. H., Goyette, D., and Sylvestre, S.: PAHs in the Fraser River basin: a critical appraisal of PAH ratios as indicators of PAH source and composition, Org. Geochem., 33, 489–515, 2002.
Zhang, T., Engling, G., Chan, C. Y., Zhang, Y. N., Zhang, Z. S., Lin, M., Sang, X. F., Li, Y. D., and Li, Y. S.: Contribution of fungal spores to particulate matter in a tropical rainforest, Environ. 5
Res. Lett., 5, 024010, doi:10.1088/1748-9326/5/2/024010, 2010b.
Zhang, Z. S., Engling, G., Lin, C. Y., Chou, C. C. K., Lung, S. C. C., Chang, S. Y., Fan, S. J., Chan, C. Y., and Zhang, Y. H.: Chemical speciation, transport and contribution of biomass burning smoke to ambient aerosol in Guangzhou, a mega city of China, Atmos. Environ., 44, 3187–3195, 2010a.
ACPD
14, 2773–2798, 2014Air quality impact of Indonesian biomass burning emissions
G. Engling et al.
Title Page
Abstract Introduction
Conclusions References
Tables Figures
◭ ◮
◭ ◮
Back Close
Full Screen / Esc
Printer-friendly Version Interactive Discussion
Discussion
P
a
per
|
D
iscussion
P
a
per
|
Discussion
P
a
per
|
Discuss
ion
P
a
per
|
Table 1.Mass concentrations of TSP and associated chemical components during haze and
clear periods at St. John Island in Singapore.
Haze period Clear days Concentration (average±standard deviation)
TSP (µg m−3
)
TSP 84.1±33.4 24.0±5.2 Carbonaceous components (µg m−3)
EC 2.3±1.5 1.7±0.50 OC 33.6±18.9 4.2±0.53 OC/EC 15.5 2.6 Polycyclic aromatic hydrocarbons (PAHs) (ng m−3
) Benzo 0.11±0.05 0.08±0.06 Naph N.A N.A Acy 0.11±0.04 0.04±0.02 Ace 0.05±0.04 0.02±0.01 Flu 0.06±0.08 0.02±0.03 Phe 0.62±0.33 0.08±0.05 Ant 0.02±0.03 N.A Flt 0.54±0.18 0.12±0.08 Pyr 0.59±0.19 0.15±0.13 B(b)N 0.13±0.01 0.02±0.01 Retene 0.22±0.06 0.13±0.05 C(c, d)P 0.58±0.19 0.20±0.09 B(a)A 0.11±0.03 0.04±0.02 Chr 0.05±0.03 0.04±0.03 B(e)P 0.47±0.13 0.17±0.10 B(b)F 0.55±0.13 0.19±0.12 B(k)F 0.32±0.08 0.12±0.09 B(a)P 0.43±0.10 0.14±0.09 D(a, h)A 0.17±0.09 0.08±0.02 B(g, h,i)P 0.80±0.32 0.17±0.14 Ind 0.63±0.23 0.19±0.08 Cor 0.34±0.10 0.09±0.07
Polar organic compounds (ng m−3)
ACPD
14, 2773–2798, 2014Air quality impact of Indonesian biomass burning emissions
G. Engling et al.
Title Page
Abstract Introduction
Conclusions References
Tables Figures
◭ ◮
◭ ◮
Back Close
Full Screen / Esc
Printer-friendly Version Interactive Discussion
Discussion
P
a
per
|
D
iscussion
P
a
per
|
Discussion
P
a
per
|
Discuss
ion
P
a
per
|
Table 1.Continued.
Haze period Clear days Galactosan 54.3±47.7 N.A. Arabitol 22.5±10.6 17.3±3.5 Mannitol 35.4±5.3 50.9±5.5
Water-soluble ions (µg m−3)
F−
0.18±0.08 0.01±0.003 Cl−
1.0±0.48 0.38±0.25 NO−
2 0.38±0.21 0.01±0.003
SO2−
4 19.6±8.5 3.0±0.74
NO−
3 6.4±2.2 0.76±0.36
PO3−
4 0.46±0.23 0.09±0.02
Na+ 3.7±0.64 1.1±0.40 NH+4 3.0±2.2 0.07±0.04 K+ 1.6±0.40 0.42±0.07 Ca2+ 1.7±1.4 1.1±0.21 Acetate 0.59±0.32 0.025±0.015 Formate 0.49±0.27 0.005±0.009 Methylsulfonate 0.15±0.10 N.A. Succinic 0.40±0.25 0.003±0.003 Glutorate 0.51±0.33 0.005±0.005 Malonic acid 2.3±1.6 0.008±0.007 Oxalate 5.0±3.1 0.23±0.13
Total metals (water-soluble metals) (ng m−3)
ACPD
14, 2773–2798, 2014Air quality impact of Indonesian biomass burning emissions
G. Engling et al.
Title Page
Abstract Introduction
Conclusions References
Tables Figures
◭ ◮
◭ ◮
Back Close
Full Screen / Esc
Printer-friendly Version Interactive Discussion
Discussion
P
a
per
|
D
iscussion
P
a
per
|
Discussion
P
a
per
|
Discuss
ion
P
a
per
|
Fig. 1.Air mass backward trajectories during haze and clear days in 2006 in Singapore on
ACPD
14, 2773–2798, 2014Air quality impact of Indonesian biomass burning emissions
G. Engling et al.
Title Page
Abstract Introduction
Conclusions References
Tables Figures
◭ ◮
◭ ◮
Back Close
Full Screen / Esc
Printer-friendly Version Interactive Discussion
Discussion
P
a
per
|
D
iscussion
P
a
per
|
Discussion
P
a
per
|
Discuss
ion
P
a
per
|
– in St. John’s island of Singapore
ACPD
14, 2773–2798, 2014Air quality impact of Indonesian biomass burning emissions
G. Engling et al.
Title Page
Abstract Introduction
Conclusions References
Tables Figures
◭ ◮
◭ ◮
Back Close
Full Screen / Esc
Printer-friendly Version Interactive Discussion
Discussion
P
a
per
|
D
iscussion
P
a
per
|
Discussion
P
a
per
|
Discuss
ion
P
a
per
|
at St. John’s
ACPD
14, 2773–2798, 2014Air quality impact of Indonesian biomass burning emissions
G. Engling et al.
Title Page
Abstract Introduction
Conclusions References
Tables Figures
◭ ◮
◭ ◮
Back Close
Full Screen / Esc
Printer-friendly Version Interactive Discussion
Discussion
P
a
per
|
D
iscussion
P
a
per
|
Discussion
P
a
per
|
Discuss
ion
P
a
per
|