ACPD
11, 11417–11453, 2011Aerosol properties from two Indian sites
T. Raatikainen et al.
Title Page
Abstract Introduction
Conclusions References
Tables Figures
◭ ◮
◭ ◮
Back Close
Full Screen / Esc
Printer-friendly Version Interactive Discussion
Discussion
P
a
per
|
Dis
cussion
P
a
per
|
Discussion
P
a
per
|
Discussio
n
P
a
per
|
Atmos. Chem. Phys. Discuss., 11, 11417–11453, 2011 www.atmos-chem-phys-discuss.net/11/11417/2011/ doi:10.5194/acpd-11-11417-2011
© Author(s) 2011. CC Attribution 3.0 License.
Atmospheric Chemistry and Physics Discussions
This discussion paper is/has been under review for the journal Atmospheric Chemistry and Physics (ACP). Please refer to the corresponding final paper in ACP if available.
Comparison of aerosol properties from
the Indian Himalayas and the
Indo-Gangetic plains
T. Raatikainen1,2, A.-P. Hyv ¨arinen1, J. Hatakka1, T. S. Panwar3, R. K. Hooda3, V. P. Sharma3, and H. Lihavainen1
1
Finnish Meteorological Institute, Erik Palm ´enin aukio 1, P.O. Box 503, 00101, Helsinki, Finland
2
School of Earth and Atmospheric Sciences, Georgia Institute of Technology, 311 Ferst Drive, Atlanta, GA 30332-0340, USA
3
The Energy and Resources Institute (TERI), Darbari Seth Block, IHC Complex, Lodhi Road, New Delhi 110 003, India
Received: 4 January 2011 – Accepted: 5 April 2011 – Published: 12 April 2011
Correspondence to: T. Raatikainen (tomi.raatikainen@fmi.fi)
ACPD
11, 11417–11453, 2011Aerosol properties from two Indian sites
T. Raatikainen et al.
Title Page
Abstract Introduction
Conclusions References
Tables Figures
◭ ◮
◭ ◮
Back Close
Full Screen / Esc
Printer-friendly Version Interactive Discussion
Discussion
P
a
per
|
Dis
cussion
P
a
per
|
Discussion
P
a
per
|
Discussio
n
P
a
per
|
Abstract
Gual Pahari is a polluted semi-urban background measurement site at the Indo-Gangetic plains close to New Delhi and Mukteshwar is a relatively clean background measurement site at the foothills of the Himalayas about 270 km NE from Gual Pahari and about 2 km above the nearby plains. Two years long data sets including aerosol
5
and meteorological parameters as well as modeled backward trajectories and bound-ary layer heights were compared. The purpose was to see how aerosol concentrations vary between clean and polluted sites not very far from each other. Specifically, we were exploring the effect of boundary layer evolution on aerosol concentrations. The measurements showed that especially during the coldest winter months, aerosol
con-10
centrations are significantly lower in Mukteshwar. On the other hand, the difference is smaller and also the concentration trends are quite similar from April to October. With the exception of the monsoon season, when rains are affecting on aerosol concen-trations, clear but practically opposite diurnal cycles are observed. When the lowest daily aerosol concentrations are seen during afternoon hours in Gual Pahari, there is
15
a peak in Mukteshwar aerosol concentrations. In addition to local sources and long-range transport of dust, boundary layer dynamics can explain the observed differences and similarities. When mixing of air masses is limited during the relatively cool winter months, aerosol pollutions are accumulated to the plains, but Mukteshwar is above the pollution layer. When mixing increases in the spring, aerosol concentrations are
20
increased in Mukteshwar and decreased in Gual Pahari. The effect of mixing is also clear in the diurnal concentration cycles. When daytime mixing decreases aerosol concentrations in Gual Pahari, those are increased in Mukteshwar.
1 Introduction
During the dry winter months, large areas in the southern Asia are covered by a few
25
ACPD
11, 11417–11453, 2011Aerosol properties from two Indian sites
T. Raatikainen et al.
Title Page
Abstract Introduction
Conclusions References
Tables Figures
◭ ◮
◭ ◮
Back Close
Full Screen / Esc
Printer-friendly Version Interactive Discussion
Discussion
P
a
per
|
Dis
cussion
P
a
per
|
Discussion
P
a
per
|
Discussio
n
P
a
per
|
2001, 2007; Sarkar et al., 2006; Bollasina et al., 2008; Gautam et al., 2009). The main components of the brown cloud are mineral dust from natural sources, and black car-bon, sulfate and organic aerosol from anthropogenic sources such as biomass burning, industry and transportation. Due to the dense population and regional dust sources, the highest annual aerosol concentrations are often seen at the Indo-Gangetic plains
5
in northern India, where they are blocked by the Himalayan mountain range (Sarkar et al., 2006; Bollasina et al., 2008; Gautam et al., 2009).
Aerosols have well known health effects and also their direct effects on e.g. visibility and surface radiation can be easily observed. In addition, there are strong observa-tional and modeling evidence of the effect of aerosols on regional climate (e.g. Menon
10
et al., 2002; Ramanathan et al., 2007; Bollasina et al., 2008; Satheesh et al., 2008; Gautam et al., 2009; Kuhlmann and Quaas, 2010), but the case is not that clear mainly due to complexity of aerosol-cloud-climate interactions. In addition, significant uncer-tainties are related to spatial and temporal distributions of aerosols and their chemical composition. One of the most popular research topics has been the possible effect of
15
aerosols on monsoon cycle (e.g. Ramanathan et al., 2001; Chung et al., 2002; Lau et al., 2006; Huang et al., 2007; Bollasina et al., 2008; Gautam et al., 2009; Nigam and Bollasina, 2010; Lau and Kim, 2010). This is especially important as large and densely populated areas in the southern Asia are dependent on monsoon rains. In addition, floods due to excessive monsoon rains can be very devastating.
20
Aerosol concentrations in India have been measured in several intensive field cam-paigns such as INDOEX (Ramanathan et al., 2001), ICARB (Moorthy et al., 2008) and ACE-Asia (Huebert et al., 2003). There are also long-term satellite measurements (e.g. Bollasina et al., 2008; Gautam et al., 2009; Kuhlmann and Quaas, 2010), and some long-term data series from ground-based stations in northern India (e.g. Singh
25
ACPD
11, 11417–11453, 2011Aerosol properties from two Indian sites
T. Raatikainen et al.
Title Page
Abstract Introduction
Conclusions References
Tables Figures
◭ ◮
◭ ◮
Back Close
Full Screen / Esc
Printer-friendly Version Interactive Discussion
Discussion
P
a
per
|
Dis
cussion
P
a
per
|
Discussion
P
a
per
|
Discussio
n
P
a
per
|
et al., 2010). Mukteshwar, on the other hand, is a relatively clean site at the foothills of Himalayas about 270 km NE from Gual Pahari and about 2 km above the plains (Hyv ¨arinen et al., 2009; Komppula et al., 2009). The Gual Pahari station was operat-ing from December 2007 to January 2010, which is the time period for simultaneous measurements.
5
Thanks to the above-mentioned and many other studies, annual aerosol concentra-tions cycles in northern India are fairly well known. The highest aerosol concentraconcentra-tions are seen in spring partly due to significant dust contribution. The first monsoon rains clean the air quite quickly, and the lowest annual aerosol concentrations are seen in the monsoon season. Aerosol pollutions start to increase again after the monsoon
10
season mainly due to anthropogenic pollutions. In general, aerosols are found from the lowest 5 km layer of atmosphere (e.g. Satheesh et al., 2008; Gautam et al., 2009; Kuhlmann and Quaas, 2010). The vertical distribution of aerosols is also clearly seen in measurement stations located at the Himalayas (Dumka et al., 2008; Hyv ¨arinen et al., 2009; Ram et al., 2010; Marinoni et al., 2010; Sellegri et al., 2010). Interestingly, the
15
observed annual and diurnal aerosol concentration cycles are often somewhat different than those in the plains, possibly due to boundary layer dynamics and vertical transport of pollutions (e.g. Pant et al., 2006; Dumka et al., 2008; Hyv ¨arinen et al., 2009, 2010; Komppula et al., 2009; Marinoni et al., 2010; Ram and Sarin, 2010).
The effect of boundary layer dynamic on aerosol concentrations is our main topic
20
here. We are comparing two years long data series of aerosol concentrations and meteorological parameters from the low-altitude Gual Pahari and high-altitude Muk-teshwar stations. The observations, including both annual and diurnal aerosol con-centration cycles, can be explained by local aerosol sources, long-range transport and either by vertical transport of air masses or by the lack of transport.
ACPD
11, 11417–11453, 2011Aerosol properties from two Indian sites
T. Raatikainen et al.
Title Page
Abstract Introduction
Conclusions References
Tables Figures
◭ ◮
◭ ◮
Back Close
Full Screen / Esc
Printer-friendly Version Interactive Discussion
Discussion
P
a
per
|
Dis
cussion
P
a
per
|
Discussion
P
a
per
|
Discussio
n
P
a
per
|
2 Measurement sites and instrumentation
Aerosol concentrations and optical properties as well as basic meteorological param-eters were measured at two stations in northern India. Figure 1 shows locations of the Mukteshwar, Nainital (29.47◦ N, 79.65◦ E, 2180 m above sea level) and Gual
Pa-hari, Gurgaon (28.43◦ N, 77.15◦ E, 243 m a.s.l.) stations. The distance between the
5
stations is only about 270 km, but the Mukteshwar station is located at the foothills of the Himalayas and Gual Pahari is at the densely populated Indo-Gangetic plains. The distance from Mukteshwar to the plains is less than 100 km.
Mukteshwar and Gual Pahari measurements were started in September 2005 and December 2007, respectively. The Gual Pahari station was operating till the end of
Jan-10
uary 2010. In this comparison paper we are therefore limited to the time period from December 2007 to January 2010. In addition, we will consider only those instruments and data series that are available from the both stations. The stations and their instru-mentation are already described elsewhere (Hyv ¨arinen et al., 2009, 2010; Komppula et al., 2009), so only a brief descriptions are given here.
15
2.1 Gual Pahari
Gual Pahari station was located about 40 km south from New Delhi in a semi-urban environment. The station was an air conditioned (25◦C) and insulated sea container.
PM2.5 and PM10 mass concentrations were measured by two individual Particulate Mass (PM) monitors (Thermo Scientific, beta hybrid mass monitors) from separate
in-20
lets with respective cut-offs. In addition, particle number size distribution from 4 to 850 nm was measured by a twin Differential Mobility Particle Sizer (DMPS) system. Aerosol black carbon (BC) concentration was measured by a Multiangle Absorption Photometer (MAAP) from Thermo Scientific, and scattering by a nephelometer from Ecotech. These instruments were sampling from the PM10 inlet. Meteorological
pa-25
ACPD
11, 11417–11453, 2011Aerosol properties from two Indian sites
T. Raatikainen et al.
Title Page
Abstract Introduction
Conclusions References
Tables Figures
◭ ◮
◭ ◮
Back Close
Full Screen / Esc
Printer-friendly Version Interactive Discussion
Discussion
P
a
per
|
Dis
cussion
P
a
per
|
Discussion
P
a
per
|
Discussio
n
P
a
per
|
such as sunphotometer and Aerosol Particle Sizer (APS) are not considered here, be-cause there were no corresponding instruments in the Mukteshwar station. Thorough description of the station and instrumentation is given in Hyv ¨arinen et al. (2010).
2.2 Mukteshwar
Mukteshwar station is located at the foothills of Himalayas, an area representing Indian
5
rural background. The station is an air conditioned (25 ◦C) building made of stone.
With the exception of the rain intensity, sunphotometer and APS, instrumentation is mostly the same as in the Gual Pahari station including Particulate Mass (PM) mon-itors, DMPS, nephelometer and the weather station. However, Mukteshwar BC con-centrations are measured from PM2.5inlet by an aethalometer from Magee Scientific.
10
Additional measurements not considered here include solar radiation. For full descrip-tion of the stadescrip-tion and instruments see Hyv ¨arinen et al. (2009) and Komppula et al. (2009).
2.3 Data processing
Most of the data as well as data processing has been presented in the previous
publica-15
tions (Hyv ¨arinen et al., 2009, 2010; Komppula et al., 2009). Briefly, one hour averages were first calculated from the cleaned high resolution data and these were then used in calculating daily, monthly and seasonal averages. 50% minimum data coverage was required in the averaging. All time values reported here are in local time (UTC+5.5 h). In addition to these 26 months long time series, we also present annual cycles with
20
monthly averages (12 points) and diurnal cycles with hourly averages (24 points) where the original one hour data is averaged over the whole time period. In the case of diurnal cycles, separate averages are commonly shown for each month or season depending on magnitudes of intra-annual variations. Minimum data coverage was not required in these cases, but quite often there are enough data points for a good statistics.
ACPD
11, 11417–11453, 2011Aerosol properties from two Indian sites
T. Raatikainen et al.
Title Page
Abstract Introduction
Conclusions References
Tables Figures
◭ ◮
◭ ◮
Back Close
Full Screen / Esc
Printer-friendly Version Interactive Discussion
Discussion
P
a
per
|
Dis
cussion
P
a
per
|
Discussion
P
a
per
|
Discussio
n
P
a
per
|
Aerosol concentrations in the low-altitude Gual Pahari and high-altitude Mukteshwar stations are not directly comparable due to the different air pressures. Therefore, the averaged one-hour aerosol data including number size distributions and BC, PM2.5and PM10 mass concentrations as well as absorption and scattering coefficients were first converted to the STP conditions (273.15 K and 1013.25 hPa) using constant station
5
temperatures (both thermostated to 298.15 K) and measured ambient air pressures. Due to gaps in the pressure data, monthly average pressures were used in the conver-sion. This is a good approximation as inter-annual and day-to-day pressure variations are generally less than 1% of the calculated monthly averages.
2.4 Climate
10
2.4.1 Rainfall
There were no rainfall measurements in Mukteshwar, so district-wise monthly rain-fall data from the India Meteorological Department (IMD) web pages (http://www.imd. gov.in) was used. Rainfall in Mukteshwar was calculated as an average of those at Nainital and Almora, which are the two closest measurement stations. Similarly, Gual
15
Pahari rainfall is an average of those at Gurgaon, Faridabad and Delhi stations. Mea-sured high-resolution Gual Pahari rainfall data is not used here, because there are no corresponding data from the Mukteshwar station. However, calculations showed that monthly sums of the measured rainfalls are quite similar to the currently used monthly rainfalls from the IMD. The largest difference between these two monthly rainfalls is
20
76 mm (September 2009), which is rather high, but still clearly smaller than their usual differences from the Mukteshwar rainfall.
2.4.2 Seasons
Four seasons including winter, pre-monsoon, monsoon and post-monsoon can be distinguished. The relatively cold winter extends from December to February.
ACPD
11, 11417–11453, 2011Aerosol properties from two Indian sites
T. Raatikainen et al.
Title Page
Abstract Introduction
Conclusions References
Tables Figures
◭ ◮
◭ ◮
Back Close
Full Screen / Esc
Printer-friendly Version Interactive Discussion
Discussion
P
a
per
|
Dis
cussion
P
a
per
|
Discussion
P
a
per
|
Discussio
n
P
a
per
|
Temperatures are increasing quickly during the dry and hot pre-monsoon season from March to the onset of monsoon. Majority of the annual rainfall in India comes from the monsoon rains, which are expected to start by the end of June in the Delhi area. The post-monsoon season extends from the monsoon withdrawal to the end of November.
India Meteorological Department determines the monsoon onset and withdrawal
5
days for each year. The exact days are given for a few key locations not including our station coordinates. Therefore, those had to be approximated from the IMD mon-soon onset and withdrawal maps and dates given for nearby locations. In the first year monsoon onset was 16 June 2008 and withdrawal day was 28 September 2008 for both sites (Tyagi et al., 2009). In the next year onset dates were 29 June 2009
10
and 30 June 2009 for Mukteshwar and Gual Pahari, respectively, and the withdrawal day was again the same 28 September 2009 (Tyagi et al., 2010). For simplicity, how-ever, the same day (29 June 2009) is chosen as the onset date for the 2009 monsoon season.
2.5 Backward trajectories
15
Five days long backward trajectories were calculated for every three hours with the FLEXTRA model (Stohl et al., 1995; Stohl and Seibert, 1998). The model pressure levels, which are about 20–40 hPa lower than the local ambient air pressures, were 950 hPa and 750 hPa for Gual Pahari and Mukteshwar, respectively.
In addition to averages of the basic model outputs such as specific humidity and
alti-20
tudes, total trajectory length and average direction were calculated for each trajectory. Total trajectory length is just the sum of distances between trajectory coordinate points, and the average direction is the direction of a sum vector composed of vectors pointing from the stations to each trajectory coordinate point. It is expected that these trajectory directions represent air mass origin and especially long-range transport better than
25
ACPD
11, 11417–11453, 2011Aerosol properties from two Indian sites
T. Raatikainen et al.
Title Page
Abstract Introduction
Conclusions References
Tables Figures
◭ ◮
◭ ◮
Back Close
Full Screen / Esc
Printer-friendly Version Interactive Discussion
Discussion
P
a
per
|
Dis
cussion
P
a
per
|
Discussion
P
a
per
|
Discussio
n
P
a
per
|
2.6 Boundary layer heights
Planetary Boundary Layer (PBL) heights, given as meters above ground level, are based on European Centre for Medium-Range Weather Forecasts (ECMWF) model runs for 3 h intervals. Here station PBL heights are calculated as a distance weighted average of PBL heights at the four closest integer coordinate points. In addition to the
5
common daily, monthly and seasonal averages, also daily maximum PBL heights and related monthly and seasonal averages were calculated. More information about the calculations and a figure showing the PBL heights are given in the Supplement.
3 Results
The available data including meteorological parameters, trajectories, and aerosol
num-10
ber concentrations, optical properties and mass concentrations are presented here. The observed differences and similarities are explained with the focus on boundary layer dynamics. Due to the large amount of data and because the data is available from the previous publications (Hyv ¨arinen et al., 2009, 2010; Komppula et al., 2009), it is neither practical nor necessary to show every possible data series and annual and
15
diurnal cycle here. On the other hand, it can be quite difficult to compare Gual Pahari and Mukteshwar properties when the data is shown in separate publications. There-fore, we have chosen the following convention. Most full time series are shown in the main text as these are the basis of all further calculations and they also show our data coverage and possible inter-annual differences. It is often possible to see the annual
20
cycles from these time series, but for convenience, selected annual cycles are also described with monthly or seasonal averages; these are shown in the Supplement. Di-urnal cycles are important for our conclusions, but again, as these are already shown in the previous publications, only a few selected diurnal cycles are shown in the main text and the rest are left to the Supplement.
ACPD
11, 11417–11453, 2011Aerosol properties from two Indian sites
T. Raatikainen et al.
Title Page
Abstract Introduction
Conclusions References
Tables Figures
◭ ◮
◭ ◮
Back Close
Full Screen / Esc
Printer-friendly Version Interactive Discussion
Discussion
P
a
per
|
Dis
cussion
P
a
per
|
Discussion
P
a
per
|
Discussio
n
P
a
per
|
For general interest, seasonal averages of the data series are shown in Table 1. All concentration values and optical properties are given at the STP conditions. Number and volume concentrations are integrated from the number size distributions for the size ranges of the DMPS instruments. In the case of 1 gcm−3 particle density, the
non-standard particle volume unit (µcm3m−3) allows direct comparison with the mass
5
concentrations.
3.1 Meteorological data
Due to the lack of clear long-term trends and technical difficulties in describing average wind directions, time series of wind directions (clockwise direction from north) and wind speeds are shown in the Supplement (Figs. S2 and S3). It can be concluded that wind
10
speeds are quite low being generally below 2 m s−1, and a weak annual wind speed
cycle can only be seen in Gual Pahari where wind speeds are slightly lower during winter. There seems to be two dominant wind sectors, roughly west–north and a wide sector in east. These wind sectors are clear from Fig. S4, where wind directions are shown as a monthly probability distributions. There are no clear annual cycles in the
15
Gual Pahari wind directions, but it looks like the eastern wind sector is dominating during monsoon seasons in Mukteshwar.
Time series of the meteorological data including monthly rainfall, relative humidity (RH), temperature and ambient pressure are shown in Fig. 2. Because of the different altitudes, Mukteshwar temperatures and pressures are lower than those at the Gual
20
Pahari. In addition, Mukteshwar monthly rainfalls are higher than those at the Gual Pahari; the simple explanation is that air masses moving uphill are more likely to form rain. Annual cycles of these meteorological parameters depend strongly on solar ra-diation. The low pressure is formed in the spring, when the dry and quickly warming air masses start to rise. This low pressure draws humid air masses from the Indian
25
ACPD
11, 11417–11453, 2011Aerosol properties from two Indian sites
T. Raatikainen et al.
Title Page
Abstract Introduction
Conclusions References
Tables Figures
◭ ◮
◭ ◮
Back Close
Full Screen / Esc
Printer-friendly Version Interactive Discussion
Discussion
P
a
per
|
Dis
cussion
P
a
per
|
Discussion
P
a
per
|
Discussio
n
P
a
per
|
of increased monsoon season cloudiness is also clearly visible. Both Gual Pahari and Mukteshwar relative humidities are highest during the monsoon season and low dur-ing the hot and dry pre-monsoon season. Interestdur-ingly, relative humidities are clearly different during the post-monsoon season and winter. One explanation for this is that when Gual Pahari is in the pollution layer, Mukteshwar air masses are at least partly
5
originating from higher altitudes. In addition, much of this difference comes from the different diurnal cycles.
Diurnal cycles of RH, temperature, and wind speed and direction are shown in the Supplement (Figs. S5 and S6). It seems that the Gual Pahari RH cycles can be ex-plained based on the diurnal temperature cycles, but this is not the case in Mukteshwar.
10
Namely, Mukteshwar temperature variations are much lower, and especially in winter months, temperature minimum and RH maximum are not seen at the same time. Day-time transport of moist air masses from lower altitudes is an additional explanation for the observations. This explanation is also discussed in Sect. 3.2.1, where measured and modeled specific humidities are compared.
15
Gual Pahari wind speeds have clear diurnal cycles with maximum during days, but this is not the case in Mukteshwar, where wind speeds seem to vary in a time scale of few days. On the other hand, Mukteshwar wind directions have very strong diurnal cycles with mainly easterly winds during days and westerly winds during evenings and nights. These dominant wind sectors were also seen in the annual wind directions
20
(Fig. S4). With the exception of the monsoon season, also Gual Pahari wind directions have clear diurnal cycles. Interestingly, Gual Pahari and Mukteshwar diurnal wind di-rection patterns are nearly opposite; the difference between wind directions is close to 180◦ in the daytime and otherwise about 90◦. This may have something to do with
local topography and air flows in the mountain region.
25
3.2 Trajectories
ACPD
11, 11417–11453, 2011Aerosol properties from two Indian sites
T. Raatikainen et al.
Title Page
Abstract Introduction
Conclusions References
Tables Figures
◭ ◮
◭ ◮
Back Close
Full Screen / Esc
Printer-friendly Version Interactive Discussion
Discussion
P
a
per
|
Dis
cussion
P
a
per
|
Discussion
P
a
per
|
Discussio
n
P
a
per
|
averaged over the five days of backward calculations. Trajectory lengths were calcu-lated by summing the distances between trajectory coordinate points. Average direc-tions are calculated by averaging vectors pointing to the trajectory coordinate points. Because longer vectors have more weight in the averages, average directions describe mostly long-range transport. Time series of the trajectory directions (clockwise
direc-5
tion from north), total lengths, average altitudes and specific humidities as well as their monthly averages are shown in Fig. 3.
In good agreement with the expectations, the highest specific humidities are seen in the monsoon season. Those are slightly higher in Gual Pahari, but this is not a surprise as warmer air can contain more water vapor. Annual cycles of the specific humidities
10
are very similar.
Also the trajectory directions seem to be quite similar. Just as in the case of wind directions, there are two dominating sectors. For clarity, these are shown in the Sup-plement (Fig. S7) as a monthly probability distributions. It seems that trajectory and wind (Fig. S4) directions are somewhat different especially in the case of Mukteshwar,
15
but a strong correlation was not even expected as trajectory directions describe long-range transport and the hilly terrain is likely affecting on wind directions. During the monsoon season both sites have air masses from both Bay of Bengal (SE) and Ara-bian Sea (SW) directions. At other times, westerly air masses dominate. This is what was expected based on the monsoon dynamics.
20
During the post-monsoon and winter months, Mukteshwar air masses are originat-ing from high altitudes, usually about 4000 m a.s.l. or at least well above the station level (2180 m a.s.l.). During the monsoon season, however, air masses approaching Mukteshwar are actually ascending. This is the case when average altitudes are lower than the end point altitudes shown by the green lines in Fig. 3. Gual Pahari trajectory
25
altitudes have similar annual trends, but the values are roughly 2000 m lower mainly due to different station altitudes.
ACPD
11, 11417–11453, 2011Aerosol properties from two Indian sites
T. Raatikainen et al.
Title Page
Abstract Introduction
Conclusions References
Tables Figures
◭ ◮
◭ ◮
Back Close
Full Screen / Esc
Printer-friendly Version Interactive Discussion
Discussion
P
a
per
|
Dis
cussion
P
a
per
|
Discussion
P
a
per
|
Discussio
n
P
a
per
|
Mukteshwar air masses are coming from the free troposphere where wind speeds are commonly higher. The explanation is in good agreement with the low aerosol concen-trations; even if air masses are coming from west, they are actually crossing the plains above the pollution layer. Both Mukteshwar and Gual Pahari average trajectory alti-tudes are low and trajectory lengths and directions are similar during summer months
5
from May to August. This indicates that Mukteshwar and Gual Pahari air masses have similar origin and air masses are well-mixed at least up to the level of Mukteshwar station.
3.2.1 Diurnal humidity cycles
Because the above mentioned quantities (altitude, specific humidity, etc.) are
aver-10
aged over the five days long trajectories, diurnal cycles are not expected to be seen and this was also confirmed by calculations. On the other hand, diurnal cycles are possible when only the last coordinate points representing Gual Pahari or Mukteshwar stations are included. Indeed, this is the case with the specific humidities in Muk-teshwar. The diurnal cycle is quite weak at least compared to the clear monthly and
15
seasonal variations. Therefore, these long-term variations were removed from the data by dividing each q-value by its daily average (from midnight to midnight). The same treatment was applied to the RH and temperature data sets as well as spe-cific humidities calculated from the meteorological data. The resulting diurnal cycles, which are described by hourly median values, are shown in Fig. 4. As mentioned
20
above, specific humidities were also calculated from meteorological data using equa-tionq=RH/(100%)PwsatMw/(PairMair), wherePwsatis temperature dependent saturation vapor pressure of water,Pair is ambient pressure, andMwandMair are (mean) molec-ular weights of water and air, respectively. The specific humidities from the FLEXTRA model and those based on the meteorological data are generally quite similar. They
25
ACPD
11, 11417–11453, 2011Aerosol properties from two Indian sites
T. Raatikainen et al.
Title Page
Abstract Introduction
Conclusions References
Tables Figures
◭ ◮
◭ ◮
Back Close
Full Screen / Esc
Printer-friendly Version Interactive Discussion
Discussion
P
a
per
|
Dis
cussion
P
a
per
|
Discussion
P
a
per
|
Discussio
n
P
a
per
|
In the absence of relevant specific humidity cycle and because the anti-correlation between temperature and RH is nearly perfect, we can conclude that the diurnal RH cycle in Gual Pahari depends mainly on temperature. This is not the case in Muktesh-war, where RH cycle depends also on that of specific humidity. The effect of specific humidity is especially clear during the increasing specific humidity period around
mid-5
day, when RH starts to increase even if temperature is nearly constant, and also during the decrease after 18:00 in the evening. Again, the explanation for the Mukteshwar specific humidity cycle is that humid air masses are transported from lower altitudes.
3.3 Aerosol measurements
Aerosol measurements include number size distributions, optical properties and mass
10
concentrations. When applicable, values are given at the STP conditions.
3.3.1 Number size distributions
Particle number size distributions were measured by a twin DMPS system in Gual Pahari (Hyv ¨arinen et al., 2010) and a single DMPS unit in Mukteshwar (Hyv ¨arinen et al., 2009; Komppula et al., 2009). The Mukteshwar DMPS detects particles from
15
size range 10–800 nm and the Gual Pahari units are for 4–58 nm and 31–850 nm size ranges. Unfortunately, both Gual Pahari DMPS units were operating simultaneously only about 16% of the time, which means that the conclusions for Gual Pahari are somewhat uncertain. For this reason, the data is shown in the Supplement.
The full data time series described with total particle number concentrations are
20
shown in Fig. S8. These as well as all following values are limited to the instrument size ranges which are 10–800 nm and 4–850 nm for Mukteshwar and Gual Pahari, respectively. The high pre-monsoon season peaks and low monsoon season concen-trations are clear in the Mukteshwar data series, but due to missing data it is difficult to see the trends from the Gual Pahari data series. Averaging, however, helps a lot.
25
ACPD
11, 11417–11453, 2011Aerosol properties from two Indian sites
T. Raatikainen et al.
Title Page
Abstract Introduction
Conclusions References
Tables Figures
◭ ◮
◭ ◮
Back Close
Full Screen / Esc
Printer-friendly Version Interactive Discussion
Discussion
P
a
per
|
Dis
cussion
P
a
per
|
Discussion
P
a
per
|
Discussio
n
P
a
per
|
particle formation events are strongly affecting on the Gual Pahari pre-monsoon sea-son number size distribution. In fact, in Gual Pahari new particle formation is seen in 70% of the days with available nucleation mode data through the year (Hyv ¨arinen et al., 2010), but Mukteshwar new particle formation events happen mainly in March, April and May (Komppula et al., 2009; Neitola et al., 2010). These events have a clear
5
effect on sub-40 nm size range, but otherwise Gual Pahari and Mukteshwar size distri-butions have very similar shapes. The dominating sub-micron particle mode is around 100 nm during post-monsoon season and winter, and slightly smaller than that during monsoon season.
For further calculations, number concentrations were split into two additional size
10
sections: nucleation mode particles are described with sub-40 nm size range and ac-cumulation mode is represented by the remaining size range from 40 nm up to the largest measured size. The 40 nm limit, which is lower than the common definition of 100 nm, was chosen for two reasons: nucleation events seem to have the greatest effect on the sub-40 nm size range (Fig. S9) and these size ranges are detected
in-15
dependently by the Gual Pahari DMPS units. This means that the data coverage for the size fractions is actually slightly higher than the original 16%. In addition to these number concentrations, total particle volume was calculated from the size distributions. Annual cycles of these number concentrations and total particle volumes are shown in Fig. S10. High aerosol concentrations are seen in the pre-monsoon season and in
20
Gual Pahari especially during winter months. Due to the high frequency of nucleation events, the pre-monsoon season peaks are dominated by the sub-40 nm particles, but otherwise the larger particles are dominating. Total particle volumes correlate well with the accumulation mode particle number concentrations. This is what was expected as the newly formed particles have very low volumes.
25
ACPD
11, 11417–11453, 2011Aerosol properties from two Indian sites
T. Raatikainen et al.
Title Page
Abstract Introduction
Conclusions References
Tables Figures
◭ ◮
◭ ◮
Back Close
Full Screen / Esc
Printer-friendly Version Interactive Discussion
Discussion
P
a
per
|
Dis
cussion
P
a
per
|
Discussion
P
a
per
|
Discussio
n
P
a
per
|
and particles from lower altitudes to Mukteshwar (Neitola et al., 2010). Similar de-lay is also seen in the other diurnal cycles, and again it is assumed that these parti-cles are mainly transported from lower altitudes. With the exception of the nucleation mode, particle number and volume concentration cycles are very similar to the cycles of aerosol optical properties and mass concentrations. These will be presented in the
5
following sections.
3.3.2 Optical properties
Scattering coefficients were measured by nephelometers in Gual Pahari and Muk-teshwar stations, but absorption coefficients were measured by different instru-ments: aethalometer and Multiangle Absorption Photometer (MAAP) in Mukteshwar
10
and Gual Pahari stations, respectively. The both nephelometers measure scattering using 525 nm wave length and the aethalometer measures absorption coefficient for 520 nm wave length. The MAAP, on the other hand, measures absorption using 637 nm wave length (M ¨uller et al., 2010) so this value was converted to 520 nm. The wave length (λ) dependence of absorption can be expressed asσabs=K λ−α, whereK and
15
α are absorption ˚Angstr ¨om coefficients. In practice, the conversion from 637 nm to 520 nm is not sensitive on the exponentα, so value 1.2, which is common in Muktesh-war (Hyv ¨arinen et al., 2009), was selected for the conversion. Theα can be slightly lower in the polluted Gual Pahari area (Soni et al., 2010), but for example, if the aerosol would be pure black carbon withα=1, the correct absorption coefficient would be only
20
5% lower.
Single Scattering Albedo, SSA=σscat/(σscat+σabs), was calculated from the absorp-tion (σabs) and scattering (σscat) coefficients. In the comparison it must be kept in mind that the aethalometer was connected to PM2.5 inlet and the MAAP was connected to PM10 inlet. For more information about the aerosol optical properties, see Hyv ¨arinen
25
ACPD
11, 11417–11453, 2011Aerosol properties from two Indian sites
T. Raatikainen et al.
Title Page
Abstract Introduction
Conclusions References
Tables Figures
◭ ◮
◭ ◮
Back Close
Full Screen / Esc
Printer-friendly Version Interactive Discussion
Discussion
P
a
per
|
Dis
cussion
P
a
per
|
Discussion
P
a
per
|
Discussio
n
P
a
per
|
The data time series are shown in Fig. 5, where Mukteshwar scattering and absorp-tion coefficients are multiplied by a factor of four. It looks like the highest absorption and scattering coefficients are seen during winter and pre-monsoon seasons in Gual Pahari, and during pre-monsoon season in Mukteshwar. These annual cycles are sim-ilar to those of the particle number concentrations discussed in the previous section.
5
For clarity, the annual cycles are also shown in the Supplement (Fig. S12). From there it is clear that Gual Pahari SSA is lowest during monsoon season and highest during winter. In Mukteshwar, on the other hand, SSA does not seem to vary with month. There are a few explanations for the Gual Pahari SSA cycle. First of all, highly absorb-ing black carbon may have higher concentrations in the monsoon season, because wet
10
deposition favors hygroscopic particles. In addition, the higher SSA values in the post-monsoon season and early winter can be related to the accumulation of anthropogenic emissions (the brown cloud); these particles are often more scattering due to smaller sizes and composition dominated by sulfate and organic material.
Diurnal cycles of scattering, absorption and SSA are also shown in the Supplement
15
(Fig. S13). In general, scattering and absorption coefficients have the highest diurnal variations during winter and pre-monsoon season. Again, these diurnal cycles can be related to those of the aerosol concentrations. Mukteshwar SSA does not have clear cycle even if it is seen in scattering and absorption, but this just means that aerosol properties are not changing during the day. Gual Pahari SSA, on the other hand,
20
has the highest diurnal variations during summer months when there are least diurnal variations in the absorption and scattering coefficients. It looks like the reason for the SSA cycle is that aerosol is more absorbing during night, possibly due to limited mixing and local black carbon emissions from road traffic or biomass burning. In addition, it is possible that the daytime dilution is more efficient for BC due to the lower density
25
ACPD
11, 11417–11453, 2011Aerosol properties from two Indian sites
T. Raatikainen et al.
Title Page
Abstract Introduction
Conclusions References
Tables Figures
◭ ◮
◭ ◮
Back Close
Full Screen / Esc
Printer-friendly Version Interactive Discussion
Discussion
P
a
per
|
Dis
cussion
P
a
per
|
Discussion
P
a
per
|
Discussio
n
P
a
per
|
3.3.3 Mass concentrations
Results of the remaining aerosol measurements including PM10, PM2.5 and black car-bon (BC) mass concentrations are shown in Fig. 6. Again, there seems to be a pre-monsoon season maximum and in the case of Gual Pahari also a winter maximum. Interestingly, there is a clear maximum in Mukteshwar mass concentrations during the
5
2008 post-monsoon season, but this is not seen in the next year. Based on our long-term data from the station, it looks like the 2009 post-monsoon season was exception-ally clean.
Not only these measured mass concentrations, but also their differences and ra-tios can tell something about the aerosol. For example, BC mass fraction indicates
10
contribution of the biomass burning on total aerosol loading. In addition, dust is quite often seen in the coarse particle mass represented by the difference between PM10 and PM2.5, whereas the fine mode represented by PM2.5is more likely from secondary sources (Hyv ¨arinen et al., 2011b). Again, it should be noted that the limits are not following the common definitions of aerosol size ranges. Time series of these mass
15
fractions and the coarse mode mass concentrations are shown in the Supplement (Fig. S14). The mass fraction time series are quite spiky, but there are observable annual cycles.
Annual cycles of the mass concentrations and fractions are shown in the Supplement (Fig. S15). The highest average aerosol concentrations in Gual Pahari are seen in
win-20
ter, but in Mukteshwar those are seen in the pre-monsoon season. BC concentration is somewhat exceptional as it is quite high during the whole winter in Mukteshwar. Do-mestic heating is a possible explanation for this as winter temperatures can be quite low there. Lowest mass concentrations in both stations are usually seen in the mon-soon season when the frequent rains are cleaning the air. In general, these annual
25
ACPD
11, 11417–11453, 2011Aerosol properties from two Indian sites
T. Raatikainen et al.
Title Page
Abstract Introduction
Conclusions References
Tables Figures
◭ ◮
◭ ◮
Back Close
Full Screen / Esc
Printer-friendly Version Interactive Discussion
Discussion
P
a
per
|
Dis
cussion
P
a
per
|
Discussion
P
a
per
|
Discussio
n
P
a
per
|
are quite similar to those of the PM10 and PM2.5, but the coarse mode mass fractions are interesting. There is one maximum in the pmonsoon season, which can be re-lated to dust (Hyv ¨arinen et al., 2011b), and another maximum in the monsoon season. As noted by Hyv ¨arinen et al. (2010), this is somewhat surprising as wet deposition favors larger particles. Black carbon mass fractions are quite noisy, but it seems that
5
there is one maximum in the winter possibly due to domestic heating, and another max-imum during the monsoon season. One explanation for the latter is that wet deposition processes favor hygroscopic particles and BC is not hygroscopic.
Diurnal cycles of the mass concentrations and fractions are in shown in the Supple-ment (Fig. S16). Once again, diurnal cycles of the BC, PM10 and PM2.5 are similar
10
to those of the aerosol optical properties and number concentrations. There are no clear diurnal cycles in the monsoon season, but during the other seasons, Gual Pa-hari concentrations have a clear morning rush hour peak followed by a rapid decrease due to dilution and again increase in the evening. Concentrations in Mukteshwar are practically constant until polluted air masses arrive around noon.
15
The other calculated quantities have again quite interesting diurnal cycles. The most significant feature is the midday peak in the coarse mode mass concentrations and fractions seen in Mukteshwar during winter and pre-monsoon seasons. This peak is seen too early to be originating from the Indo-Gangetic plains. On the other hand, it matches well with the vertical mixing, so it might be dust originating from above, either
20
from arid slopes of the Himalayas or from free troposphere, where dust layers are sometimes seen (Gautam et al., 2009; Kuhlmann and Quaas, 2010; Ram et al., 2010; Hyv ¨arinen et al., 2011a). It is also possible that the peaks are just local wind-blown dust or dust from farming activity or road traffic (Marinoni et al., 2010).
3.4 Effect of boundary layer evolution on aerosol concentrations
25
ACPD
11, 11417–11453, 2011Aerosol properties from two Indian sites
T. Raatikainen et al.
Title Page
Abstract Introduction
Conclusions References
Tables Figures
◭ ◮
◭ ◮
Back Close
Full Screen / Esc
Printer-friendly Version Interactive Discussion
Discussion
P
a
per
|
Dis
cussion
P
a
per
|
Discussion
P
a
per
|
Discussio
n
P
a
per
|
Dumka et al., 2008; Hyv ¨arinen et al., 2009, 2010; Komppula et al., 2009; Marinoni et al., 2010; Ram and Sarin, 2010). In this section we will summarize our findings from the polluted low-altitude site Gual Pahari and the clean high-altitude site Mukteshwar. The findings, which are clearly supporting the previous conclusions, show that boundary layer evolution is an important factor for both diurnal and annual aerosol concentration
5
cycles. Only the PM2.5and PM10 mass concentrations are shown here; they have the best data coverage and the other aerosol data series have similar seasonal and diurnal cycles anyway.
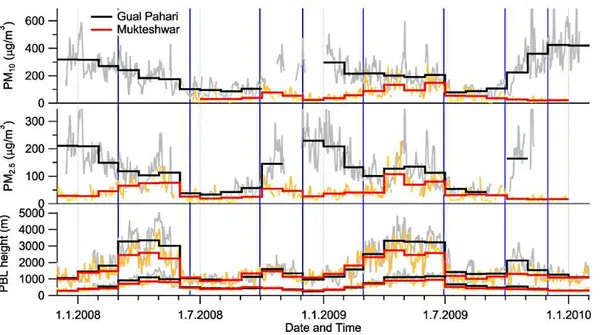
Starting from the annual cycles of aerosol mass concentrations, Fig. 7 shows daily and monthly averages of maximum planetary boundary layer (PBL) heights as well as
10
PM10 and PM2.5 mass concentrations from the stations. The highest concentrations peaks are not included. Vertical mixing of air masses is limited during winter months when PBL heights have their lowest annual values. Due to strong local and regional aerosol sources, very high aerosol concentrations are seen in Gual Pahari. On the other hand, Mukteshwar seems to be above this pollution layer commonly known as
15
a brown cloud. When PBL height starts to increase in the end of winter, polluted and clean air masses start to mix. As a result, aerosol concentrations are increased in Mukteshwar and decreased in Gual Pahari. Already in the beginning of the pre-monsoon season, atmosphere seems to be well mixed at least up to the levels of Mukteshwar station. The high aerosol concentration peaks seen during the dry and
20
hot pre-monsoon season are most likely from dust events. The first monsoon rains clean the air, and the concentrations stay low till the end of monsoon season. When the rains become more sporadic, aerosols concentrations start to increase again. Because PBL heights are already quite low, only a small increase in seen in Mukteshwar; most pollutions are accumulated to the lowest levels of atmosphere. This annual cycle of the
25
ACPD
11, 11417–11453, 2011Aerosol properties from two Indian sites
T. Raatikainen et al.
Title Page
Abstract Introduction
Conclusions References
Tables Figures
◭ ◮
◭ ◮
Back Close
Full Screen / Esc
Printer-friendly Version Interactive Discussion
Discussion
P
a
per
|
Dis
cussion
P
a
per
|
Discussion
P
a
per
|
Discussio
n
P
a
per
|
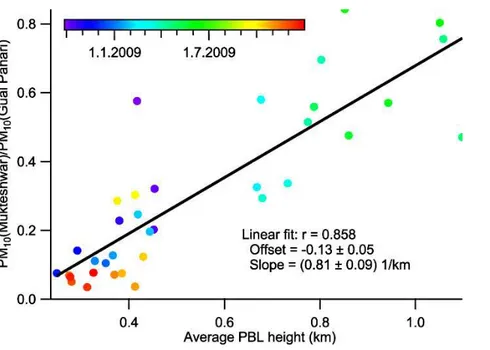
Interestingly, it looks like aerosol mass concentrations in Mukteshwar depend di-rectly on boundary layer height. Actually higher boundary layer height means that Mukteshwar aerosol concentrations are approaching those at the Gual Pahari. Indeed, calculations showed that when monsoon seasons are ignored both Mukteshwar mass concentrations and Mukteshwar/Gual Pahari concentration ratios are strongly
corre-5
lated with PBL heights. Monsoon seasons are exceptions as aerosol concentrations depend strongly on wet deposition. An example of a good correlation between Muk-teshwar/Gual Pahari PM10mass concentration ratio and PBL height is shown in Fig. 8. Each point is based on ten day running mean of the non-monsoon season PM10 con-centrations and Mukteshwar PBL height. Pearson correlation coefficient for the linear
10
fit is 0.858.
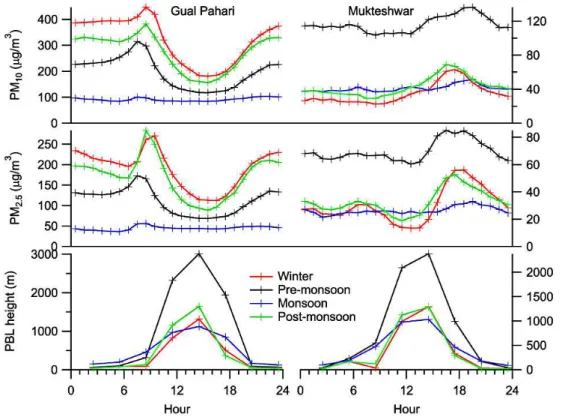
PBL height depends strongly on time of day being low during nights and high during early afternoons, and this is also seen in diurnal aerosol concentrations cycles. Fig-ure 9 shows diurnal cycles for PM10, PM2.5 and PBL height in Gual Pahari (left) and Mukteshwar (right). With the exception of the monsoon season, when rains are
af-15
fecting on aerosol concentrations, clear diurnal concentration cycles are seen. In Gual Pahari, the start of human activities can explain the morning concentration peaks. Dilu-tion of polluDilu-tions due to mixing of air masses, which is represented by the PBL height, is the explanation for the daytime concentration minimum. Again, the explanation for the Mukteshwar concentration cycles is based on mixing of local clean air masses
20
with polluted air masses from the plains. This is also the explanation for the observed specific humidity and RH cycles (Sect. 3.2.1). Because the most polluted air masses are coming from the Indo-Gangetic plains, about 2000 m below a few tens of kilome-ters SW from the Mukteshwar station, there is a delay in the concentration increase. As seen in the PM2.5cycle, aerosol concentrations are first decreased in the morning
25
ACPD
11, 11417–11453, 2011Aerosol properties from two Indian sites
T. Raatikainen et al.
Title Page
Abstract Introduction
Conclusions References
Tables Figures
◭ ◮
◭ ◮
Back Close
Full Screen / Esc
Printer-friendly Version Interactive Discussion
Discussion
P
a
per
|
Dis
cussion
P
a
per
|
Discussion
P
a
per
|
Discussio
n
P
a
per
|
surprising as larger particles have higher deposition velocities. The best explanation is that these possibly dust particles are from different sources.
4 Conclusions
We presented and compared two years long series of meteorological, trajectory and aerosol data from a urban and a background sites in northern India. The
semi-5
urban site Gual Pahari is close to New Delhi at the Indo-Gangetic plains and the back-ground site Mukteshwar is at foothills of the Himalayas about 2000 m above the nearby plains.
Local sources and long-range transport have a clear effect on aerosol concentra-tions, but there are some interesting features in the diurnal and annual cycles that
10
seem to depend on mixing and transport of air masses. The importance of boundary layer dynamics has been noted in previous studies (Dumka et al., 2008; Hyv ¨arinen et al., 2009, 2010; Komppula et al., 2009; Marinoni et al., 2010), and here we have shown further evidence for this. Planetary boundary layer (PBL) heights are low dur-ing the relatively cool winter months. Because mixdur-ing of air masses is highly limited,
15
aerosol pollutions are accumulated to the plains and Gual Pahari. The high altitude site Mukteshwar, on the other hand, is above this pollution layer commonly known as a brown cloud. When mixing increases in the early spring, concentrations are increased in Mukteshwar and decreased in Gual Pahari. Monsoon rains have a clear effect on aerosol concentrations, but aerosol pollutions start to accumulate to the plains soon
20
after the rainy season. The effect of mixing is also seen in the diurnal cycles. Namely, increased daytime mixing decreases aerosol concentrations in Gual Pahari, but this is seen as an increase in Mukteshwar.
The observed Mukteshwar and Gual Pahari aerosol concentrations can be explained well by the effect of boundary layer dynamics, and this explanation is also supported by
25
ACPD
11, 11417–11453, 2011Aerosol properties from two Indian sites
T. Raatikainen et al.
Title Page
Abstract Introduction
Conclusions References
Tables Figures
◭ ◮
◭ ◮
Back Close
Full Screen / Esc
Printer-friendly Version Interactive Discussion
Discussion
P
a
per
|
Dis
cussion
P
a
per
|
Discussion
P
a
per
|
Discussio
n
P
a
per
|
two years is rather short time period for annual cycles. There were also some open questions. Namely, a midday maximum was seen in Mukteshwar coarse particle (2.5– 10 µm) mass concentration when the sub-2.5 µm maximum was seen later in the af-ternoon. It was hypothesized that these larger particles are dust possibly from higher altitudes. Further evidence such as measurements of particle chemical composition or
5
horizontal distributions is definitely needed.
Supplementary material related to this article is available online at: http://www.atmos-chem-phys-discuss.net/11/11417/2011/
acpd-11-11417-2011-supplement.pdf.
Acknowledgements. Measurements in the Gual Pahari station were funded by the European
10
Integrated project on Aerosol Cloud Climate and Air Quality Interactions, EUCAARI. We are also grateful for The Ministry of Foreign Affairs of Finland for the funding of the Mukteshwar measurements. Timo Anttila and Ari Halm are acknowledged for technical assistance and Pekka Kolmonen is acknowledged for the Mukteshwar nephelometer truncation calculations. TERI’s staff is acknowledged for their valuable routine maintenance of instruments in Gual
15
Pahari and Mukteshwar stations.
References
Bollasina, M., Nigam, S., and Lau, K.-M.: Absorbing aerosols and summer monsoon evolution over South Asia: An observational portrayal, J. Clim., 21, 3221–3239, 2008. 11419
Chung, C. E., Ramanathan, V., and Kiehl, J. T.: Effects of the South Asian absorbing haze
20
on the northeast monsoon and surface–air heat exchange, J. Clim., 15, 2462–2476, 2002. 11419
Dumka, U. C., Moorthy, K. K., Pant, P., Hegde, P., Sagar, R., and Pandey, K.: Physical and optical characteristics of atmospheric aerosols during ICARB at Manora Peak, Nainital: A sparsely inhabited, high-altitude location in the Himalayas, J. Earth Syst. Sci., 117, 399–405,
25
ACPD
11, 11417–11453, 2011Aerosol properties from two Indian sites
T. Raatikainen et al.
Title Page
Abstract Introduction
Conclusions References
Tables Figures
◭ ◮
◭ ◮
Back Close
Full Screen / Esc
Printer-friendly Version Interactive Discussion
Discussion
P
a
per
|
Dis
cussion
P
a
per
|
Discussion
P
a
per
|
Discussio
n
P
a
per
|
Gautam, R., Hsu, N. C., Lau, K.-M., and Kafatos, M.: Aerosol and rainfall variability over the Indian monsoon region: distributions, trends and coupling, Ann. Geophys., 27, 3691–3703, doi:10.5194/angeo-27-3691-2009, 2009. 11419, 11420, 11435
Huang, Y., Chameides, W. L., and Dickinson, R. E.: Direct and indirect effects of anthro-pogenic aerosols on regional precipitation over east Asia, J. Geophys. Res., 112, D03212,
5
doi:10.1029/2006JD007114, 2007. 11419
Huebert, B. J., Bates, T., Russell, P. B., Shi, G., Kim, Y. J., Kawamura, K., Carmichael, G., and Nakajima, T.: An overview of ACE-Asia: Strategies for quantifying the relation-ships between Asian aerosols and their climatic impacts, J. Geophys. Res., 108, 8633, doi:10.1029/2003JD003550, 2003. 11419
10
Hyv ¨arinen, A.-P., Lihavainen, H., Komppula, M., Sharma, V. P., Kerminen, V.-M., Panwar, T. S., and Viisanen, Y.: Continuous measurements of optical properties of atmospheric aerosols in Mukteshwar, northern India, J. Geophys. Res., 114, D08207, doi:10.1029/2008JD011489, 2009. 11420, 11421, 11422, 11425, 11430, 11432, 11436, 11438
Hyv ¨arinen, A.-P., Lihavainen, H., Komppula, M., Panwar, T. S., Sharma, V. P., Hooda, R. K.,
15
and Viisanen, Y.: Aerosol measurements at the Gual Pahari EUCAARI station: preliminary results from in-situ measurements, Atmos. Chem. Phys., 10, 7241–7252, doi:10.5194/acp-10-7241-2010, 2010. 11419, 11420, 11421, 11422, 11425, 11430, 11431, 11435, 11436, 11438
Hyv ¨arinen, A.-P., Raatikainen, T., Brus, D., Komppula, M., Panwar, T. S., Hooda, R. K., Sharma,
20
V. P., and Lihavainen, H.: Effect of the summer monsoon on aerosols at two measurement stations in Northern India – Part 1: PM and BC concentrations, Atmos. Chem. Phys. Dis-cuss., 11, 1715–1748, doi:10.5194/acpd-11-1715-2011, 2011a. 11435
Hyvrinen, A.-P., Raatikainen, T., Komppula, M., Mielonen, T., Sundstrm, A.-M., Brus, D., Pan-war, T. S., Hooda, R. K., Sharma, V. P., de Leeuw, G., and Lihavainen, H.: Effect of the
sum-25
mer monsoon on aerosols at two measurement stations in Northern India – Part 2: Physical and optical properties, Atmos. Chem. Phys. Discuss., 11, 1749–1775, doi:10.5194/acpd-11-1749-2011, 2011b. 11432, 11434, 11435
Komppula, M., Lihavainen, H., Hyv ¨arinen, A.-P., Kerminen, V.-M., Panwar, T. S., Sharma, V. P., and Viisanen, Y.: Physical properties of aerosol particles at a Himalayan background site in
30
India, J. Geophys. Res., 114, D12202, doi:10.1029/2008JD011007, 2009. 11420, 11421, 11422, 11425, 11430, 11431, 11436, 11438
Assess-ACPD
11, 11417–11453, 2011Aerosol properties from two Indian sites
T. Raatikainen et al.
Title Page
Abstract Introduction
Conclusions References
Tables Figures
◭ ◮
◭ ◮
Back Close
Full Screen / Esc
Printer-friendly Version Interactive Discussion
Discussion
P
a
per
|
Dis
cussion
P
a
per
|
Discussion
P
a
per
|
Discussio
n
P
a
per
|
ment during three consecutive pre-monsoon seasons from CALIPSO satellite data, Atmos. Chem. Phys., 10, 4673–4688, doi:10.5194/acp-10-4673-2010, 2010. 11419, 11420, 11435 Lau, K. M., Kim, M. K., and Kim, K. M.: Asian summer monsoon anomalies induced by aerosol
direct forcing: the role of the Tibetan Plateau, Clim. Dynam., 26, 855–864, 2006. 11419 Lau, W. K. M. and Kim, K.-M.: Fingerprinting the impacts of aerosols on long-term
5
trends of the Indian summer monsoon regional rainfall, Geophys. Res. Lett., 37, L16705, doi:10.1029/2010GL043255, 2010. 11419
Marinoni, A., Cristofanelli, P., Laj, P., Duchi, R., Calzolari, F., Decesari, S., Sellegri, K., Vuiller-moz, E., Verza, G. P., Villani, P., and Bonasoni, P.: Aerosol mass and black carbon concen-trations, a two year record at NCO-P (5079 m, Southern Himalayas), Atmos. Chem. Phys.,
10
10, 8551–8562, doi:10.5194/acp-10-8551-2010, 2010. 11419, 11420, 11435, 11436, 11438 Menon, S., Hansen, J., Nazarenko, L., and Luo, Y.: Climate Effects of Black Carbon Aerosols
in China and India, Science, 297, 2250–2253, 2002. 11419
Moorthy, K. K., Satheesh, S. K., Babu, S. S., and Dutt, C. B. S.: Integrated Campaign for Aerosols, gases and Radiation Budget (ICARB): An overview, J. Earth Syst. Sci., 117, 243–
15
262, 2008. 11419
M ¨uller, T., Henzing, J. S., de Leeuw, G., Wiedensohler, A., Alastuey, A., Angelov, H., Bizjak, M., Collaud Coen, M., Engstr ¨om, J. E., Gruening, C., Hillamo, R., Hoffer, A., Imre, K., Ivanow, P., Jennings, G., Sun, J. Y., Kalivitis, N., Karlsson, H., Komppula, M., Laj, P., Li, S.-M., Lunder, C., Marinoni, A., Martins dos Santos, S., Moerman, M., Nowak, A., Ogren, J. A., Petzold,
20
A., Pichon, J. M., Rodriquez, S., Sharma, S., Sheridan, P. J., Teinil ¨a, K., Tuch, T., Viana, M., Virkkula, A., Weingartner, E., Wilhelm, R., and Wang, Y. Q.: Characterization and in-tercomparison of aerosol absorption photometers: result of two inin-tercomparison workshops, Atmos. Meas. Tech., 4, 245–268, doi:10.5194/amt-4-245-2011, 2011. 11432
Neitola, K., Asmi, E., Komppula, M., Hyv ¨arinen, A.-P., Raatikainen, T., Panwar, T. S., Sharma,
25
V. P., and Lihavainen, H.: New particle formation infrequently observed in western Himalayas – why?, Submitted to Atmos. Chem. Phys. Discuss., 2010. 11431, 11432
Nigam, S. and Bollasina, M.: “Elevated heat pump” hypothesis for the aerosol-monsoon hydroclimate link: “Grounded” in observations?, J. Geophys. Res., 105, D16201, doi:10.1029/2009JD013800, 2010. 11419
30
ACPD
11, 11417–11453, 2011Aerosol properties from two Indian sites
T. Raatikainen et al.
Title Page
Abstract Introduction
Conclusions References
Tables Figures
◭ ◮
◭ ◮
Back Close
Full Screen / Esc
Printer-friendly Version Interactive Discussion
Discussion
P
a
per
|
Dis
cussion
P
a
per
|
Discussion
P
a
per
|
Discussio
n
P
a
per
|
doi:10.1029/2005JD006768, 2006. 11420, 11435
Ram, K. and Sarin, M.: Spatio-temporal variability in atmospheric abundances of EC, OC and WSOC over Northern India, J. Aerosol Sci., 41, 88–98, 2010. 11420, 11436
Ram, K., Sarin, M. M., and Hegde, P.: Long-term record of aerosol optical properties and chem-ical composition from a high-altitude site (Manora Peak) in Central Himalaya, Atmos. Chem.
5
Phys., 10, 11791–11803, doi:10.5194/acp-10-11791-2010, 2010. 11419, 11420, 11435 Ramanathan, V., Crutzen, P. J., Lelieveld, J., Mitra, A. P., Althausen, D., Anderson, J., Andreae,
M. O., Cantrell, W., Cass, G. R., Chung, C. E., Clarke, A. D., Coakley, J. A., Collins, W. D., Conant, W. C., Dulac, F., Heintzenberg, J., Heymsfield, A. J., Holben, B., Howell, S., Hudson, J., Jayaraman, A., Kiehl, J. T., Krishnamurti, T. N., Lubin, D., McFarquhar, G., Novakov, T.,
10
andI. A. Podgorny, J. A. O., Prather, K., Priestley, K., Prospero, J. M., Quinn, P. K., Rajeev, K., Rasch, P., Rupert, S., Sadourny, R., Satheesh, S. K., Shaw, G. E., Sheridan, P., and Valero, F. P. J.: Indian Ocean Experiment: An integrated analysis of the climate forcing and effects of the great Indo-Asian haze, J. Geophys. Res., 106, 28371–28398, 2001. 11418, 11419 Ramanathan, V., Li, F., Ramana, M. V., Praveen, P. S., Kim, D., Corrigan, C. E., Nguyen, H.,
15
Stone, E. A., Schauer, J. J., Carmichael, G. R., Adhikary, B., and Yoon, S. C.: Atmospheric brown clouds: Hemispherical and regional variations in long-range transport, absorption, and radiative forcing, J. Geophys. Res., 112, D22S21, doi:10.1029/2006JD008124, 2007. 11419
Sarkar, S., Chokngamwong, R., Cervone, G., Singh, R., and Kafatos, M.: Variability of aerosol
20
optical depth and aerosol forcing over India, Adv. Space Res., 37, 2153–2159, 2006. 11419 Satheesh, S. K., Moorthy, K. K., Babu, S. S., Vinoj, V., and Dutt, C. B. S.: Climate implica-tions of large warming by elevated aerosol over India, Geophys. Res. Lett., 35, L19809, doi:10.1029/2008GL034944, 2008. 11419, 11420
Sellegri, K., Laj, P., Venzac, H., Boulon, J., Picard, D., Villani, P., Bonasoni, P.,
Mari-25
noni, A., Cristofanelli, P., and Vuillermoz, E.: Seasonal variations of aerosol size distri-butions based on long-term measurements at the high altitude Himalayan site of Nepal Climate Observatory-Pyramid (5079 m), Nepal, Atmos. Chem. Phys., 10, 10679–10690, doi:10.5194/acp-10-10679-2010, 2010. 11420
Singh, R. P., Dey, S., Tripathi, S. N., Tare, V., and Holben, B.: Variability of aerosol parameters
30
over Kanpur, northern India, J. Geophys. Res., 109, D23206, doi:10.1029/2004JD004966, 2004. 11419
scat-ACPD
11, 11417–11453, 2011Aerosol properties from two Indian sites
T. Raatikainen et al.
Title Page
Abstract Introduction
Conclusions References
Tables Figures
◭ ◮
◭ ◮
Back Close
Full Screen / Esc
Printer-friendly Version Interactive Discussion
Discussion
P
a
per
|
Dis
cussion
P
a
per
|
Discussion
P
a
per
|
Discussio
n
P
a
per
|
tering albedo and Angstrom absorption exponent during different seasons at Delhi, India, Atmos. Environ., 44, 4355–4363, 2010. 11432
Stohl, A. and Seibert, P.: Accuracy of trajectories as determined from the conservation of meteorological tracers, Q. J. Roy. Met. Soc., 124, 1465–1484, 1998. 11424
Stohl, A., Wotawa, G., Seibert, P., and Kromp-Kolb, H.: Interpolation errors in wind fields as
5
a function of spatial and temporal resolution and their impact on different types of kinematic trajectories, J. Appl. Meteor., 34, 2149–2165, 1995. 11424
Tripathi, S. N., Srivastava, A. K., Dey, S., Satheesh, S. K., and Krishnamoorthy, K.: The vertical profile of atmospheric heating rate of black carbon aerosols at Kanpur in northern India, Atmos. Environ., 41, 6909–6915, 2007. 11433
10
Tyagi, A., Hatwar, H. R., and Pai, D. S. (Eds.): Monsoon 2008, A report, Government of India, India Meteorological Department, 2009. 11424