OPTIMIZATION OF ULTRASOUND-ASSISTED EXTRACTION OF POLYPHENOLIC COMPOUNDS FROM CORIANDER SEEDS USING
RESPONSE SURFACE METHODOLOGY
ГШrКЧ Ј. ГОФШvТć, SКšК D. ĐurШvТć* КЧН BrКЧТЦТr M. ЈКvХТć
University of Novi Sad, Faculty of Technology, Bulevar Cara Lazara 1, 21000 Novi Sad, Serbia
Coriandrum sativum L. (coriander) seeds (CS) were used for preparation of extracts with high content of biologically active compounds. In order to optimize ultrasound-assisted extraction process, three levels and three variables of Box-Behnken experimental design (BBD) in combination with response surface methodology (RSM) were applied, yielding maximized total phenolics (TP) and flavonoids (TF) content and antioxidant activity (IC50 and EC50 values). Independent variables were temperature (40-80oC), ex-traction time (40-80 min) and ultrasonic power (96-216 W). Experimental results were fitted to a second-order polynomial model with multiple regression, while the analysis of variance (ANOVA) was employed to assess the model fitness and determine optimal conditions for TP (79.60oC, 49.20 min, 96.69 W), TF (79.40oC, 43.60 min, 216.00 W), IC50 (80.00oC, 60.40 min, 216.00 W) and EC50 (78.40oC, 68.60 min, 214.80 W). On the basis of the obtained mathematical models, three-dimensional surface plots were gene-rated. The predicted values for TP, TF, IC50 and EC50 were: 382.68 mg GAE/100 g CS, 216 mg CE/100 g CS, 0.03764 mg/mL and 0.1425 mg/mL, respectively.
KEY WORDS: coriander seeds, ultrasound-assisted extraction, optimization, response surface methodology
INTRODUCTION
Nowadays, aromatic and medicinal plants are attracting an increasing amount of attention due to their potential application in various industry fields and for health bene-fits. One of these plants is coriander (Coriandrum sativum L.), which belongs to the Apiaceae botanical family, and is widely cultivated and distributed in Mediterranean countries (1). Seeds contain up to 1% of essential oil with the main component of mono-terpenoid linalool (>50%) (2), while limonene, camphor and geraniol are also present in significant quantity (3). Coriander seeds also contain vegetal oil with a high concentra-tion of monounsaturated fatty acids, particularly petroselinic acid (4). Coriander has also been recognized as a medical agent which has been used against worms, rheumatism and pain in the joints (2). Several studies have demonstrated hypoglycemic action and effect
on carbohydrate metabolism (2, 5). It has been reported that volatile components in essential oil from seeds and leaves of coriander have antimicrobial activity (1, 2, 6, 7), as well as anticancerous and antimutagenic (5, 8), antioxidant (2, 8-10) and antidiabetic (8, 11) activities.
Recently, reports on the application of ultrasound as a method for extraction of biolo-gical active compounds form plant material have been published. It has been showed that ultrasound-assisted extraction (UAE) technique can be especially suitable due to low equipment requirements and its high economic efficiency (12), offering at the same time high reproducibility, simplified manipulation, and reduced solvent and energy consump-tion (13). Beside these advantages, the usage of ultrasound for extracconsump-tion diminishes the danger of thermal degradation of desired compounds and reduces significantly the time needed for the process itself (14). Cavitation, which occurs in the solvent due to the crea-tion, growth and implosion of gas bubbles (15) and mechanical effect of ultrasound which provides a greater penetration of solvent into cellular material (12, 14), are the main benefits of using this method. Like many other processes, this process also posses-ses certain disadvantages. They are manifested in the form of the effect causing the chan-ges in chemical composition and degradation of desired compounds, as well as in forma-tion of free radical species inside of gas bubbles (16).
Optimization of any technological process is a very important task, aiming to gain maximum of the process with minimal losses at the same time. In the case of UAE there is a need for optimization of the process temperature, time and ultrasonic power. The most frequent technique employed for optimization of these parameters is the response surface methodology (RSM), which represent a collection of statistical and mathematical methods suitable to perform this important task (17). This technique is based on the in-fluence of several different variables on the response of interest, aiming at the optimiza-tion of the described response (18).
The aim of this study was to evaluate the influence of extraction time, temperature and ultrasonic power on the extraction process of coriander seeds. After evaluation, UAE was optimized applying the RSM in order to obtain the liquid extracts with the highest phenolics content and antioxidant activity.
EXPERIMENTAL
Plant material
Coriander seeds were acquired from the Institute of Field and Vegetable Crops, Novi Sad, Republic of Serbia (year 2013). Plant material was air-dried and stored at room temperature. Dried seeds were milled in the blender, and mean particle size (0.6493 mm) was determined by CISA Cedaceria Industrial sieve set (Spain).
Chemicals
Ultrasound-assisted extraction procedure
In all experimental runs, 10.0 g of powdered coriander seeds were mixed with 100 mL of 63% ethanol (ratio 1:10) in 300 mL glass flasks. Ultrasound-assisted extraction was performed in sonication water bath (EUP540A, Euinstruments, France) at a fixed frequency of 40 kHz. Ultrasonic power, temperature and extraction time were controlled from the panel of the instrument. Flasks were always positioned at the same distance from the transducer, and no agitation was applied. After extraction, the extracts were immediately filtered through filter paper under vacuum. The extracts were collected into glass flasks and stored at 4oC until the analysis. After filtration, 10 mL of liquid extract were used for the extraction yield determination by removing the solvent and drying to the constant mass, to measure mass of the dry residue. The solvent was also removed from the rest of the extract on a rotary vacuum evaporator (Devarot, Elektromedicina, Ljubljana, Slovenia), and dried at 110oC to constant mass. The total extraction yield was expressed as gram of dry extract per 100 grams of coriander seeds (g/100 g CS).
Total phenolics content
The total phenolics (TP) content in the obtained coriander extracts was determined by Folin-Ciocalteu procedure (19, 20), using gallic acid as a standard. Absorbance was mea-sured at 750 nm. Content of phenolic compounds was expressed as milligrams of gallic acid equivalent (GAE) per 100 grams of C. sativum seeds (mg GAE/100 g CS). All expe-riments were performed in three replicates, and the results were expressed as mean values.
Total flavonoids content
The total flavonoids (TF) content was determined using aluminum chloride colori-metric assay (21). The results were expressed as milligrams of catechin equivalents (CE) per 100 g of coriander seeds (mg CE/100 g CS). All experiments were performed in three replicates and the results were expressed as a mean value.
DPPH assay
The free radical scavenging activity of coriander liquid extracts was determined as НОsМrТЛОН Лв EspíЧ Оt КХ. (ββ). A МОrtКТЧ vШХuЦО ШП НТХutОН ХТquТН ОбtrКМt аКs ЦТбОН аТtС λ5% ЦОtСКЧШХ КЧН λ0 µM sШХutТШЧ ШП β,β-diphenyl-1-picryl-hydrazyl (DPPH) in order to obtain different final concentrations of extract. The blank probe was prepared by using proper extraction solvent instead of sample. After 60 min of incubation at room tempera-ture, the absorbance was measured at 515 nm and the result was expressed as radical scavenging capacity (%RSC), which was calculated by the following equation:
%ЊЋC=100-(AsКЦpХОA ×100)
where: Asample is the absorbance of sample solution and Ablank is the absorbance of the blank probe. Antioxidant activity was expressed as the inhibition concentration at RSC value 50% (IC50), which represents the concentration of the test solution required to obtain 50% of radical scavenging capacity expressed as mg per mL (mg/mL). All experi-ments were performed in three replicates, and the results were expressed as a mean value.
Reducing power assay
Reducing power of the samples was determined according to the assay based on the reduction of Fe3+ by polyphenol antioxidants (23). Different dilutions of liquid extract (1 mL) were mixed with phosphate buffer (1 mL, 0.2 M, pH 6.6) and 1% potassium ferricyanide (1 mL) in glass tubes. The tubes were incubated on 50oC for 20 min. After incubation, 10% trichloroacetic acid solution (1 mL) was added to the reaction mixture. Then, the solution was centrifuged at 3000 rpm for 10 min, and the supernatant (2 mL) was further mixed with double distilled water (2 mL) and 0.1% FeCl3 solution (0.4 mL). Absorbance was measured at 700 nm. The blank probe was prepared by using proper extraction solvent instead of sample. Reducing power was expressed as the EC50 value (concentration in mg/mL at the absorbance of 0.5), which caused the reduction of 50% Fe3+ ions in the reaction mixture. The EC50 value was determined from the generated curve which represented the relationship between the sample concentration and the absor-bance. All experiments were performed in triplicate, and the results were expressed as a mean value.
Experimental design
The RSM was employed to evaluate the effects of extraction parameters and optimize conditions for various responses administering the Box-Behnken experimental design (BBD) with three numeric factors on three levels. The design consisted of seventeen ran-domized runs with five replicates at the central point. Independent variables used in the experimental design were the temperature (X1, 40-80oC), extraction time (X2, 40-80 min) and ultrasonic power (X3, 96-216 W). The ranges of variables were determined according to the available literature data (15, 24). In order to normalize the parameters, each of the coded variables was forced to range from -1 to 1, so that they all affect the response more evenly, and so the units of the parameters are irrelevant (18). The variables were coded according to the following equation (25):
Б=БТ-Б0
ΔБ [2]
Table 1. Natural and coded levels of independent variables used in the RSM design
Variable
Coded levels
-1 0 1
Natural levels
Temperature (oC) 40 60 80
Extraction time (min) 40 60 80
Ultrasonic power (W) 96 156 216
The response variables were fitted to the following second-order polynomial model, which is generally able to describe the relationship between the responses and the inde-pendent variables (26):
В= 0+∑γТ=1 ТБТ+∑γТ=1 ТТБТβ+∑ ∑γТ<У=1 ТУБТБУ [3]
аСОrО В rОprОsОЧts tСО ЦОКsurОН rОspШЧsО; 0 is a constant, bj, bjj, bij are the linear, quadratic and interactive coefficients of the model, respectively; Xi and Xj are the levels of the independent variables. Optimal extraction conditions were determined considering TP and TF contents, radical scavenging activity and reducing power as responses. The experimental design and multiple linear regression analysis were performed using Design-Expert v.7 Trial (Stat-Ease, Minneapolis, Minnesota, USA). The results were statistically tested by the analysis of variance (ANOVA) with the significance levels of 0.05. The adequacy of the model(s) was evaluated by the coefficient of multiple deter-mination (R2), coefficient of variance (CV) and p-values for the model and lack of fit testing.
RESULTS AND DISCUSSION
Model fitting
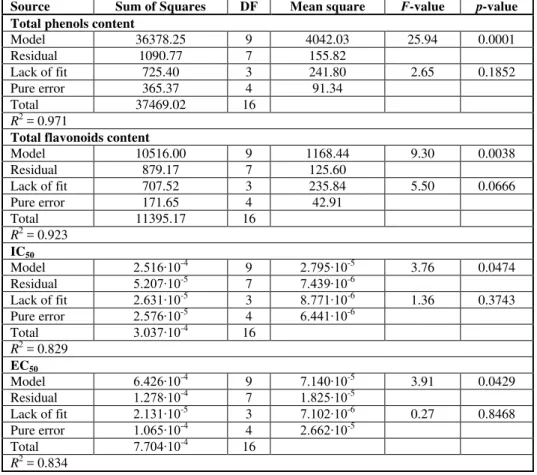
respecti-vely). The ANOVA was used to provide detailed information about statistical signify-cance of the investigated models. The experimental results of all investigated responses showed good fitting with mathematical models, since the regression for the model was significant (p < 0.05), and the lack of fit testing was insignificant (p > 0.05) (Table 4). Therefore, the regression equations could be successfully used as predictors of these responses in the investigated experimental domain.
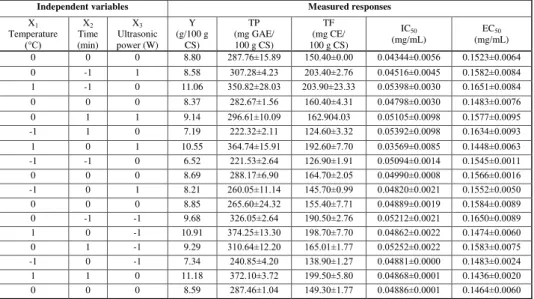
Table 2. Experimental conditions for the Box-Behnken design including natural and coded levels and experimentally obtained values of measured responses, including yield,
TP, TF, IC50 and EC50 values
Table 3. Estimated regression coefficients of the fitted second-order polynomial model for all investigated responses
Coefficient Response
TP TF IC50 EC50
0 282.24 156.04 0.048 0.150
Linear
1 64.64 32.32 -1.86γ∙10-3 -β.56γ∙10-3
2 -0.50 -9.09 4.λ6γ∙10-4 -β.475∙10-3
3 -2.89 1.44 -β.746∙10-3 -γ.875∙10-4
Interaction
12 5.12 -0.52 -β.070∙10
-3
-7.600∙10-3
13 -7.18 -3.22 -γ.080∙10-3 -β.γ75∙10-3
23 1.19 -3.75 1.γ7γ∙10-3 1.550∙10-3
Independent variables Measured responses
X1 Temperature (њC) X2 Time (min) X3 Ultrasonic power (W) Y (g/100 g CS) TP (mg GAE/ 100 g CS)
TF (mg CE/ 100 g CS)
IC50
(mg/mL)
EC50
(mg/mL)
0 0 0 8.80 β87.76±15.8λ 150.40±0.00 0.04γ44±0.0056 0.1523±0.0064 0 -1 1 8.58 γ07.β8±4.βγ β0γ.40±β.76 0.04516±0.0045 0.1582±0.0084 1 -1 0 11.06 γ50.8β±β8.0γ β0γ.λ0±βγ.γγ 0.05γλ8±0.00γ0 0.1651±0.0084
0 0 0 8.37 β8β.67±1.56 160.40±4.γ1 0.047λ8±0.00γ0 0.1483±0.0076
0 1 1 9.14 βλ6.61±10.0λ 162.904.03 0.05105±0.00λ8 0.1577±0.00λ5 -1 1 0 7.19 βββ.γβ±β.11 1β4.60±γ.γβ 0.05γλβ±0.00λ8 0.1634±0.00λγ 1 0 1 10.55 γ64.74±15.λ1 1λβ.60±7.70 0.0γ56λ±0.0085 0.1448±0.006γ -1 -1 0 6.52 ββ1.5γ±β.64 1β6.λ0±1.λ1 0.050λ4±0.0014 0.1545±0.0011
0 0 0 8.69 β88.17±6.λ0 164.70±β.05 0.04λλ0±0.0008 0.1566±0.0016
-1 0 1 8.21 β60.05±11.14 145.70±0.λλ 0.048β0±0.00β1 0.1552±0.0050 0 0 0 8.85 β65.60±β4.γβ 155.40±7.71 0.0488λ±0.001λ 0.1584±0.008λ 0 -1 -1 9.68 γβ6.05±β.64 1λ0.50±β.76 0.05β1β±0.00β1 0.1650±0.008λ 1 0 -1 10.91 γ74.β5±1γ.γ0 1λ8.70±7.70 0.0486β±0.00ββ 0.1474±0.0060 0 1 -1 9.29 γ10.64±1β.β0 165.01±1.77 0.05β5β±0.00ββ 0.1583±0.0075 -1 0 -1 7.34 β40.85±4.β0 1γ8.λ0±1.β7 0.04881±0.0000 0.1483±0.00β4 1 1 0 11.18 γ7β.10±γ.7β 1λλ.50±5.80 0.04868±0.0001 0.1436±0.00β0
Table 3. Continuation
Coefficient Response
TP TF IC50 EC50
Quadratic
11 4.64 -1.90 -4.08γ∙10
-4
-γ.γ1γ∙10-3
22 4.81 9.58 4.474∙10-3 7.56β∙10-3
33 23.09 14.83 -β.076∙10-3 -1.6β5∙10-4
Table 4. Analysis of the ANOVA of the fitted second-order polynomial models
Source Sum of Squares DF Mean square F-value p-value
Total phenols content
Model 36378.25 9 4042.03 25.94 0.0001
Residual 1090.77 7 155.82
Lack of fit 725.40 3 241.80 2.65 0.1852
Pure error 365.37 4 91.34
Total 37469.02 16
R2 = 0.971
Total flavonoids content
Model 10516.00 9 1168.44 9.30 0.0038
Residual 879.17 7 125.60
Lack of fit 707.52 3 235.84 5.50 0.0666
Pure error 171.65 4 42.91
Total 11395.17 16
R2 = 0.923
IC50
Model β.516∙10-4 9 β.7λ5∙10-5 3.76 0.0474
Residual 5.β07∙10-5 7 7.4γλ∙10-6
Lack of fit β.6γ1∙10-5 3 8.771∙10-6 1.36 0.3743
Pure error β.576∙10-5 4 6.441∙10-6
Total γ.0γ7∙10-4 16
R2 = 0.829
EC50
Model 6.4β6∙10-4 9 7.140∙10-5 3.91 0.0429
Residual 1.β78∙10-4 7 1.8β5∙10-5
Lack of fit β.1γ1∙10-5 3 7.10β∙10-6 0.27 0.8468
Pure error 1.065∙10-4 4 β.66β∙10-5
Total 7.704∙10-4 16
R2 = 0.834
Total extraction yield
80 min, and ultrasonic power of 156 W. On the other hand, the lowest yield was obtained under the following conditions: 40oC, 40 minutes, and ultrasonic power of 156 W. As the values were obtained under the same ultrasonic power but at the different values of tem-perature and time, this indicates the importance of those two independent variables on the yield.
TP content
The values obtained for the TP content are presented in Table 2, and they ranged from 221.53 to 374.25 mg GAE/100 g CS. The previously conducted UAE extraction of CS raffinate obtained after performed the SFE revealed the TP content in the range of 110.53-222.08 mg GAE/100 g of CS (in 70% ethanol as solvent) and 161.82-308.55 mg GAE/100 g CS (water as solvent) (27). These results were lower than those obtained in this study, but indicated the importance of the solvent selection. Comparing to the results ШЛtКТЧОН Лв ГОФШvТć Оt КХ. (β8), аСОrО tСО ЦКбТЦКХ ШЛtКТЧОН vКХuО ШП TЈ МШЧtОЧt аКs 2629.70 mg GAE/100 g CS, these results present lower content, indicating that subcriti-cal water extraction (SWE) is a more suitable method for extraction of phenolic com-pound than UAE. On the other hand, Gallo et al. (29) applied the UAE and microwave-assisted extraction (MAE) techniques and obtained 41.81 and 82.09 mg GAE/100 g CS, which presents a lower yield of these compounds comparing to those obtained in this study. The optimization of the MAE extraction process of CS gave the TP content in the range of 136.92-384.54 mg GAE/100g CS (30), which is similar to the results obtained in this study. This indicates the importance of extraction conditions and their significant influence (p < 0.05) on the yield of phenolic compounds.
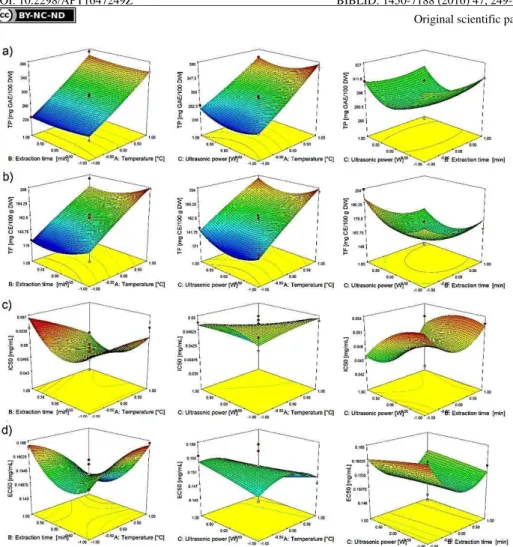
The effects of UAE parameters on TP is presented in Figure 1a, while their signifi-cance was determined by RSM influence analysis expressed as regression coefficients from Eq. [3] (Table 3). According to ANOVA, only linear term of temperature and quad-ratic term of ultrasonic power exhibited significant influence (p < 0.05) on TP. The posi-tive influence of the liner term of temperature was rather expected, since temperature affects mass transfer by increasing diffusion, causing degradation of the plant matrix and improving physical solvent properties in terms of penetration and solubility power (15). A negative influence of the linear term of ultrasonic and positive influence of its quad-ratic term indicate that TP decrease with the increase of ultrasonic power up to a certain value, then TP shows again a slight increase. The predicted second-order polynomial mo-del for TP content is:
TЈ=β8β.β4+64.64Б1-0.50Бβ-β.8λБγ+5.1βБ1Бβ-7.18Б1Бγ+1.1λБβБγ+
+4.64Б1β+4.81Бββ+βγ.0λБγβ [4]
TF content
CE/100 g SC (70% ethanol as solvent) and 80.86-297.63 mg CE/100 g SC (water as sol-vent) (27). The results show that the TF content in the water UAE extract was higher than achieved in this study. Comparing the results for TF obtained in this study with the re-suХts ШЛtКТЧОН Лв ГОФШvТć Оt КХ. (β8), аСОrО TF МШЧtОЧt ТЧ CЋ ОбtrКМts vКrТОН ПrШЦ βγ1.15 to 628.00 mg CE/100 g CS, as it was the case with TP content, which indicates once again the superiority of the SWE method over the UAE method. The optimization of MAE process gave the TF content in the range of 94.50-211.83 mg CE/100 g SC (30), which is in accordance with the TF content obtained in this study.
According to the data presented in Table 3, the linear term of temperature and quad-ratic term of ultrasonic power exhibited a significant influence on the TF content (p < 0.05). The presented regression coefficients (Table 3) suggest that the influence of these three parameters on TF content should be similar as for the TP content (Figure 1.b). The predicted second-order polynomial model for the TF content is:
TЈ=156.04+γβ.γβБ1-λ.0λБβ+1.44Бγ-0.5βБ1Бβ-γ.ββБ1Бγ
-γ.75БβБγ-1.λ0Б1β+λ.58Бββ+14.8γБγβ [5]
DPPH and reducing power assays
The results obtained assaying DPPH assay are presented in Table 2, and the measured values of IC50 ranged from 0.03569 to 0.05398 mg/ml. Comparing these results with those from the previous study (28), reporting the IC50 values of CS extracts in the range from 0.01706 to 0.06336 mg/mL, there is no big difference between the obtained values. Namely, the obtained the highest values of antioxidant activity at the high temperature were the same as in this study. Wangensteen et al. (2) reported the antioxidant activity of 0.51000 mg/mL of CS ethanolic extract obtained by solid-liquid extraction technique, which is lower compared to the result obtained in this research. The antioxidant activity of UAE extracts of CS (raffinate after the SFE process) against DPPH was in the range of 0.02478-0.04183 mg/mL (for 70% ethanolic extracts) and 0.07499-0.10770 mg/mL (for water extracts) (27). Ethanolic extracts exhibited higher activity against this radical than the extracts obtained in this study. The extracts obtained during the optimized MAE pro-cess of CS showed an activity in the range of 0.03020-0.06650 mg/mL (30), which is higher than in the case of UAE.
Figure 1. Response surface plots showing combined effects of UAE parameters on: a) TP, b) TF, c) IC50 and d) EC50
The influence of the parameters on the DPPH assay is presented in Figure 1c, while the influence on the reducing power is shown in Figure 1d. The predicted second-order polynomial models for DPPH assay (Eq. [6]) and reducing power test (Eq. [7]) are:
IC50=0.048-1.86γE-0.0γБ1+4.λ6γE-0.04Бβ-β.746E-0.0γБγ --β.070E-0.0γБ1Бβ-γ.080E-0.0γБ1Бγ+1.γ7γE-0.0γБβБγ
--4.08γE-0.04Б1β+4.474E-0.0γБββ-β.076E-0.0γБγβ [6]
EC50=0.15+β.56γE-0.0γБ1+β.475E-0.0γБβ-γ.875E-0.04Бγ --7.600E-0.0γБ1Бβ-β.γ75E-0.0γБ1Бγ+1.550E-0.0γБβБγ
In the case of the DPPH assay, the linear term of ultrasonic power and quadratic term of extraction time exhibited a significant influence on the IC50 value (p < 0.05). With the increase in the ultrasonic power, the IC50 value was constant first, to decrease at higher values of ultrasonic power.
This phenomenon is connected with the influence of this parameter on the TP and TF contents. With the increase in ultrasonic power, the TP and TF content decreased in the beginning, while the IC50 value was constant. After certain value of ultrasonic power there were increases in the TP and TF contents, while the IC50 value sharply decreased, consequently causing an increase in the antioxidant activity. On the other hand, in the beginning of the extraction, the IC50 value decreased, and then started to increase. The decrease in the antioxidant activity after certain time could be explained by the heating effect or overexposure to ultrasound irradiation, when decomposition of the antioxidant agent in the extract might occur (31). Similar effects of ultrasonic power and extraction time on DPPH assay have been reported previously (32, 33). In the case of interaction of ultrasound power and time, the IC50 value decreased with both extraction time and ultra-sonic power in the beginning of the extraction process, and the lowest IC50 value (highest antioxidant activity) were achieved at approximately half of the extraction process and ultrasonic power range (Figure 1c).
As for the reducing power, significant influence exhibited only the quadratic term of time and interaction between temperature and time (p < 0.05). The influence of the time was the same as in the case of DPPH assay. This means that both antioxidant tests rely on the reaction with the same compounds in the extracts and that their decomposition occurred due to prolonged exposure to high temperature or ultrasonic power.
ЈОКrsШЧ’s МШrrОХКtТШЧ МШОППТМТОЧts КЦШЧР В, TЈ, TF, IC50 and EC50 values are pre-sented in Table 5. There was high correlation between Y and TP and between TP and TF (r > 0.9). The correlation among Y and TF was good (r = 0.8710).
Table 5. ЈОКrsШЧ’s МШrrОХКtТШЧ МШОППТМТОЧts КЦШЧР В, TЈ, TF, IC50 and EC50
r Y TP TF IC50 EC50
EC50 −0.155γ −0.β5βγ −0.041λ 0.6024 1
IC50 −0.1λ06 −0.βλ56 −0.ββλ1 1
TF 0.8710 0.9198 1
TP 0.9671 1
Y 1
Optimization of UAE
As the aim of this research was the optimization id the extraction process to obtain maximal TP and TF contents and maximal antioxidant activity, each of the individual res-ponses was optimized. This optimization was based on previously obtained experimental results and performed statistical analysis. The estimated optimal conditions and predicted values of individual responses are presented in Table 6.
Table 6. Predicted maximal values of individual responses and estimated values of optimal conditions
Optimal conditions
Investigated responses
TP (mg GAE/100 g CS)
TF (mg CE/100 g CS)
IC50 (mg/mL)
EC50 (mg/mL)
Predicted value 382.68 216.06 0.03764 0.1425
Temperature (oC) 79.60 79.40 80.00 78.40
Time (min) 49.20 43.60 60.40 68.60
Ultrasonic power (W) 96.60 216.00 216.00 214.80
Observing the data from Table 6 it can be noticed that the conditions for both anti-oxidant activity tests were similar. On the other hand, there were differences in ultrasonic power for TP and TF contents. In the case of TP content, the maximum value required almost minimal ultrasonic power, while it was vice versa in the case of TF content, where maximal ultrasonic power was required. The desirability for all cases was 1.00 except for the IC50 value, which was 0.893.
CONCLUSION
Preparation of extracts with high antioxidant activity and maximum content of biolo-gical active compound (phenolic and flavonoid compounds) require careful selection of extraction parameters. In order to optimize process parameters, response surface metho-dology was successfully applied. It was shown that a second-order polynomial model was able to successfully describe the extraction process of polyphenolic compound and anti-oxidant activity. The obtained results showed that temperature and ultrasonic power had the strongest influence on total phenolics and total flavonoids content, while extraction time was crucial parameter in the case of DPPH and reducing power assays. Regarding the DPPH assay, ultrasonic power appeared to be an important factor for the optimization process. The temperature and time profiles were similar for all four measured responses, but in the case of ultrasonic power maximum value was predicted for all responses with exception of total phenolics content, where minimum of ultrasonic power was required.
Acknowledgement
REFERENCES
1. Grosso, C.; Ferraro, V.; Figueiredo, A.C.; Barroso, J.G.; Coelho, J.A.; Palavra, A.M. Supercritical carbon dioxide extraction of volatile oil from Italian coriander seeds. Food Chem.2008,111 (1), 197-203.
2. Wangensteen, H.; Samuelsen, A.B.; Malterud, K.E. Antioxidant activity in extracts from coriander. Food Chem.2004,88 (2), 293-297.
3. Bajpai, M.; Mishra, A.; Prakash, D. Antioxidant and free radical scavenging activities of some leafy vegetables. Int. J. Food Sci. Nutr.2005,56 (7), 473-481.
4. Mhemdi, H.; Rodier, E.; Kechaou, N.; Fages, J. A supercritical tuneable process for the selective extraction of fats and essential oil from coriander seeds. J. Food Eng.
2011,105 (4), 609-616.
5. Chithra, V.; Leelamma, S. Coriandrum sativum— effect on lipid metabolism in 1,2-dimethyl hydrazine induced colon cancer. J. Ethnopharmacol.2000,71 (3), 457-463. 6. Delaquis, P.J.; Stanich, K.; Girard, B.; Mazza, G. Antimicrobial activity of individual
and mixed fractions of dill, cilantro, coriander and eucalyptus essential oils. Int. J. Food Microbiol.2002,74 (1-2), 101-109.
7. Lo Cantore, P.; Iacobellis, N.S.; De Marco, A.; Capasso, F.; Senatore, F. Antibacterial activity of Coriandrum sativum L. and Foeniculum vulgare Miller var. vulgare (Miller) essential oils. J. Agric. Food Chem.2004,52 (26), 7862-7866.
8. Chen, Q.; Yao, S.; Huang, X.; Luo, J.; Wang, J.; Kong, L. Supercritical fluid ex-traction of Coriandrum sativum and subsequent separation of isocoumarins by high-speed counter-current chromatography. Food Chem.2009,117 (3), 504-508.
9. ЊКЦКНКЧ, M.F.; KrШС, L.А.; MörsОХ, J.-T. Radical scavenging activity of black cumin (Nigella sativa L.), coriander (Coriandrum sativum L.), and niger (Guizotia abyssinica Cass.) crude seed oils and oil fractions. J. Agric. Food Chem. 2003,51 (24), 6961-6969.
10.Madsen, L.; Bertelsen, G. Spices as antioxidants. Trends Food Sci. Technol.1995,6 (8), 271-277.
11.Gallagher, A.M.; Flatt, P.R.; Duffy, G.; Abdel-Wahab, Y.H.A. The effects of traditio-nal antidiabetic plants on in vitro glucose diffusion. Nutr. Res.2003,23 (3), 413-424. 12.Rostagno, M.A.; Palma, M.; Barroso, C.G. Ultrasound-assisted extraction of soy
iso-flavones. J. Chromatogr. A2003,1012 (2), 119-128.
13.Chemat, F.; Tomao, V.; Virot, M. Ultrasound-Assisted Extraction in Food Analysis. In Handbook of Food Analysis Instruments; ЋОЦТС нtХОs, EН.; CЊC prОssμ BШМК Raton, Florida, USA, 2008; pp 85-94.
14.Kimbaris, A.C.; Siatis, N.G.; Daferera, D.J.; Tarantilis, P.A.; Pappas, C.S.; Polissiou, M.G. Comparison of distillation and ultrasound-assisted extraction methods for the isolation of sensitive aroma compounds from garlic (Allium sativum). Ultrason. Sono-chem.2006,13 (1), 54-60.
16.Paniwnyk, L.; Beaufoy, E.; Lorimer, J.P.; Mason, T.J. The extraction of rutin from flower buds of Sophora japonica. Ultrason. Sonochem.2001,8 (3), 299-301.
17.Adamczyk, J.; Horny, N.; Tricoteaux, A.; Jouan, P.-Y.; Zadam, M. On the use of res-ponse surface methodology to predict and interpret the preferred c-axis orientation of sputtered AlN thin films. Appl. Surf. Sci.2008,254 (6), 1744-1750.
18.BКş, D.; BШвКМı, İ.H. MШНОХТЧР КЧН ШptТЦТгКtТШЧ Iμ UsКЛТХТtв ШП rОspШЧsО surПКМО methodology. J. Food Eng.2007,78 (3), 836-845.
19.KтСФöЧОЧ, M.Ј.; HШpТК, A.I.; ЏuШrОХК, H.J.; ЊКuСК, J.-P.; Pihlaja, K.; Kujala, T.S.; Heinonen, M. Antioxidant activity of plant extracts containing phenolic compounds. J. Agric. Food Chem.1999,47 (10), 3954-3962.
20.Singleton, V.L.; Rossi, J.A. Colorometry of total phenolics with phosphomolybdic-phosphotungstic acid reagents. Am. J. Enol. Vitic.1965,16 (3), 144-158.
21.Harborne, J.B. Methods in plant biochemistry. Volume 1. Plant Phenolics; Academic Press Ltd: London, 1989.
22.EspíЧ, J.C.; ЋШХОr-Rivas, C.; Wichers, H.J. Characterization of the total free radical scavenger capacity of vegetable oils and oil fractions using 2,2-diphenyl-1-picrylhyd-razyl radical. J. Agric. Food Chem.2000,48 (3), 648-656.
23.Oyaizu, M. Studies on products of browning reaction. Antioxidative activities of pro-ducts of browning reaction prepared from glucosamine. Japanese J. Nutr. Diet.1986,
44 (17), 307-315.
24.TШЦšТФ, A.; ЈКvХТć, B.; ЏХКНТć, J.; ЊКЦТć, M.; BrТЧНгК, J.; ЏТНШvТć, Ћ. τptТЦТгКtТШЧ of ultrasound-assisted extraction of bioactive compounds from wild garlic (Allium ur-sinum L.). Ultrason. Sonochem.2016,29, 502-511.
25.Wang, J.; Sun, B.; Cao, Y.; Tian, Y.; Li, X. Optimisation of ultrasound-assisted ex-traction of phenolic compounds from wheat bran. Food Chem. 2008,106 (2), 804-810.
26.Bezerra, M.A.; Santelli, R.E.; Oliveira, E.P.; Villar, L.S.; Escaleira, L.A. Response surface methodology (RSM) as a tool for optimization in analytical chemistry. Ta-lanta2008,76 (5), 965-977.
27.ГОФШvТć, Г.; BušТć, A.; KШЦОs, D.; ЏХКНТć, J.; AНКЦШvТć, D.; ЈКvХТć, B. CШrТКЧНОr seeds processing: Sequential extraction of non-polar and polar fractions using super-critical carbon dioxide extraction and ultrasound-assisted extraction. Food Bioprod. Process.2015,95, 218-227.
28.ГОФШvТć, Г.; ЏТНШvТć, Ћ.; ЏХКНТć, J.; ЊКНШsКvХУОvТć, Њ.; CvОУТЧ, A.; EХРЧНТ, M.A.; ЈКvХТć, B. τptТЦТгКtТШЧ ШП suЛМrТtТМКХ аКtОr Обtraction of antioxidants from Corian-drum sativum seeds by response surface methodology. J. Supercrit. Fluids2014,95, 560-566.
29.Gallo, M.; Ferracane, R.; Graziani, G.; Ritieni, A.; Fogliano, V. Microwave Assisted Extraction of Phenolic Compounds from Four Different Spices. Molecules2010,15 (9), 6365-6374.
31.ŞКСТЧ, Ћ.; ŞКЦХТ, Њ. τptТЦТгКtТШЧ ШП ШХТvО ХОКП ОбtrКМt ШЛtКТЧОН Лв uХtrКsШuЧН-assisted extraction with response surface methodology. Ultrason. Sonochem. 2013, 20 (1), 595-602.
32.Samaram, S.; Mirhosseini, H.; Tan, C.P.; Ghazali, H.M.; Bordbar, S.; Serjouie, A. Optimisation of ultrasound-assisted extraction of oil from papaya seed by response surface methodology: Oil recovery, radical scavenging antioxidant activity, and oxi-dation stability. Food Chem.2015,172, 7-17.
33.Hammi, K.M.; Jdey, A.; Abdelly, C.; Majdoub, H.; Ksouri, R. Optimization of ultra-sound-assisted extraction of antioxidant compounds from Tunisian Zizyphus lotus fruits using response surface methodology. Food Chem.2015,184, 80-89.
. , . Ђ .
, , 1, β1000 ,
-.
-, (ЊЋM)
(TЈ) (TF)
-, (IC50 EC50).
(40-80oC),
(40-80 ЦТЧ) (λ6-β16 А).
,
( στЏA)
TЈ (7λ,60o
C, 49,20 min, 96,69 W), TF (79,40oC, 43,60 min, 216,00 W), IC50 (80,00oC, 60,40 ЦТЧ, β16,00 А) EC50 (78,40oC, 68,60 min,
β14,80 А). ђ TЈ, TF,
IC50 EC50 О μ γ8β,68 ЦР GAE/100 Р CЋ, β16 ЦР CE/100 Р CЋ, 0,0γ764 ЦР/ЦХ 0,1425 mg/ml.
: , , ,