www.atmos-chem-phys.net/17/2373/2017/ doi:10.5194/acp-17-2373-2017
© Author(s) 2017. CC Attribution 3.0 License.
Impact of mixing state and hygroscopicity on CCN activity of
biomass burning aerosol in Amazonia
Madeleine Sánchez Gácita1, Karla M. Longo1,a, Julliana L. M. Freire1, Saulo R. Freitas1,a, and Scot T. Martin2
1Center for Weather Forecasting and Climate Research, INPE, Cachoeira Paulista, SP, Brazil 2School of Engineering and Applied Science, Harvard University, Cambridge, MA, USA
anow at: Universities Space Research Association/Goddard Earth Sciences Technology and Research (USRA/GESTAR) at
Global Modeling and Assimilation Office, NASA Goddard Space Flight Center, Greenbelt, MD, USA Correspondence to:Madeleine Sánchez Gácita (madeleine.sanchez@cptec.inpe.br)
Received: 22 March 2016 – Discussion started: 18 April 2016
Revised: 15 January 2017 – Accepted: 16 January 2017 – Published: 15 February 2017
Abstract.Smoke aerosols prevail throughout Amazonia be-cause of widespread biomass burning during the dry season, and external mixing, low variability in the particle size dis-tribution and low particle hygroscopicity are typical. There can be profound effects on cloud properties. This study uses an adiabatic cloud model to simulate the activation of smoke particles as cloud condensation nuclei (CCN) for three hy-pothetical case studies, chosen as to resemble biomass burn-ing aerosol observations in Amazonia. The relative impor-tance of variability in hygroscopicity, mixing state, and ac-tivation kinetics for the activated fraction and maximum su-persaturation is assessed. For a population with κp=0.04,
an overestimation of the cloud droplet number concentra-tionNdfor the three selected case studies between 22.4±1.4
and 54.3±3.7 % was obtained when assuming a hygroscop-icity parameterκp=0.20. Assuming internal mixing of the
aerosol population led to overestimations of up to 20 % of Nd when a group of particles with medium
hygroscopic-ity was present in the externally mixed population cases. However, the overestimations were below 10 % for exter-nal mixtures between very low and low-hygroscopicity par-ticles, as seems to be the case for Amazon smoke particles. Kinetic limitations were significant for medium- and high-hygroscopicity particles, and much lower for very low and low-hygroscopicity particles. When particles were assumed to be at equilibrium and to respond instantly to changes in the air parcel supersaturation, the overestimation of the droplet concentration was up to ∼100 % in internally mixed pop-ulations, and up to ∼250 % in externally mixed ones, be-ing larger for the higher values of hygroscopicity. In
addi-tion, a perceptible delay between the times when maximum supersaturation and maximum aerosol activated fraction are reached was noticed and, for aerosol populations with ef-fective hygroscopicityκpeff higher than a certain threshold
value, the delay in particle activation was such that no par-ticles were activated at the time of maximum supersatura-tion. Considering internally mixed populations, for an up-draft velocityW=0.5 m s−1this threshold of no activation
varied betweenκpeff=0.35 andκpeff=0.5 for the different
smoke aerosol loads in the region during the dry season, ki-netic limitations are expected to be low.
1 Introduction
Aerosol–cloud interactions are a major source of uncertain-ties in the quantification of climate forcing of aerosols (Bauer and Menon, 2012; IPCC, 2013). The wet size of an aerosol particle when at equilibrium with the environment is gov-erned by Köhler theory (Köhler, 1936) and depends on par-ticle size and composition. In the atmosphere, activation of cloud condensation nuclei (CCN) is a competition between aerosol particles for water vapor, influenced by dynamical processes and the kinetics of particle growth and dependent on the updraft velocities, aerosol number concentrations and differences in size and composition of aerosol particles (Mc-Figgans et al., 2006). Although our understanding of the pro-cesses involved in aerosol activation has increased consider-ably in recent years (Farmer et al., 2015), the inclusion of all the detailed information that might be available about aerosol populations into global and regional circulation models is of-ten impractical. Thus, assessments of the uncertainties de-rived from simplifications assumed are relevant and poten-tially contribute to the discussion on the level of sophistica-tion required by general circulasophistica-tion models (GCMs) with the aim of decreasing the uncertainties.
A large quantity of aerosol particles is generated globally by open biomass burning (Granier et al., 2011; Lamarque et al., 2010; van der Werf et al., 2010), and the impacts of smoke aerosols in climate, air quality and geochemistry have being addressed in several studies (Andreae, 1991; Crutzen and Andreae, 1990; Jacobson, 2004; Langmann et al., 2009; Tosca et al., 2013, and references therein). Vegetation fires plumes can be entrained into upper levels of the troposphere and undergo long-range transport before being removed from the atmosphere if conditions are favorable, e.g., when con-vection activity is high (Andreae, 1991; Andreae et al., 2001; Freitas et al., 2005; Fromm and Servranckx, 2003). During the dry season in South America, observation and numerical model results agree in that biomass burning aerosol origi-nated from extensive fires typically detected over the Ama-zon and central Brazil regions, represents a significant frac-tion of the aerosol burden in southern and southeastern parts of Brazil, in Uruguay and in northern Argentina (Camponog-ara et al., 2014; Freitas et al., 2005; Longo et al., 2010; Ra-manathan, 2001; Rosário et al., 2013; Wu et al., 2011).
Even though a large fraction of biomass burning aerosols has low to moderate hygroscopicity (Carrico et al., 2010; Dusek et al., 2011; Engelhart et al., 2012; Petters et al., 2009; Rissler et al., 2004, 2006), biomass burning particles can act as CCN under sufficiently high atmospheric water vapor su-persaturations (Mircea et al., 2005; Rose et al., 2010; Vestin et al., 2007). Therefore, CCN activation properties of
pyro-genic particles are likely to be relevant for the aerosol climate forcing.
Some external mixing in terms of hygroscopicity seems to be rather common in aerosol populations, particularly over continents (Kandler and Schütz, 2007; Swietlicki et al., 2008). However, average hygroscopicity parameters have been estimated from both observational and modeled data as-suming internal mixing for aerosols from the same emission source (e.g., biomass burning), or even within the same geo-graphical region (Gunthe et al., 2009; Pringle et al., 2010). Sensitivity of CCN activation to hygroscopic mixing state under equilibrium conditions is also significant, and the as-sumption of total internal mixing could result in an overes-timation of the CCN population that can range from 10 to 100 % (Cubison et al., 2008; Ervens et al., 2010; Padró et al., 2012; Wex et al., 2010). The impact of mixing state under dy-namic conditions has, however, been less studied, and some evidence suggests that conclusions from equilibrium condi-tions might not be directly extrapolated to CCN activation during cloud formation (Cubison et al., 2008; Ervens et al., 2010).
The aerosol particle’s composition is known to influence the particle water uptake and CCN activation (Almeida et al., 2014; Mircea et al., 2005; Roberts et al., 2003). Although the effects of composition on the cloud droplet number con-centrations are typically secondary when compared to those of population number concentration and size distribution (Dusek et al., 2006; Feingold, 2003; Hudson, 2007; McFig-gans et al., 2006; Reutter et al., 2009), the extent to which these effects can be safely neglected in GCMs is also yet to be established. Droplet number concentrations were shown to be more sensitive to the presence of organic content than to the updraft velocity in some situations (Rissman et al., 2004). On conditions typical of pyrocumulus (number concentra-tions up to 105cm−3and updraft velocities up to 20 m s−1),
Reutter et al. (2009) found that cloud droplet number concen-tration was sensitive to compositional effects (hygroscopic-ity). For three different ratios of the aerosol number concen-trations to the updraft velocity, and for a fixed aerosol size distribution, the authors found that the sensitivity to hygro-scopicity was low for medium to high hygroscopic values, but moderate for very low and low hygroscopicity values (Reutter et al., 2009). Still, sensitivities to hygroscopicity are likely to be tightly related to the position of the dry critical size of the smallest activated particle within the overall size distribution of the aerosol population, and significant sensi-tivities have been obtained for the population of small aerosol particles with medium and high hygroscopicity (Ward et al., 2010).
loads are present (Nenes et al., 2001). Consequently, pa-rameterizations that assume equilibrium conditions overes-timate CCN when kinetic limitations are important (Nenes et al., 2001; Phinney et al., 2003). However, little is known about how kinetic limitations are related with the particle hy-groscopicity, although a relation between the timescale of the components solubility and activation has been reported (Chuang, 2006).
On the other hand, several observational biomass burning studies conducted in the Amazon region reported rather sim-ilar number size distributions for biomass burning aerosols within the boundary layer (Andreae et al., 2004; Artaxo et al., 2013; Brito et al., 2014; Reid et al., 1998; Rissler et al., 2004, 2006). In terms of hygroscopicity, these smoke par-ticles have been found to be externally mixed (Rissler et al., 2004, 2006). Their population effective hygroscopicity pa-rameter, converted from the original data using expressions suggested by Gunthe et al. (2009), ranged between 0.05 and 0.13 (Rissler et al., 2004, 2006); these compare well with observed values for biomass burning aerosols but are rather on the lower side of the range of values reported elsewhere. Reported values of the hygroscopicity parameter for freshly emitted smoke particles in biomass burning laboratory exper-iments reached values up to 0.6, although a significant num-ber of data indicated values between 0.02 and 0.2, with wood species and smoldering fires producing the less hygroscopic particles (Carrico et al., 2010; Dusek et al., 2011; Engelhart et al., 2012; Petters et al., 2009). An average hygroscopicity parameter of 0.21 was obtained for a 4-day biomass burning episode near Guangzhou, China, using airborne data (Rose et al., 2010). The hygroscopicity parameter obtained from CCN airborne measurements for boreal fires biomass burn-ing aerosols in Canada was 0.18 for both recently emitted and aged aerosols, while the values estimated assuming an aver-age chemical composition were, on averaver-age, 0.11 for fresh aerosol particles and 0.24 for aged ones, both within the level of variability in the value estimated from CCN measurements (Lathem et al., 2013). A recent study of the hygroscopicity of recently emitted and aged smoke particles reported rang-ing between 0.05 and 0.1 for the same parameter in Thailand (Hsiao et al., 2016).
In the present study, we used an adiabatic cloud model to simulate the CCN activation of biomass burning particles, aiming to contribute to the understanding of the possible im-pact of different hygroscopicity values, mixing state and ki-netic limitations in the CCN activated fraction. The model-ing approach followed is described in Sect. 2. Accordmodel-ing to the available observations of biomass burning aerosols in the Amazon region, three typical situations in terms of size dis-tributions and other aerosol parameters were considered in the definition of the case studies and other simulation pa-rameters, as described in Sect. 3. Finally, the results from the cloud parcel model and our conclusions are discussed in Sects. 4 and 5.
2 Modeling approach 2.1 Cloud parcel model
A model of an air parcel assumed to ascend adiabatically at a prescribed updraft velocity and without entrainment to su-persaturation conditions was used to study the activation of aerosol particles in the first stages of cloud development. The air parcel model used in this work is based on the model de-scribed by Pruppacher and Klett (1997), with the supersatu-ration and liquid water mixing ratio tendencies estimated as in Seinfeld and Pandis (2006) and the equilibrium supersat-uration calculated as proposed by Petters and Kreidenweis using the hygroscopicity parameterκp(Petters and
Kreiden-weis, 2007). The pressure is estimated assuming the environ-ment is in hydrostatic equilibrium, and the temperature and water vapor mixing ratio are estimated from the moisture and heat conservation, respectively (Pruppacher and Klett, 1997). The surface tension dependence on temperature is relevant to CCN activation (Christensen and Petters, 2012), and it is calculated asσw/a=7.61×10−2−1.55×10−4(T−273.15)
(Seinfeld and Pandis, 2006) .
The aerosol dry size distribution for each hygroscopic group is discretized into (n) bins with a fixed volume ratio for all bins. Particles that belong to bin size (i) and hygroscopic group (hg) are assumed to grow equally when exposed to the same conditions. Coagulation and coalescence processes are not considered, so the number of particles in each bin re-mains constant while their wet sizes change over time (full-moving size structure) (Jacobson, 2005). In this work, the particle’s critical diameter is determined for each bin size and hygroscopic group as the value that maximized the particle’s equilibrium supersaturation. Aerosol particles with wet size larger than their critical size are considered activated. Par-ticles larger than strictly activated parPar-ticles are considered cloud droplets as well because they have wet sizes larger than that of cloud droplets and can condense significant quantities of water vapor on their surfaces (Nenes et al., 2001). The to-tal cloud droplet number concentration estimated without as-suming equilibrium conditions,Nd,neq, is the sum of strictly
activated particles and those with wet sizes larger than acti-vated particles. To abbreviate the notation, hereafterNdwill
refer toNd,neqat the end of the simulation, unless otherwise
stated.
If particles are presumed to respond instantly to changes in the air parcel supersaturation, particles with critical super-saturation lower than a given supersuper-saturationswill also have dry sizes larger than a dry particle cut diameterddry,c(details
in Appendix B). The cloud droplet concentration estimated thus, here denotedNd,eq, effectively represent the maximum
cloud droplet concentration attainable at supersaturation s. If evaporation and deactivation mechanisms of kinetic lim-itations (Nenes et al., 2001) are significant, the calculation of the cloud droplet spectra from the maximum supersatu-ration assuming equilibrium will lead to an overestimation of the cloud droplet number concentration. In an intermedi-ate approach, particles can be considered cloud droplets if their wet diameters are larger than the approximate cut wet diameter dc that corresponds toddry,c in equilibrium
condi-tions (Appendix B). This approximate estimation, denoted Nd,neqsimp, considers kinetic effects to some extent since the
wet sizes of particles that are compared todc are calculated
explicitly in the cloud model. In order to measure the im-pact of kinetic limitations in the simulations, estimations by the three aforementioned methods are presented. In addition, the ratio between the equilibrium droplet concentration cor-responding to the maximum supersaturation and the droplet concentration, max(Nd,eq)/Nd,neq, was estimated at the time
of maximum supersaturation and at the end of the simulation. The cloud parcel model described was fully implemented in Mathematica®10.0 (Wolfram Research, 2014). Equations for the size of particles in each bin, supersaturation, liquid water mixing ratio, water vapor mixing ratio, air pressure and temperature form a closed system of n+5 nonlinear ordi-nary differential equations (ODEs) in which derivatives de-pend not only on the set of variables but also on their deriva-tives as well. The ODE system was solved using the IDA method from SUNDIAL package (SUite of Nonlinear and DIfferential/ALgebraic equation Solvers) (Hindmarsh, 2000; Hindmarsh and Taylor, 1999), as implemented in the func-tion NDSOLVE of Mathematica. Symbols frequently men-tioned in this section and through the text are summarized in Appendix A.
2.1.1 Sensitivity of CCN to a parameter
Sensitivities S(Xi) in the context of CCN activation were
first introduced by Feingold (2003) as the slope in the linear regression to the logarithms of cloud-top effective droplet ra-diusreffas a function of the logarithms of the parameterXi,
i.e.,SXi=∂lnreff/∂lnXi. Later on, McFiggans et al. (2006) proposed sensitivities of the droplet number concentration Ndto a parameterXi:
SXi=
∂ln(Nd) ∂ln(Xi)
. (1)
According to Eq. (1),Nd∝XiSXi and a sensitivity closer
to zero indicate a smaller increase inNdas parameterXi
in-creases. Sensitivities were calculated from linear regressions
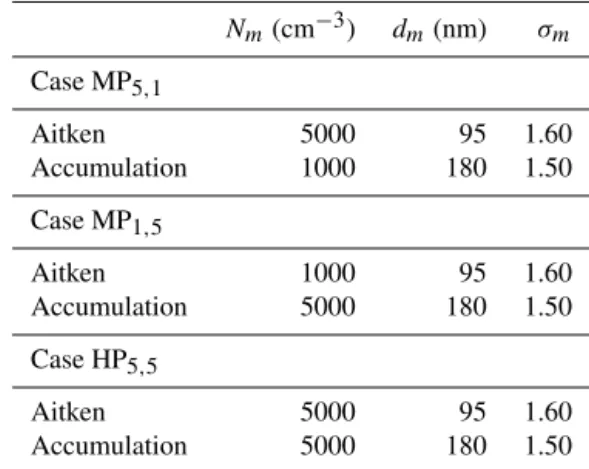
Table 1.Parameters for the Aitken and accumulation lognormal number size distribution for the defined case studies.
Nm(cm−3) dm(nm) σm
Case MP5,1
Aitken 5000 95 1.60
Accumulation 1000 180 1.50
Case MP1,5
Aitken 1000 95 1.60
Accumulation 5000 180 1.50
Case HP5,5
Aitken 5000 95 1.60
Accumulation 5000 180 1.50
in lnNdvs. lnXi curves as averages (slope of the linear fit)
and locally (derivatives of the curves in the ln−ln space).
3 Definition of case studies and simulation parameters In this work, three hypothetical different size distributions were defined as case studies for the cloud model simulations (Table 1). The corresponding number size distributions are depicted in Fig. 1. The parameters of the selected size distri-butions were chosen as to resemble biomass burning aerosol observations in Amazonia (resumed in Table S1 of the Sup-plement) while trying to minimize the impact of particle size and standard deviation. The first case is a moderately pol-luted case with 5000 cm−3particles in the Aitken mode, and
1000 cm−3in the accumulation modes, respectively (MP 5,1)
(Fig. 1a). Case MP5,1is similar to the observed distribution
during the SAMBBA experiment (South American Biomass Burning Analysis, 2012) (Brito et al., 2014). The second is a case study with the same number concentration than MP5,1,
but with higher number of particles in the accumulation mode, with 1000 and 5000 cm−3 in the accumulation and
Aitken modes, respectively (MP1,5) (Fig. 1b). The size
dis-tribution of case MP1,5is comparable to the observed during
LBA-SMOCC (Large-Scale Biosphere Atmosphere Experi-ment in Amazonia – Smoke Aerosols, Clouds, Rainfall, and Climate, 2002) dry-to-wet transition period. There was also a predominance of particles in the accumulation mode dur-ing the biomass burndur-ing episodes of LBA-CLAIRE (Coop-erative LBA Airborne Regional Experiment, 2001) (Rissler et al., 2004), although particle number concentrations were lower for these periods. Finally, the last case is a highly pol-luted case (HP5,5) (Fig. 1c) with 5000 cm−3in both modes,
Figure 1. Schematic number size distributions for MP5,1 (a), MP1,5 (b) and HP5,5 (c) case studies. Total population (black, solid), Aitken (red, solid) and accumulation (blue, solid) modes are indicated. Particles in hygroscopic groupκp=0.04 (dashed line, all colors) are also shown for a population averageκpeff=0.10.
In both CLAIRE and SMOCC experiments, smoke parti-cles were found to be externally mixed in terms of hygro-scopicity (Rissler et al., 2004, 2006). The less hygroscopic group presented very low hygroscopicityκpvalues, between
0.032 and 0.068, while the κp values for the more
hygro-scopic group were low, ranging between 0.110 and 0.172 (Rissler et al., 2004, 2006) (Table S2 of Supplement). Here, the following classification by Gunthe et al. (2009) was con-sidered: very low hygroscopicity (VLH, κp<0.1), low
hy-groscopicity (LH, 0.1≤κp<0.2), medium hygroscopicity
(MH, 0.2≤κp<0.4) and high hygroscopicity (HH, κp≥
0.4). Neither set of observations included smoke particles withκp>0.2. The hygroscopic group number fractions var-ied, with very low hygroscopicity particles accounting for 20 % of the total number concentration (Rissler et al., 2004), or up to 85 % (Rissler et al., 2006) (Table S2). As a result, the population effective hygroscopicity parameter κpeff ranged
between 0.05 and 0.13.
To assess the role of aerosol mixing state outside equilib-rium conditions, cloud model simulations were conducted for populations both externally and internally mixed. The variability in the population effectiveκpeffwas simulated
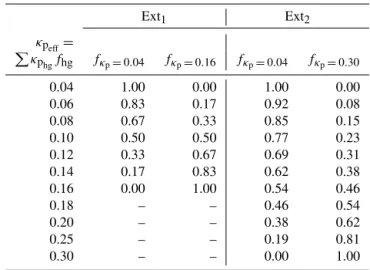
as-Table 2.Number fractions for the hygroscopic groups in the exter-nally mixed populations Ext1and Ext2.
Ext1 Ext2
κpeff=
P
κphgfhg fκp=0.04 fκp=0.16 fκp=0.04 fκp=0.30
0.04 1.00 0.00 1.00 0.00
0.06 0.83 0.17 0.92 0.08
0.08 0.67 0.33 0.85 0.15
0.10 0.50 0.50 0.77 0.23
0.12 0.33 0.67 0.69 0.31
0.14 0.17 0.83 0.62 0.38
0.16 0.00 1.00 0.54 0.46
0.18 – – 0.46 0.54
0.20 – – 0.38 0.62
0.25 – – 0.19 0.81
0.30 – – 0.00 1.00
suming that the population is composed by two populations externally mixed in terms of hygroscopicity, having κp=
0.04 and κp=0.16, respectively, with a resultant
popula-tion effective hygroscopicity estimated asκpeff=Pκphgfhg
(Gunthe et al., 2009) that varies according to the number fractionfhg of each hygroscopic group, hg (Table 2). This
case is denoted Ext1. A second possibility, denoted Ext2, was
considered to account for more hygroscopic biomass burning aerosols observed for other biomass/regions. In this second case, theκpof the more hygroscopic group is increased from κp=0.16 to a medium hygroscopicity value,κp=0.30, with a resultant population effective hygroscopicity also varying according to the number fraction of each hygroscopic group (Table 2). Finally, the internally mixed population was de-noted Int. Results obtained for two hygroscopic groups of particles externally mixed are compared with results obtained if the population is assumed to be internally mixed. The min-imum/maximumκpeff in both sets of externally mixed
popu-lations is reached for the extreme case when only one group is present (therefore reducing to the internally mixed case) and is equal to the hygroscopicity parameter of particles in this group.
The effectiveκpeffand the corresponding fractions of each
group for both situations and different fractions of the hygro-scopic groups are presented in Table 2. The schematic size distribution of the aerosol total population and that of the hy-groscopic group withκp=0.04 are indicated in Fig. 1 for the three case studies, for aκpeff=0.10 and Ext2external mixing
MP1,5and HP5,5cases, in order to analyze the effect of
hy-groscopicity. Simulations conducted for the externally mixed population (Ext1and Ext2) ranged between the minimum and
maximumκpeff(0.04 to 0.16 and 0.04 to 0.30, respectively).
Updraft velocities between 0.1 and 10 m s−1 were
con-sidered. Higher number concentrations than considered here can be found in pyrocumulus, but it is probably safe to as-sume that their impact on the hydrological cycle and aerosol indirect effect on a regional scale is secondary when com-pared with that of the regional haze, so these extreme cases of polluted conditions were not covered in our study. Ac-cording to the regimes proposed by Reutter et al. (2009), our study focused largely on the aerosol-limited and aerosol- and updraft-sensitive regimes, with particle number concentra-tions that characterize polluted condiconcentra-tions like those found in the regional haze. For MP5,1and MP1,5cases, the
updraft-limited case is given approximately byW≤1 m s−1, but the
aerosol-limited is given byW≥6 ms−1. For the HP5,5case,
the approximate limit of the updraft-limited case is given by W ≤1 m s−1, and the aerosol-limited byW≥10 m s−1(not
considered in our simulations).
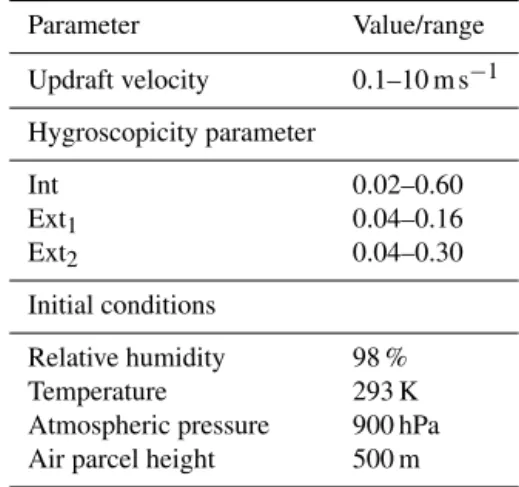
Cloud-base initial conditions for the simulations were tem-perature of 293 K, atmospheric pressure of 900 hPa and rel-ative humidity of 98 %. Sensitivity tests indicated only a weak dependence (absolute differences between maximum supersaturations obtained initializing at 80 and at 99 % be-low 0.03 %) of maximum supersaturations with the initial relative humidity for the highest updraft values, and a neg-ligible effect in the activated fraction (see Fig. S1 of the Sup-plement). To avoid unrealistic physical parameters, the final time of simulation was defined somewhat arbitrarily as the time required for the parcel to ascend 500 m at the consid-ered updraft velocity. The parameters for the simulations are summarized in Table 3. The distribution was discretized into 1000 bins ranged from 15 to 104nm, leading to a relative error of less than 0.003 % with respect to the lognormal dis-tribution for all the cases considered in this study. To exclude particles that are not large enough to activate, only particles larger than 30 nm (Na,30) were considered as aerosol
num-ber concentrations in the calculation ofNd/Nafractions. For
all the cases considered, the cloud nuclei larger than 30 nm fraction included almost all particles, with the lowest fraction Na,total/Na,30=0.994 obtained for case MP5,1.
4 Results and discussion
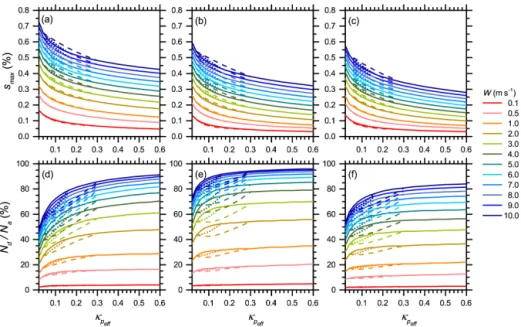
Maximum values of supersaturation and CCN activated frac-tion, as a function of hygroscopicity, updraft velocity and mixing state, are presented in Fig. 2 for the various proposed case studies and mixing states. Due to the high particle num-ber concentrations that characterize polluted conditions in the three case studies, maximum supersaturations reached in the simulations were typically low and, except for the high-est updraft velocities and for very low hygroscopicity values
Table 3.Parameters for the simulations.
Parameter Value/range
Updraft velocity 0.1–10 m s−1
Hygroscopicity parameter
Int 0.02–0.60
Ext1 0.04–0.16
Ext2 0.04–0.30
Initial conditions
Relative humidity 98 %
Temperature 293 K
Atmospheric pressure 900 hPa Air parcel height 500 m
(VLH,κp<0.1), had values below 0.5 % in the MP5,1case
and below 0.4 % in the MP1,5 and HP5,5 cases. The
high-est values of maximum supersaturation were obtained for the MP5,1case, with the majority of particles in the Aitken mode.
Maximum supersaturations in this case were, on average,
∼0.10 % larger (absolute differences) than those obtained for MP1,5case, and about 0.15 % higher than those obtained
for HP5,5 case. Meanwhile, the values of maximum
super-saturation reached in the MP1,5case study were higher than
those obtained in the HP5,5case, but slightly higher, with
ab-solute differences between maximum supersaturation values of up to 0.05 %, all else being equal, in spite of the much higher particle number concentrations in the latter case. The case study with the highestNa, HP5,5, presented the largest
cloud droplet number concentrations. However, the largest Nd/Nafractions were instead reached in the MP1,5case, all
else being equal. The activated fractions for the HP5,5case
were the lowest between all three cases for all values of κp within the low hygroscopicity (LH, 0.1≤κp<0.2) and
medium hygroscopicity (MH, 0.2≤κp<0.4) ranges, while
for κp in the VLH range the lowest Nd/Na fractions were
obtained for the MP5,1case.
These results for the maximum supersaturations and Nd/Nafractions are explained by the Köhler theory, which
predicts that the Kelvin term typically dominates the grow-ing process for larger particles, while the Raoult term is more relevant for smaller ones. Therefore, particles in the accumu-lation mode are likely to condense water vapor on their sur-faces more readily than the comparatively smaller particles in the Aitken mode, growing larger and impacting the maxi-mum supersaturation reached more than the latter. Moreover, the Raoult term is more significant the smaller the particle; thus, the activation of particles in the Aitken mode is ex-pected to be more altered by hygroscopicity than the acti-vation of particles in the accumulation mode.
Among the variable parameters within the simulations, both maximum supersaturations andNd/Na fractions were
Figure 2.Maximum supersaturation reached (top) and fraction of particles activated (bottom) for the internal mixing (solid line) and external mixing cases Ext1(dotted line) and Ext2(dashed line). Plots on columns(a, d),(b, e)and(c, e)are for MP5,1, MP1,5and HP5,5case studies, respectively. The color scale refers to the updraft velocities from 0.1 to 10 m s−1.
mixing states. Mean sensitivities of NdtoW in the MP5,1,
MP1,5and HP5,5 study cases were 0.66, 0.65 and 0.73,
re-spectively, with very little variability with mixing state, as illustrated in Fig. 3 for κpeff=0.10. These mean values of SW are higher than previous estimations of 0.18 and 0.47 for
clean (<1000 cm−3) and polluted (1000–3000 cm−3)
con-ditions, respectively, by McFiggans et al. (2006). However, an increase in the sensitivity toW with the number concen-tration is consistent with the behavior expected within the updraft- and aerosol-sensitive regime that is, on average, the predominating regime. The adjusted R2 coefficients in the linear fits of the lnNd vs. lnW curves were ≥0.90 for all
cases and mixing states. However, the data points departed from the mean slope towards low and high updraft veloci-ties for all case studies and mixing states (Fig. 3, top). Cloud droplet number concentrations were more sensitive (localSW
up to 0.9) to increases in the updraft velocity for veloci-ties within the updraft-limited regime, while for the aerosol-limited regime the sensitivity to W decreased to values be-tween 0.1 and 0.4 (Fig. 3, bottom). This varying sensitiv-ity ofNdtoW is in agreement with the changing behavior within each regime of CCN activation described by Reutter et al. (2009), which varies from a high sensitivity of activa-tion with W in the updraft-limited regime to almost no in-fluence in the aerosol-limited one. The sensitivity ofNdto
the aerosol number concentrations and the geometric mean diameter and standard deviation have been discussed else-where (McFiggans et al., 2006; Reutter et al., 2009) and was not addressed here.
In contrast withSW, the sensitivity to hygroscopicitySκp
changed substantially with mixing state; this will be dis-cussed in Sect. 4.2.
4.1 Aerosol mixing state
The aerosol mixing state modified both maximum supersatu-rations and activated fractions, although to different extents. The values of maximum supersaturation were slightly under-estimated for updraft velocities in the aerosol-limited and the aerosol- and updraft-sensitive regimes when internal mixing was assumed (Fig. 2, top). The absolute differences were up to∼0.01 and ∼0.03 % for the externally mixed Ext1 and
Ext2populations, respectively. For updraft velocities within
the updraft-limited regime, however, the maximum supersat-uration reached were lowest, and the values assuming an in-ternal mixing were almost identical or marginally higher than those reached for externally mixed populations.
On the other hand, the internal mixing hypothesis typi-cally led to overestimations ofNd, regardless of the
Figure 3.Number of particles activated (top) and sensitivitySW of Ndto the updraft velocityW(bottom) forκpeff=0.10, obtained for the MP5,1(solid line), MP1,5(dashed line) and HP5,5(dotted line) case studies. Results for internal mixed Int population and exter-nally mixed populations Ext1and Ext2are in black, red and blue, respectively.
is presumed, the number of more hygroscopic particles that become cloud droplets would be underestimated.
Although differences in activation for more and less hy-groscopic particles due to internal mixing will contribute with opposite signs to the total Nd derived from mixing
state, they are unlikely to cancel each other out. In a simu-lation selected to illustrate the impact of mixing state inNd,
an externally mixed population (Ext2) has one hygroscopic
group with κp=0.04, in the VLH range, present in a
frac-tionfκp=0.04=0.77, and a second hygroscopic group with κp=0.30, within the MH range, withfκp=0.30=0.23.
As-suming internal mixing (Int), these two groups resulted in κpeff=0.10 (Table 2). For this specific case, the schematic
size distribution of particles that are activated as CCN in the MP5,1, MP1,5and HP5,5case studies at a prescribed updraft
velocity of W=5 m s−1 are presented for external and
in-ternal mixtures in Fig. 4. The values of maximum supersat-urations reached were somewhat lower when internal mix-ing state was assumed, between 2 and 3 % dependmix-ing on the study case. A fraction of particles in the MH hygroscopic
Figure 4.Schematic number size distribution of particles activated in Ext2(hatched area) and Int (grey area) mixing states, for an av-erageκpeff=0.10 andW=5 m s−1, for(a)MP5,1,(b)MP1,5and (c)HP5,5case studies. Total aerosol population (black, solid line), hygroscopic groupκp=0.04 (black, dashed line) and maximum su-persaturation reached in the simulations for each mixing state are indicated.
group (κp=0.30) was indeed activated as CCN in the
exter-nally mixed Ext2 but was not in the internal mixing, since
the internally mixed populationκpeffis lower and thus the cut
size for activation in the internally mixed population is larger. However, an even larger fraction of the particles in the VLH group were not activated in the external mixing, but these were considered as activated when an internal mixing state was assumed. Thus, in this example, and characteristically in the conducted simulations, assuming internal mixing for an externally mixed population led to an overestimation ofNd.
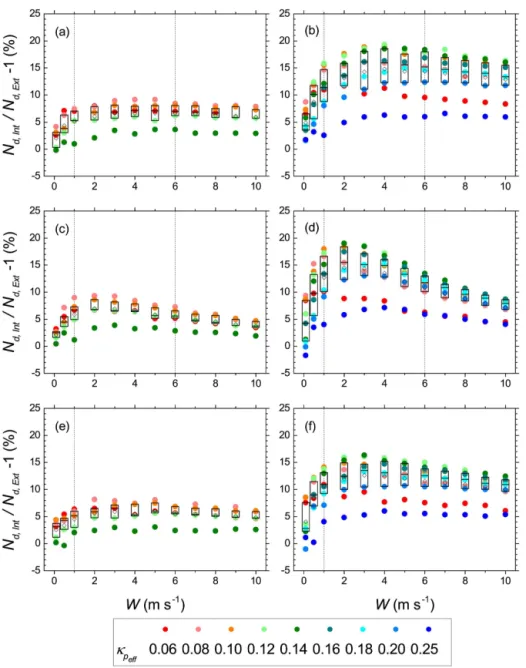
Box plots on top of data in Fig. 5 display the magnitude of the overestimation inNdif internal mixing is assumed for an externally mixed population, for the range of updraft ve-locities and κpeff. The overestimation ofNd was expressed
as Nd,Int/Nd,Ext−1, where Nd,Int and Nd,Ext refer to
esti-mations for internally and externally mixed populations, re-spectively, and the population is considered to be externally mixed. Overestimations ofNdwhen assuming internal
Figure 5.Overestimation ofNdwhen the aerosol is assumed internally mixed, calculated as a function of the hygroscopicity (color scale) and the updraft velocity, for the external mixing Ext1(left) and Ext2(right). Plots on panels(a, b),(c, d)and(e, f)correspond to MP5,1, MP1,5and HP5,5case studies, respectively. Box plots on top of data represent the spread for different hygroscopicity parameters. The box boundaries delimitate the interquartile range and mean values are indicated by diamond symbols. Dashed lines represent the approximate boundaries between CCN activation regimes.
with closest value of hygroscopicity in the external mixture was greater, i.e., when the internally mixed assumption was comparatively less valid. Overestimations close to the lower limit or below the interquartile range of CCN overestimations were obtained for populations with fractionsfκp=0.16≥0.67
in the Ext1 (with a resulting κpeff≥0.12), and fκp=0.30≥
0.62 in the Ext2 mixing (κpeff≥0.2). Within the
aerosol-and updraft-sensitive regime, the overestimations ofNdwere largest for all three cases. The higher number concentration of particles in the Aitken mode in the MP5,1and HP5,5case
studies resulted in larger overestimations in the CCN number
concentrations even for the upper range of updraft velocities. In contrast, the overestimations ofNddecreased noticeably
as the updraft velocity increased towards the aerosol-limited regime for the MP1,5case. Within the updraft-limited regime
the typically low fractions of activated particles, as well as the estimations ofNd,Int/Nd,Ext−1, were more susceptible to
inaccuracies due to bin resolution.
Average overestimations ofNd for the externally mixed population Ext1were typically low, 5.7±2.4, 5.1±2.1 and
2.9±2.0 %, or the MP5,1, MP1,5 and HP5,5 case studies.
were slightly higher, 12.4±4.7, 10.4±4.5 and 10.5±3.8 %, respectively. However, with particle number concentra-tions of 10 000 cm−3 in the HP
5,5 case and 6000 cm−3 in
the MP5,1 and MP1,5 case studies, the absolute
overes-timations (Nd,Int−Nd,Ext) in the CCN number
concentra-tion for these cases were, respectively, 160±94, 181±96 and 224±137 cm−3 for Ext
1 simulations and 349±203,
358±188 and 467±272 cm−3 for Ext
2. Maximum
abso-lute overestimations were reached for higher updrafts, for which theNd/Na fraction was higher for all mixing states.
For Ext1 simulations, the maximum absolute
overestima-tions were 304, 323 and 432 cm−3 for the MP
5,1, MP1,5
and HP5,5cases, respectively, while in Ext2simulations for
the same study cases they were of 637, 642 and 838 cm−3.
The high aerosol number concentrations considered here, although characterizing polluted conditions like those that could be found in regional hazes in the Amazonia region, are still moderate in comparison with concentrations inside pyrocumulus.
It is important to note that, were the maximum supersatu-rations achieved in simulations for both mixing states to be the same, Nd would be higher in the internal mixing case
simulations and the CCN overestimations derived from as-suming internal mixing would be larger. This difference in the achieved maximum supersaturations does not explain the much smaller impact of mixing state found for cloud parcel model results when compared to those obtained for equilib-rium conditions and prescribed supersaturations, but is likely to contribute to it since, in the latter, the same maximum su-persaturation is assumed in the estimation ofNdfor the
dif-ferent mixing states.
For Amazon smoke particles, these results indicate an overestimation in Nd derived from assuming internal
mix-ing overestimation for an externally mixed population that is below 10 % for all conditions.
4.2 Hygroscopicity
The behavior of the CCN activation, as hygroscopicity changed, was distinctly different for the different mixing states. When the population was assumed to be internally mixed, the mean average sensitivity to hygroscopicity, Sκp,
was low for the case MP5,1(0.20), and very low for MP1,5
(0.10) and HP5,5(0.12) case studies. These estimations are in
good agreement with those by Reutter et al. (2009) and Ward et al. (2010). For the externally mixed population, however, ln−ln curves were far apart from a linear behavior and it was not possible to achieve linear fits. Obtained adjustedR2 pa-rameters were close to zero or negative and hence average sensitivities for externally mixed populations were not esti-mated.
Local sensitivities for the internal mixing state typically decreased as the hygroscopicity parameter increased, start-ing from median values of ∼0.35 for the MP5,1case study
and of∼0.20 for the MP1,5and HP5,5case studies (Fig. 6)
Figure 6.Box-and-whisker plots of the sensitivitySκpofNdto the hygroscopicity parameterκp, showing spread of results for updraft velocities between 0.1 and 10 m s−1, for(a)MP5,1,(b)MP1,5and (c)HP5,5case studies. Box bounds show the interquartile range, the mean value is indicated by a small square, and whiskers delimitate minimum and maximum values. Results for the internally mixed Int and externally mixed populations Ext1and Ext2are plotted in black, red and blue, respectively.
until almost stabilizing at values close to 0.15, 0.05 and 0.10 for the same cases for values ofκpwithin the medium and
high hygroscopicity ranges. Notable exceptions were found within the updraft-limited regime for populations with high hygroscopicity where the impact of kinetic effects was high, as will be addressed later in Sect. 4.3. Except for cases within the updraft-limited regime, where kinetic limitations were significant, we found that the impact of the hygroscopicity parameter inNdwas very low for internally mixed
popula-tions andκpwithin the MH or the HH ranges, while forκp
values within the VLH range the impact was low to moder-ate, in agreement with results obtained by previous studies (Dusek et al., 2006; McFiggans et al., 2006; Reutter et al., 2009; Ward et al., 2010).
On the other hand, the localSκpeff for the externally mixed
populations presented mean values (over results for different updraft velocities) that increased withκpefffrom very low or
even negative to values between 0.3 and 0.45 for the high-estκpeff values (Fig. 6). This higher sensitivity ofNdtoκpeff
inNdobtained for the external mixing results for the larger averageκpeffvalues (Fig. 2, bottom).
The increasingSκpefffor external mixing cases can be
illus-trated through the consideration of the following example for the HP5,5case and an updraft velocityW=5 m s−1. In the
internally mixed population withκp=0.30, 62 % of the
to-talNdwas activated. If the internally mixed population has,
instead, κp=0.25, the resultingNd/Na fraction is∼61 %.
However, if the population with κpeff=0.25 is instead
ex-ternally mixed, the fraction of particles withκp=0.30 that
reached activation increased to 67 %, but, of the particles withκp=0.04 (19 % of total population), only 22 % reached
activation. Consequently, even when the MH particles pre-dominated, the resulting ratio was 58 %, a more significant decrease from the case withκp=0.30 than in the internally
mixed population case.
Considering the results from the simulations and the little variability and low values ofSκpeff for internally mixed
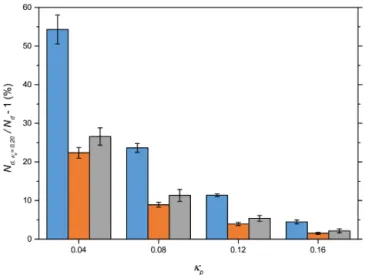
pop-ulations, variations in hygroscopicity within the MH and HR could be considered instead as secondary and neglected, es-pecially if the difference in hygroscopicity is not large, since the level of sophistication within GCMs should be kept at a minimum whenever the accuracy of results is not compro-mised. When the hygroscopicity is within the LH and VLH, however, the overestimation in the activated fraction might also be substantial, as illustrated in Fig. 7 for updraft veloc-ities in the updraft- and aerosol-sensitive regime, for inter-nally mixed populations. In the extreme case whenκp=0.20
was assumed for a population ofκp=0.04, the mean
over-estimation of the CCN population for the MP5,1, MP1,5and
HP5,5was 54.3±3.7, 22.4±1.4 and 26.6 ±2,3 %,
respec-tively. In comparison, ifκp=0.60 was presumed for aerosols withκp=0.20, the mean overestimations ofNdobtained for
the MP5,1, MP1,5and HP5,5cases and the same range of
up-draft velocities were 15.5±1.6, 4.8±0.3 and 6.4±0.8 %, respectively.
A significant overestimation of Nd can thus result from
assuming a hygroscopicity in the MH range for the Amazon smoke aerosols. These results suggest that larger values ofκp
like those recommended for continental aerosol or biomass burning particles in other regions of the world are not ad-equate to describe the CCN activation behavior of Amazon smoke particles.
4.3 Kinetic limitations
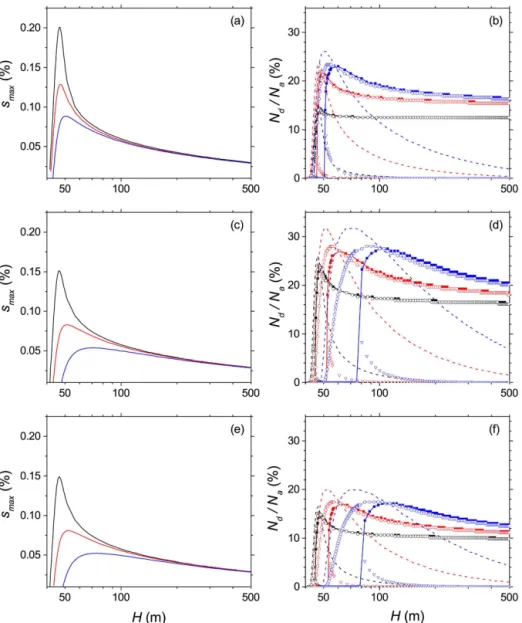
Temporal series of the CCN activation with resolutions of 0.5 and 1 s near the time of maximum supersaturation for strong and low to moderate updrafts, respectively, were used to an-alyze the particle growth and activation evolution in time. Three separate effects in the evolution ofNdwere observed
in the simulations for weak and sometimes even moderate updrafts that could be attributed to the effect of kinetic lim-itations: (1) a delay between the time when maximum su-persaturation was reached and the time when the activated
Figure 7.Overestimation ofNd (mean±standard deviation over the updraft velocities in the updraft- and aerosol-sensitive regime) whenκp=0.20 is assumed, as a function of the populationκp. Re-sults correspond to MP5,1(blue), MP1,5(orange) and HP5,5(grey) case studies for an internally mixed population.
fraction is largest; (2) a decrease in the number of activated particles with cloud depth after the maximum activated frac-tion is reached; and, finally, (3) a overestimafrac-tion ofNd if
assuming that equilibrium applies.
The delay in activation was amplified with the increase in the particleκpeff. A relation to particle size and number
con-centration was also apparent, being the delay longest for the HP5,5 case, moderate in the MP1,5 case, and much shorter
for the MP5,1case, also for largeκpeff values and weak
up-drafts. This is illustrated in Fig. 8 for an internally mixed pop-ulation andW=0.5 m s−1. Due to the delay in activation a
significant fraction of particles was typically not activated at the time maximum supersaturation was reached. Within the updraft-limited regime, the delay in the activation was such that at the time of maximum supersaturation no particles are activated for internally mixed populations withκpeffabove a
certain threshold. For an updraft velocity of=0.5 m s−1, this
threshold wasκpeff=0.50 for the MP5,1case andκpeff=0.35
for the MP1,5 and HP5,5 cases. In the MP1,5 case, for an
updraft velocity W=3 m s−1, already in the updraft- and
aerosol-sensitive regime, the threshold was stillκpeff=0.35.
The maximum value ofNd,neqsimp was also reached
some-time after the maximum supersaturation is reached, and its value was slightly higher than the maximum ofNd,neq. How-ever, the strong kinetic effects obtained for the larger κpeff
values near the time of maximum supersaturation forNd,neq
were not as strong forNd,neqsimp. After the maximumNd,neqis
reached, however, differences between both estimations are below 1 % and at the end of the simulation both estimations are very similar. The fraction of particles not strictly acti-vated inNd,neqwas important only near the time of maximum
influ-Figure 8.Supersaturation (left) and aerosol activated fraction (right) as a function of cloud height for an internally mixed population with κp=0.06 (black),κp=0.25 (red) andκp=0.60 (blue), andW=0.5 m s−1. The cloud droplet concentration was estimated as eitherNd,eq (dashed line),Nd,neqsimp(solid line, open circles) orNd,neq(solid line, close squares). The fraction of the population not strictly activated in Nd,neqis indicated (open downward-facing triangles). Plots on panels(a, b),(c, d)and(e, f)correspond to MP5,1, MP1,5and HP5,5case studies, respectively.
ence in results presented in previous sections, where cloud droplet concentrations were estimated at the end of the sim-ulation. However, the differences near the time of maximum supersaturation would be larger if this fraction is disregarded. For the externally mixed population Ext1, althoughNd,neq
was significantly lower than Nd,eq for weak updrafts, in
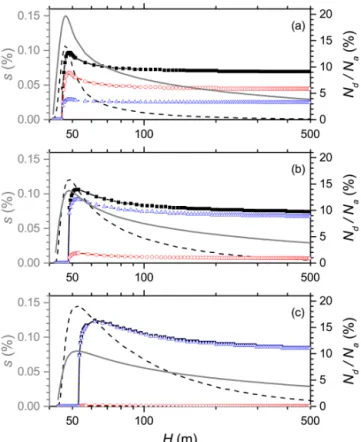
all the cases at least a fraction of particles was activated at the time of maximum supersaturation. For Ext2 and W =0.5 m s−1, however, populations with κ
peff≥0.12, or fκp=0.30≥0.31, also showedNd,neq=0 for both MP1,5and
HP5,5 cases at the time of maximum supersaturation. This
is exemplified in Fig. 9 for three values of the effective hy-groscopicity parameter. Interestingly enough, particles from
both hygroscopic groups failed to activate in these condi-tions. The value of maximum supersaturation was very low in these cases, and it is likely that particles in the more hygro-scopic group condense the limited water vapor on their sur-faces more readily, although not in great enough quantities as to activate themselves, but limiting the water vapor available to less hygroscopic particles even more and preventing their activation as well. Particles from both groups seem to grow rather slowly, and both groups appear to activate at the same time.
res-Figure 9. Supersaturation (left axis, grey) and aerosol activated fraction during the simulation (right axis) for the Ext2population and the HP5,5case study, forW=0.5 m s−1andκpeff=0.06(a), κpeff=0.14(b)andκpeff=0.25(c). The cloud droplet concentra-tion was estimated asNd,eq(dashed line), andNd,neqfor the popu-lation (black solid line, close squares) and hygroscopic groups with κp=0.04 (red dashed line, open circles) andκp=0.30 (blue dotted line, open upward-facing triangles).
olution of the time series. Within the updraft-limited regime, the mean overestimation ofNd,neqin comparison withNd,eq
over the range ofκpeff, excluding those that led toNd,neq=0,
ranged from ∼10 to ∼100 % in internally mixed popula-tions, and between ∼10 and ∼250 % in externally mixed ones (Fig. 10), being larger for the higher values of κpeff.
However, for all case studies and mixing states, the overesti-mation at the time of maximum supersaturation was typically below 12 % within the updraft- and aerosol-sensitive, and be-low 5 % within the aerosol-limited regime.
The overestimation of Nd,neq at the time of maximum supersaturation if assuming equilibrium applies can be ex-plained by the evaporation mechanism. However, as the cloud depth increases, and in particular at the defined end of the simulation, the deactivation mechanism can be more relevant. Although Nd,neq was always lower at the end of
the simulation than at its maximum, the difference was typi-cally low, between 2 and 10 % for most updraft velocities and mixing states, as evidenced in the similar overestimations of both values by max(Nd,eq). Both evaporation and
deactiva-tion mechanisms were relevant for weak and even moderate updrafts, and a relation with particle size and number concen-tration was apparent, as previously reported by Nenes et al. (2001) for ammonium sulfate particles. Our results are also consistent with the reduction in the droplet concentrations of up to 35 % due to kinetic limitations found by Roberts et al. (2003) for updrafts of 0.1 m s−1and aerosol data
correspond-ing to the dry season in Amazonia.
In our results, the effects of kinetic limitations were strong when a significant fraction of particles with hygroscopicity in the MH or LH range was present. However, for particles with low and very low hygroscopicities like the Amazon smoke particles, kinetic limitations were less important, even if large aerosol loads were present.
A relation between the timescale of solubility and the CCN activation behavior of aerosols is known (Chuang, 2006), and several studies have analyzed kinetic limitations by compar-ing the aerosol particles’ growth and that of a calibration aerosol with a high solubility and the same critical super-saturation, with mixed conclusions regarding the importance of this process to CCN activation (Bougiatioti et al., 2011; Engelhart et al., 2008; Padró et al., 2012; Raatikainen et al., 2012; Ruehl et al., 2007). However, at the low supersatura-tions reached as a result of the weak updraft velocity and the large aerosol loads considered, the kinetic limitations dis-cussed in this study derive more likely from the differences in water uptake and critical supersaturation due to the particle hygroscopicity.
5 Conclusions
The available data on smoke particles in the Amazon region (Sect. 3) suggest that this aerosol population has a rather con-sistent size and that external mixing of two particle groups having very low and low hygroscopicity, respectively, is typ-ical for this aerosol population. We conducted cloud model simulations using three hypothetical case studies and a vari-ety of hygroscopicities and mixing states that resembled typ-ical conditions found in the literature for smoke aerosols in the Amazon in moderate to highly polluted conditions. Sim-ulations were conducted for these three case studies to esti-mate the effect of different values of hygroscopicity and mix-ing state, includmix-ing those conditions that resemble observed data for smoke particles (Ext1). The impact of kinetic
limita-tions was assessed.
The impact in the surface tension due to the organic ma-terial present in smoke aerosols is likely to be relevant (Fors et al., 2010; Giordano et al., 2013), but was not included in this work due to the complex organic composition of these particles that lead to difficulties for its modeling. We con-sider this a limitation of our results that should be addressed in future works.
Figure 10. Overestimation of Nd when the population is estimated assuming equilibrium at the time of maximum supersaturation, max(Nd,eq), compared withNd,neqat the time of maximum supersaturation (blue) and at the end of the simulation (orange), for the range of updraft velocities. Values correspond to the MP5,1(a–c), MP1,5(d–f)and HP5,5(g–i)case studies. The mixture of the aerosol population was either internal (left panels) or external as in Ext1(middle panels) and Ext2(right panels)
κpeff was found for medium and large hygroscopicity when
the population was internally mixed. However, for particles with hygroscopicity in the lower range ofκpeff(<0.20), the
effective hygroscopicity of smoke particles for the Amazon appears to stand in the VLH and LH ranges, where the sen-sitivity to this parameter was found to be moderate. There-fore,Ndcould be overestimated significantly if larger values
of hygroscopicity, like those suggested for biomass burning particles elsewhere, were to be used for Amazonia smoke particles.
Hygroscopic mixing state in the conducted cloud model simulations led to differences lower than those obtained in previous studies that addressed mixing state for equilibrium conditions and prescribed supersaturations. In particular, the overestimation ofNdwas low for populations similar in
hy-groscopicity to the Amazon smoke aerosols (Ext1in the
sim-ulations), but slightly higher when the external mixing was between groups with VLH and MH (Ext2).
The parameter κpeff posed a much larger impact on the
CCN activation within the MH range for externally mixed populations than for internally mixed ones, even for low frac-tions of VLH aerosols. Whenκpeff is estimated assuming
in-ternal mixing, and in particular when particles of VLH are present, it is important to take into account that the typically
low sensitivity to hygroscopicity of internally mixed popu-lations does not apply and even relatively small variabilities inκpeff could affect the CCN activation behavior of the
pop-ulation. Consequently, assuming internal mixing of particles with very low and low-hygroscopicity particles with moder-ate or large hygroscopicity should be avoided.
Finally, kinetic limitations were found to be much lower for particles within VLH and LH hygroscopic groups, and therefore its impact on the CCN behavior of Amazon smoke particles is expected to be limited, in spite of the presence of large aerosol loads.
regions, in particular when values in the very low or low range of hygroscopicity are to be considered. Also, for Ama-zonia smoke aerosols, the choice of a parameterization that accounts for kinetic limitations, typically more demanding in terms of computational resources, might not improve results significantly over a parameterization that does not account for their impact.
6 Data availability
Appendix A: Nomenclature of frequently used symbols CCN Cloud condensation nuclei
dry,c Particle cut diameter for activation (dry) fhg Number fraction of hygroscopic group (hg) Na Aerosol number concentration
Nd Cloud droplet number concentration
Nd,eq Ndestimated assuming equilibrium conditions Nd,neq Ndestimated without assuming
equilibrium conditions s Supersaturation
smax Cloud maximum supersaturation SXi Sensitivity ofNdto the parameterXi
t Time
T Temperature
W Cloud parcel updraft velocity κp Specific hygroscopicity parameter
by Petters and Kreidenweis (2007)
κpeff Population effective specific hygroscopicity parameter
Appendix B: Simplified Köhler equation and estimation of the cut diameter for CCN activation
For an aerosol particle with dry diameter ddry formed by
a soluble fraction and an insoluble core, the Köhler equa-tion can be approximated by the expression (Pruppacher and Klett, 1997)
s≈A
d −
Bddry3
d3−ddry3, (B1)
wheresis the supersaturation,d is the particle wet diameter, and termsAandBare parameters in the curvature and solute terms of the Köhler equation. In this work,B was assumed to be identical to the parameterκpfor all values ofκpands.
It can be shown (Pruppacher and Klett, 1997) that the par-ticle cut wet diameter for activationdccan be estimated as
dc= −D+(D2−E)1/2, (B2)
where the parametersDandEare estimated as
D=B
2A−3BAs
3Bs2−3B2s (B3)
and
E= 3BA
2
3Bs2−3B2s. (B4)
Finally, the corresponding dry diameter of the smallest ac-tivated particle,ddry,c, can be calculated as
ddry,c3= dc
3(A−sd c) A+(B−s)dc
The Supplement related to this article is available online at doi:10.5194/acp-17-2373-2017-supplement.
Competing interests. The authors declare that they have no conflict of interest.
Acknowledgements. The authors thank three anonymous referees for their valuable suggestions and comments that contributed significantly to the improvement of the present paper. This work was supported by the São Paulo Research Foundation (FAPESP), through the projects 2012/13575-9, DR 2012/09934-3, BEPE 2013/02101-9 and BPE 2014/01564-8.
Edited by: H. Coe
Reviewed by: three anonymous referees
References
Abdul-Razzak, H. and Ghan, S.: A parameterization of aerosol ac-tivation: 2. Multiple aerosol types, J. Geophys. Res., 105, 6837– 6844, 2000.
Abdul-Razzak, H. and Ghan, S. J.: A parameterization of aerosol ac-tivation: 3. Sectional representation, J. Geophys. Res, 107, 4026, 10.1029/2001JD000483, 2002.
Almeida, G. P., Brito, J., Morales, C. A., Andrade, M. F., and Artaxo, P.: Measured and modelled cloud condensation nu-clei (CCN) concentration in São Paulo, Brazil: the importance of aerosol size-resolved chemical composition on CCN con-centration prediction, Atmos. Chem. Phys., 14, 7559–7572, doi:10.5194/acp-14-7559-2014, 2014.
Andreae, M.: Biomass burning: its history, use, and distribution and its impact on environmental quality and global climate, MIT Press, 3–21, 1991.
Andreae, M. O., Artaxo, P., Fischer, H., Freitas, S. R., Grégoire, J.-M., Hansel, A., Hoor, P., Kormann, R., Krejci, R., Lange, L., Lelieveld, J., Lindinger, W., Longo, K., Peters, W., de Reus, M., Scheeren, B., Silva Dias, M. A. F., Ström, J., van Velthoven, P. F. J., and Williams, J.: Transport of biomass burning smoke to the upper troposphere by deep convection in the equatorial region, Geophys. Res. Lett., 28, 951–954, doi:10.1029/2000GL012391, 2001.
Andreae, M. O., Rosenfeld, D., Artaxo, P., Costa, A. A., Frank, G. P., Longo, K. M., and Silva-Dias, M. A. F.: Smok-ing rain clouds over the Amazon, Science, 303, 1337–1342, doi:10.1126/science.1092779, 2004.
Artaxo, P., Rizzo, L. V., Brito, J. F., Barbosa, H. M. J., Arana, A., Sena, E. T., Cirino, G. G., Bastos, W., Martin, S. T., and Andreae, M. O.: Atmospheric aerosols in Amazonia and land use change: from natural biogenic to biomass burning conditions, Faraday Discuss., 165, 203–235, doi:10.1039/C3FD00052D, 2013. Ban-weiss, G. A., Jin, L., Bauer, S. E., Bennartz, R., Liu, X.,
Zhang, K., Ming, Y., Guo, H., and Jiang, J. H.: Evaluating clouds, aerosols, and their interactions in three global climate models using satellite simulators and observations, J. Geophys. Res.-Atmos., 119, 10876–10901, doi:10.1002/2014JD021722, 2014.
Bauer, S. E. and Menon, S.: Aerosol direct, indirect, semidi-rect, and surface albedo effects from sector contributions based on the IPCC AR5 emissions for preindustrial and present-day conditions, J. Geophys. Res.-Atmos., 117, 1–15, doi:10.1029/2011JD016816, 2012.
Bauer, S. E., Menon, S., Koch, D., Bond, T. C., and Tsigaridis, K.: A global modeling study on carbonaceous aerosol microphysi-cal characteristics and radiative effects, Atmos. Chem. Phys., 10, 7439–7456, doi:10.5194/acp-10-7439-2010, 2010.
Bougiatioti, A., Nenes, A., Fountoukis, C., Kalivitis, N., Pandis, S. N., and Mihalopoulos, N.: Size-resolved CCN distributions and activation kinetics of aged continental and marine aerosol, Atmos. Chem. Phys., 11, 8791–8808, doi:10.5194/acp-11-8791-2011, 2011.
Brito, J., Rizzo, L. V., Morgan, W. T., Coe, H., Johnson, B., Hay-wood, J., Longo, K., Freitas, S., Andreae, M. O., and Artaxo, P.: Ground-based aerosol characterization during the South Amer-ican Biomass Burning Analysis (SAMBBA) field experiment, Atmos. Chem. Phys., 14, 12069–12083, doi:10.5194/acp-14-12069-2014, 2014.
Camponogara, G., Silva Dias, M. A. F., and Carrió, G. G.: Rela-tionship between Amazon biomass burning aerosols and rainfall over the La Plata Basin, Atmos. Chem. Phys., 14, 4397–4407, doi:10.5194/acp-14-4397-2014, 2014.
Carrico, C. M., Petters, M. D., Kreidenweis, S. M., Sullivan, A. P., McMeeking, G. R., Levin, E. J. T., Engling, G., Malm, W. C., and Collett Jr., J. L.: Water uptake and chemical composition of fresh aerosols generated in open burning of biomass, Atmos. Chem. Phys., 10, 5165–5178, doi:10.5194/acp-10-5165-2010, 2010. Christensen, S. I. and Petters, M. D.: The role of temperature in
cloud droplet activation, J. Phys. Chem. A, 116, 9706–9717, doi:10.1021/jp3064454, 2012.
Chuang, P. Y.: Sensitivity of cloud condensation nuclei activation processes to kinetic parameters, J. Geophys. Res., 111, 1–7, doi:10.1029/2005JD006529, 2006.
Crutzen, P. J. and Andreae, M. O.: Biomass burning in the tropics: impact on atmospheric chemistry and biogeochemical cycles, Science, 250, 1669–78, doi:10.1126/science.250.4988.1669, 1990.
Cubison, M. J., Ervens, B., Feingold, G., Docherty, K. S., Ulbrich, I. M., Shields, L., Prather, K., Hering, S., and Jimenez, J. L.: The influence of chemical composition and mixing state of Los Angeles urban aerosol on CCN number and cloud properties, At-mos. Chem. Phys., 8, 5649–5667, doi:10.5194/acp-8-5649-2008, 2008.
Dusek, U., Frank, G. P., Hildebrandt, L., Curtius, J., Schneider, J., Walter, S., Chand, D., Drewnick, F., Hings, S., Jung, D., Bor-rmann, S., and Andreae, M. O.: Size matters more than chem-istry for cloud-nucleating ability of aerosol particles, Science, 312, 1375–8, doi:10.1126/science.1125261, 2006.
Dusek, U., Frank, G. P., Massling, A., Zeromskiene, K., Iinuma, Y., Schmid, O., Helas, G., Hennig, T., Wiedensohler, A., and An-dreae, M. O.: Water uptake by biomass burning aerosol at sub-and supersaturated conditions: closure studies sub-and implications for the role of organics, Atmos. Chem. Phys., 11, 9519–9532, doi:10.5194/acp-11-9519-2011, 2011.
monoter-pene secondary organic aerosol, Atmos. Chem. Phys., 8, 3937– 3949, doi:10.5194/acp-8-3937-2008, 2008.
Engelhart, G. J., Hennigan, C. J., Miracolo, M. A., Robinson, A. L., and Pandis, S. N.: Cloud condensation nuclei activity of fresh primary and aged biomass burning aerosol, Atmos. Chem. Phys., 12, 7285–7293, doi:10.5194/acp-12-7285-2012, 2012.
Ervens, B., Cubison, M. J., Andrews, E., Feingold, G., Ogren, J. A., Jimenez, J. L., Quinn, P. K., Bates, T. S., Wang, J., Zhang, Q., Coe, H., Flynn, M., and Allan, J. D.: CCN predictions using simplified assumptions of organic aerosol composition and mix-ing state: a synthesis from six different locations, Atmos. Chem. Phys., 10, 4795–4807, doi:10.5194/acp-10-4795-2010, 2010. Farmer, D. K., Cappa, C. D., and Kreidenweis, S. M.:
Atmo-spheric Processes and Their Controlling Influence on Cloud Condensation Nuclei Activity, Chem. Rev., 115, 4199–4217, doi:10.1021/cr5006292, 2015.
Feingold, G.: Modeling of the first indirect effect: Analysis of measurement requirements, Geophys, Res, Lett„ 30, 1–4, doi:10.1029/2003GL017967, 2003.
Fors, E. O., Rissler, J., Massling, A., Svenningsson, B., Andreae, M. O., Dusek, U., Frank, G. P., Hoffer, A., Bilde, M., Kiss, G., Janitsek, S., Henning, S., Facchini, M. C., Decesari, S., and Swietlicki, E.: Hygroscopic properties of Amazonian biomass burning and European background HULIS and investigation of their effects on surface tension with two models linking H-TDMA to CCNC data, Atmos. Chem. Phys., 10, 5625–5639, doi:10.5194/acp-10-5625-2010, 2010.
Freitas, S. R., Longo, K. M., Silva Dias, M. A. F., Silva Dias, P. L., Chatfield, R., Prins, E., Artaxo, P., Grell, G. A., and Re-cuero, F. S.: Monitoring the transport of biomass burning emis-sions in South America, Environ. Fluid Mech., 5, 135–167, doi:10.1007/s10652-005-0243-7, 2005.
Fromm, M. D. and Servranckx, R.: Transport of forest fire smoke above the tropopause by supercell convection, Geophys. Res. Lett., 30, 1–4, doi:10.1029/2002GL016820, 2003.
Ghan, S. J., Abdul-Razzak, H., Nenes, A., Ming, Y., Liu, X., Ovchinnikov, M., Shipway, B., Meskhidze, N., Xu, J., and Shi, X.: Droplet nucleation: Physically-based parameterizations and comparative evaluation, J. Adv. Model. Earth Sys., 3, 1–33, doi:10.1029/2011MS000074, 2011.
Giordano, M. R., Short, D. Z., Hosseini, S., Lichtenmerg, W., and Asa-Awuku, A. A.: Changes in droplet surface tension affect the observed hygroscopicity of photochemically aged biomass burning aerosol, Environ. Sci. Technol., 47, 10980– 10986, doi:10.1021/es404971u, 2013.
Granier, C., Bessagnet, B., Bond, T., D’Angiola, A., Denier van der Gon, H., Frost, G. J., Heil, A., Kaiser, J. W., Kinne, S., Klimont, Z., Kloster, S., Lamarque, J.-F., Liousse, C., Masui, T., Meleux, F., Mieville, A., Ohara, T., Raut, J.-C., Riahi, K., Schultz, M. G., Smith, S. J., Thompson, A., Aardenne, J., Werf, G. R., and Vuuren, D. P.: Evolution of anthropogenic and biomass burn-ing emissions of air pollutants at global and regional scales during the 1980–2010 period, Clim. Change, 109, 163–190, doi:10.1007/s10584-011-0154-1, 2011.
Gunthe, S. S., King, S. M., Rose, D., Chen, Q., Roldin, P., Farmer, D. K., Jimenez, J. L., Artaxo, P., Andreae, M. O., Martin, S. T., and Pöschl, U.: Cloud condensation nuclei in pristine tropi-cal rainforest air of Amazonia: size-resolved measurements and modeling of atmospheric aerosol composition and CCN activity,
Atmos. Chem. Phys., 9, 7551–7575, doi:10.5194/acp-9-7551-2009, 2009.
He, J., Zhang, Y., Glotfelty, T., He, R., Bennartz, R., Rausch, J., and Sartelet, K.: Decadal simulation and comprehensive evalu-ation of CESM/CAM5.1 with advanced chemistry, aerosol mi-crophysics, and aerosol-cloud interactions, J. Adv. Model. Earth Sys., 7, 110–141, doi:10.1002/2014MS000360, 2015.
Hindmarsh, A. C.: The PVODE and IDA algorithms, Tech. Rep. UCRL-ID-141558, Lawrence Livermore National Laboratory, 2000.
Hindmarsh, A. C. and Taylor, A. G.: User Documentatin of IDA, a differential-algebraic equation solver for sequential and parallel computers, Tech. rep., Lawrence Livermore National Laboratory Report UCRL-MA-136910, 1999.
Hsiao, T.-C., Ye, W.-C., Wang, S.-H., Tsay, S.-C., Chen, W.-N., Lin, N.-H., Lee, C.-T., Hung, H.-M., Chuang, M.-T., and Chan-tara, S.: Investigation of the CCN Activity, BC and UVBC Mass Concentrations of Biomass Burning Aerosols during the 2013 BASELInE Campaign, Aerosol Air Qual. Res., 16, 2742–2756, doi:10.4209/aaqr.2015.07.0447, 2016.
Hudson, J. G.: Variability of the relationship between particle size and cloud-nucleating ability, Geophys. Res. Lett., 34, 1–5, doi:10.1029/2006GL028850, 2007.
IPCC: Climate Change 2013: The Physical Science Basis, Contri-bution of Working Group I to the Fifth Assessment Report of the Intergovernmental Panel on Climate Change, Cambridge Univer-sity Press, Cambridge, UK, New York, NY, USA, 2013. Jacobson, M.: The short-term cooling but long-term global warming
due to biomass burning, J. Climate, 17, 2909–2926, 2004. Jacobson, M. Z.: Fundamentals of atmospheric modeling, 2nd Edn.,
Cambridge University Press, Cambridge, Massachussets, 2005. Kandler, K. and Schütz, L.: Climatology of the average
water-soluble volume fraction of atmospheric aerosol, Atmos. Res., 83, 77–92, doi:10.1016/j.atmosres.2006.03.004, 2007.
Köhler, H.: The nucleus in and the growth of hygroscopic droplets, T. Faraday Soc., 32, 1152–1161, 1936.
Lamarque, J.-F., Bond, T. C., Eyring, V., Granier, C., Heil, A., Klimont, Z., Lee, D., Liousse, C., Mieville, A., Owen, B., Schultz, M. G., Shindell, D., Smith, S. J., Stehfest, E., Van Aar-denne, J., Cooper, O. R., Kainuma, M., Mahowald, N., Mc-Connell, J. R., Naik, V., Riahi, K., and van Vuuren, D. P.: His-torical (1850–2000) gridded anthropogenic and biomass burning emissions of reactive gases and aerosols: methodology and ap-plication, Atmos. Chem. Phys., 10, 7017–7039, doi:10.5194/acp-10-7017-2010, 2010.
Langmann, B., Duncan, B., Textor, C., Trentmann, J., and Van-derwerf, G.: Vegetation fire emissions and their impact on air pollution and climate, Atmos. Environ., 43, 107–116, doi:10.1016/j.atmosenv.2008.09.047, 2009.
Lathem, T. L., Beyersdorf, A. J., Thornhill, K. L., Winstead, E. L., Cubison, M. J., Hecobian, A., Jimenez, J. L., Weber, R. J., An-derson, B. E., and Nenes, A.: Analysis of CCN activity of Arc-tic aerosol and Canadian biomass burning during summer 2008, Atmos. Chem. Phys., 13, 2735–2756, doi:10.5194/acp-13-2735-2013, 2013.