Nat. Hazards Earth Syst. Sci., 12, 1551–1559, 2012 www.nat-hazards-earth-syst-sci.net/12/1551/2012/ doi:10.5194/nhess-12-1551-2012
© Author(s) 2012. CC Attribution 3.0 License.
Natural Hazards
and Earth
System Sciences
Space conditions during a month of a sequence of six
M
>
6.8
earthquakes ending with the tsunami of 26 December 2004
G. Anagnostopoulos and A. Papandreou
Demokritos University of Thrace, Space Research Laboratory, 67100 Xanthi, Greece
Correspondence to:G. Anagnostopoulos ([email protected])
Received: 16 November 2010 – Revised: 30 June 2011 – Accepted: 11 July 2011 – Published: 21 May 2012
Abstract. This paper examines space and seismological
data for the time period about one month before the giant Sumatra-Andaman strong (9.3) earthquake (EQ). The com-bination of seismological and space data reveals some inter-esting features for this time period: (1) six successive high speed solar wind streams obviously triggering a sudden in-crease of geomagnetic activity were all followed by strong to giant (M >6.8) EQs, (2) the 6 strong EQs present cer-tain spatial-temporal constraints, with the epicentre of the EQs occuring at the edges of the Pacific Plate (the Sumatra-Andaman EQ occurred at the end of this series of EQs, east-ward of the first one), in a clockwise direction, (3) the EQs occurred after a sudden increase of geomagnetic activity, as inferred from the 3 h-Kp index, following a quiet
geomag-netic period and (4) the time delay of the M >6.2 earth-quakes (in the broad area examined) from the last maximum suddenKp increase was on average∼1.5 days. These
find-ings from the study of the Earth’s space environment during the month preceding the Sumatra-Andaman giant (9.3) EQ provide new information for a possible better understanding of the Sun-magnetosphere-lithosphere coupling.
1 Introduction
The presence of the Sun controls the planet Earth and the life on it to a highest degree. In particular, scientific progress during the space era has greatly improved our knowledge of the Sun and its emissions, and of the solar influence on the 3-D interplanetary space and the planetary magnetospheres. Therefore, several studies in the last years have been devoted to the investigation of the relations between solar activity and changes in the status of the magnetosphere-ionosphere- tech-nological systems (Baker, 2005; Marhavilas, 2008; Lanze-rotti, 2010), seismic activity (Sobolev et al., 2001; Gousheva et al., 2003), and human life and health (Halberg et al., 2000; Lowell and Davis, 2008).
In addition, over the last two decades, many researchers have been greatly interested in developing scientific tools for advancing space weather and EQ prediction (Hayakawa and Molchanov, 2002; Baker, 2005; Molchanov and Hayakawa, 2008; Pulinets and Boyarchuk, 2004). Space weather pre-diction research has been accepted as the main priority in space physics and there exists a general consensus on the possibility of some prediction (Li et al., 2001), whereas EQ prediction research, despite the increasing evidence for the existence of EQ precursory signals, is still a controversial is-sue.
In the following in this section, we review some of the studies dealing with the possible influence of the Sun on seismic activity. For instance, Khain and Khalilov (2008) presented statistical results which suggest that the spectra of
M >=7 EQs and of Wolf numbers of sunspots display the
same main harmonic, atT≈10–11 yr, that is about the solar cycle period. Gousheva et al. (2003) in their statistical study found two maxima in the global yearly number of EQs in the 11-yr sunspot cycle: one maximum coinciding with the solar sunspot cycle maximum (correlated with the strong so-lar activity) and another maximum observed on the descend-ing phase of the solar cycle (correlated with the solar wind streams incident on the magnetosphere in such a period).
applied parametric and non-parametric criteria and inferred that the storm effect on seismicity was non-accidental, with a probability of 99.9 %. They also came to the conclusion that the seismic response to a magnetic storm lasts for 10 days, with a maximum effect between 2 to 7 days after sudden commencement.
Bakhmutov et al. (2007) presented an example of cor-relation between geomagnetic field disturbances and earth-quakes on a specific seismic zone in Vrancea, in the South Carpathians. They studied more than 200 EQs during the period 1988–1996, and they found that 90 % of seismic shocks recorded in the Vrancea zone were associated with mid-latitude manifestation of the near midnight polar sub-storms. These substorms manifested themselves both against the quiet geomagnetic field background and during magnetic storms. The authors noted that “When there are no substorms we have no records of deep-foci EQs in Vrancea at all”. They also reported that definite morphological signs in the geo-magnetic variation spectrum precede seismic activity. Their statistical results also suggest that the energy class of the EQ is related to the amplitude of the H-component changes (dur-ing near-midnight polar substorm manifestation).
Odinstov et al. (2007) examined the solar wind speed in-crease, a particular cause of (sub)storms, and checked its possible impact on seismic activity. Their statistics showed that the maximum of the EQ number directly correlates with a sudden increase in the solar wind speed. Furthermore, a more specific study of solar activity influence on seismic ac-tivity has been conducted by Gousheva et al. (2003), who also found a relation between the solar wind speed hitting the Earth’s magnetosphere and seismic activity. Gousheva et al. (2003) noted that although many authors have studied the role of extraterrestrial factors in terrestrial seismicity, the problem remains controversial. There exists increasing evi-dence for the influence of solar activity upon seismic activity, but we know that there are geomagnetic (sub)storms which are not accompanied by seismic activity, and EQs which are not related to (sub)storms. Despite the statistical evidence provided for the influence of the solar wind streams on seis-mic activity, the issue still remains controversial in the scien-tific community.
In this paper we examine the seismic activity compared with the space environment status for the time period of about one month before the deadly tsunami of 26 Decem-ber 2004. Our analysis reveals some interesting relation-ships between the space variations and seismic activity dur-ing the time period examined: (1) all 6 of 6 successive so-lar wind speed increases were followed by one (or more)
M >6.8 EQs, after ∼1.5 days. (2) The series of
succes-sive strong EQs during the period examined present a spa-tial and temporal relation, with the epicentre of all strong EQs before the Sumatra EQ being located at the edges of the Pacific Plate, and the EQs occuring in a clockwise direction around the Pacific Plate (the Sumatra-Andaman EQ occurred at the end of this series of EQs, eastward of the first one). We
Table 1. Place, date/time, magnitude, Longitude, Latitude of
M >6.8 earthquakes for the time period starting one month before the giant Sumatra-Andaman earthquake until the end of the year 2004, as given in the list of “Significant Earthquakes” of the US Geophysical Survey site.
No Date Time (UT) Magn. Long. Lat.
1 26 Nov 02:25:03 7.1 135.346◦E 3.6◦S 2 28 Nov 18:32:13 7.0 145.056◦E 43.0◦N 3 6 Dec 14:15:11 6.8 145.200◦E 42.9◦N 4 14 Dec 23:20:13 6.8 81.348◦W 19.0◦N 5 23 Dec 14:59:03 8.1 160.365◦E 50.1◦S 6 26 Dec 00:58:53 9.3 95.854◦E 3.3◦N
hypothesize that these special temporal-spatial constraints of EQs most probably reflect an underlying geological process that provided the appropriate conditions for the sudden geo-magnetic activity to act as a triggering cause provoking the 6 great to giant successive EQs between 26 November–26 De-cember 2004.
2 Observations
The terrible tsunami following the Sumatra-Andaman EQ on 26 December 2004 has been studied from many points of view. Here we study the history of seismic activity dur-ing the month preceddur-ing the giant EQ takdur-ing into account the conditions of the space environment. In our study, we use and compare values of the geomagneticKp index and
the solar wind speed V retrieved from the NOAA Space Weather Prediction Center (http://www.swpc.noaa.gov/) and the USGS EQ lists (http://earthquake.usgs.gov). The relevant time period from 23 November 2004 to 31 December 2004 is examined. We have plotted these data in composite figures in an attempt to search for any qualitative correlations between parameters of space weather, geomagnetic status and earth-quakes. In addition, we present some quantitative results in order to provide a preliminary quantification of these corre-lations.
Fig. 1. Map with the position of the epicentre of the 6 great (M=6.8) earthquakes in the month preceding the Sumatra 2004 earthquake. The earthquakes were located at the edge of Pacific Plate.
Cayman Islands, on 24 December, (M=6.8), (#5) North of Macquarie Islands, on 6 December, (M=8.1) and (#6) Off the west coast of northern Sumatra, on 26 December (M=9.3); in the following, each one of the 6 EQs earth-quakes will be called by its number in the above list; for in-stance the EQ occurring in Papua Islands will be called EQ #1, whereas that in Sumatra will be called EQ #6. Figure 1 displays a map with the position of the epicentres of the 6 EQs.
From a comparison of the data given in Table 1 and Fig. 1, some spatial and temporal constraints are evident:
1. the epicentres of all six EQs (are not dispersed, but all of them) are located in a certain region of the globe, 2. the epicentres of the first five EQs are located at the
edges of the Pacific Plate, with the epicentre of the EQ #6 (Sumatra), the last one in this sequence of the six EQs, lying “close” to the Pacific Plate, eastward of the first one (EQ #1),
3. all five EQs, # 1-2-3-4-5, were occurred in a clock-wise direction around the Pacific Plate, with the EQ #6 (Sumatra-Andaman EQ) occurring after and close to the EQ #5 occurring in the southwest edge of this Plate, 4. the two greatest EQs in the sequence of the six
>6.8 EQs occurred at the end: EQ #5 (M=8.1) oc-curred relatively close and only before∼3 days from EQ # 6 (Sumatra-Andaman,M=9.3).
The spatial-temporal ordering of the six greatest EQs which occurred within a month in a unique geological structure of the world most probably suggests that certain common un-derlying geological processes were in progress during the month preceding the Sumatra-Andaman EQ; this special derlying geological process might be responsible for the un-expected strength of this EQ (Stein and Okal, 2007).
Table 2. The six earthquakes of Fig. 1: magnitude, date of
occur-rence, the days of the monotonicKp increase before each of the
6 earthquakes, the values of the increasingKpindex before each
earthquake, the corresponding index increase over its value of the previous day1Kp/1t(#/day), and the total increase61Kpduring
the period (days) ofKpindex monotonic increase.
No Magnitude Date Date Kp 1Kp/1t 61Kp
(EQ) (#/day)
1 7.1 26 Nov
25 Nov 27 10 15
24 Nov 17 5
23 Nov 12
2 7.0 28 Nov 28 Nov 22 3 3
27 Nov 19
3 6.8 6 Dec 6 Dec 28 13 28
5 Dec 15 15
4 Dec 0
4 6.8 14 Dec 12
12 Dec 31 10 12
11 Dec 21 2
10 Dec 19
5 8.1 23 Dec 21
22 Dec 26 6
21 Dec 20 12
20 Dec 8 3
19 Dec 5
6 9.3 26 Dec 16
25 Dec 22 16
24 Dec 6
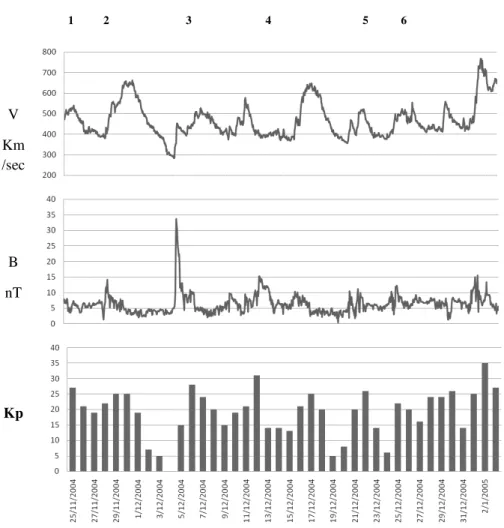
In Fig. 2 we display the magnitude of the six EQs indi-cated by normal bars at the particular time of EQ occurrence (top panel), along with the daily numbers of the geomag-netic activity indexKp(middle panel) and the daily variation
of the same index1Kp (bottom panel); the six significant
(>6.8) EQs (Table 1) are numbered as #1–6 above the panel. From Fig. 2 we can clearly see that 5 of 6 EQs, namely EQs # 1, 3, 4, 5, and 6, occurred after days of enhanced geomag-netic activity as suggested by both the monotonic increasing values ofKp (Panel b) and the high positive values of the
daily rate1Kp(Panel c).
In Fig. 3 we extend our investigation to the space environ-ment outside the magnetosphere: we introduce the concept of the plasma emitting from the Sun which is known as “so-lar wind”. The so“so-lar wind moves away from the Sun with an average speed of 350 km s−1, extends up to the Termination Shock of the heliosphere and influences the Earth’s magne-tosphere (as well as the other planetary magnemagne-tospheres). In particular, in Fig. 3 we show the geomagnetic indexKp(top
panel), along with the magnitude of the interplanetary mag-netic field (IMF)B(middle panel) and the value of the solar wind speedV (bottom panel); the measurements ofB and
1 2 3 4 5 6
M
Kp
ΔKp
1
Fig. 2. The figure displays the magnitude of the six earthquakes (the top panel) along with the daily numbers of the geomagnetic activity
indexKp(middle panel) and the daily variation the same index1Kp(bottom panel); the six significant (>6.8) earthquakes shown in Table 1
are numbered as #1–6 above the panel.
5 and 6, not only with theKp increases as already seen in
Fig. 2, but also with increases in magnetic fieldBand solar wind speedV. These times of simultaneous magnetic field
Band solar wind speedV increases indicate the times when the leading edge of the high speed solar wind streams arrived in the environment of the magnetosphere. The coincidence of the arrival of these solar wind streams withKpincreases
is a well known process in space physics, where solar wind streams incident on the Earth’s magnetosphere can trigger enhanced geomagnetic activity.
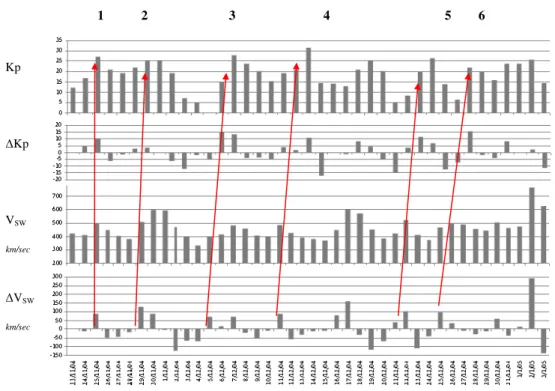
In Fig. 4 we further examine the relation of the solar wind speed increases with the enhanced geomagnetic activity. In this figure we compare the daily values of the geomagnetic indexKp(top panel) and the daily average solar wind speed
V (third panel from the top), along with the corresponding daily rates of variations1Kp (second panel from the top)
and1V (bottom panel). The normal arrows in the figure were drawn to indicate the enhanced geomagnetic activity following the solar wind speed increases for all 6 significant earthquakes (#1–6).
In Table 2 we elaborate the level of geomagnetic activ-ity and its change preceding the 6 EQs (Figs. 1, 2). The columns of the table (left to the right) show the number-ing of EQs (#1–6), their magnitude, the date of their occur-rence, the days of the monotonicKpincrease preceding each
EQ, the values of the increasing Kp index in those days,
the corresponding index increase over its value of the pre-vious day1Kp (#/day), and the total increase61Kp
dur-ing the period (days) of monotonic increase of theKpindex.
(The behavior of the geomagneticKpindex shown in the last
columns of Table 2 reflects, in numbers, theKpbar profile
of Figs. 2, 4).
Important to note from Table 2 are the following:
1. in 4 of 6 cases (EQ #1, 4, 5 and 6), the EQs occurred after the day of maximumKpvalue,
2. the two strongest EQs are characterized by preceding days of very low geomagnetic activity (Min-Kp=5
be-fore EQ #5 and Min-Kp=6 before EQ #6; compared to
Kp=12, 19 and 19 before EQs #1, 2, and 4),
3. the same EQs are also characterized by high maximum daily increase (Max-1Kp=12 before EQ #5 and
Max-1Kp=16 before EQ #6; compared to1Kp=10, 3 and
10 before EQs #1, 2, and 4),
4. EQ #3 which presented extreme Min-Kp(=0) and
Max-1Kp(=15) does not correspond to the strongest
1 2 3 4 5 6
V
Km /sec
B
nT
Kp
Fig. 3.The geomagnetic indexKp(top panel) along with the magnitude of the interplanetary magnetic field (IMF)B(middle panel) and the
value of the solar wind speedV (bottom panel); the time profiles ofKp,BandV suggest a correlation of Earthquakes #2, 3, 4, 5 and 6, not
only with theKpincreases but also with increases in magnetic fieldBand solar wind speedV.
occurred on the same day as EQ #2 with an epicenter at almost the same place (Hokkaido, Japan), and
5. the EQs # 6, 5 and 3 show a similar behavior for the total
61Kp(last column) as that seen for the daily Min-Kp
and Max-1Kp/1t values (Points #2–4).
The above characteristics extracted from Table 2 for the month before the Sumatra EQ have been found to exist in several other cases, and we have been working on statistics to estimate the appearance of such characteristics. Here we should recall that the six EQs examined follow a certain pat-tern concerning their correlation withV,Kp, Min-Kp,
Max-1Kp and61Kp and that this is most probably due to the
common spatial-temporal constraints during the period ex-amined.
In order to study the time relationship between the geo-magnetic increase activity and the EQ occurrence time for the 6 cases examined here in more detail, we display the magnitude of the great EQs at the certain time of occur-rence (top panel) in Fig. 5, along with the numbers of the 3-h geomagnetic activity indexKp(bottom panel). Since in
Fig. 2, a distinct solar wind stream with gradually increasing speed on days 16 and 17 November 2004 was accompanied by enhanced geomagnetic activity and was followed by an EQ withM=6.2 on day 18 November 2004 not included in the USGS list of significant EQs, we wanted to include it in Fig. 5 and study the possible relations of all EQs in the exam-ined region with magnitudesM >=6.2 with space physics parameters. The results coming from Fig. 5 and tabulated in Table 3 are surprising. First, from Fig. 5 we can observe that each of the EQs marked now as #1, 2-, 2, 3, 4, *, 5, 6 are preceded by enhanced (1Kp≥2) values of the 3-hKp
index (indicated by arrows in the bottom panel). Second, an evaluation of the time difference1t=TEQ–TM between the
EQ occurrence time and the time of the last maximum Kp
value before the corresponding EQ suggests that1t varies in a small range of time, between 30–42 h. The average value of the time difference 1t=TEQ–TM is estimated to
be1t=34.9≈35 h, that is about 1.5 days after the sudden increase of the geomagnetic activity.
1 2 3 4 5 6
Kp
ΔKp
VSW
km/sec
ΔVSW
km/sec
Fig. 4. Daily values of the geomagnetic indexKp(top panel) and the daily average solar wind speedV (third panel from the top) along
with the corresponding daily rates of variations1Kp (middle panel) and1V(bottom panel). The normal arrows indicate the enhanced
geomagnetic activity following solar wind speed increases for all 6 significant earthquakes (#1–6).
1 2- 2 3 4 * 5 6
M
ΔΚp
10 9 8 7 6 5 4 3 2 1
4 3 2 1 0 -1 -2 -3
Fig. 5. The magnitude of the great (M >6.2) earthquakes (top panel) along with the numbers of the geomagnetic activity 3-hKp index
are presented (bottom panel). The time difference between earthquake occurrence and the time of the last maximumKp value before the
Table 3. Time difference1t=TEQ–TM between the earthquake
occurrence time and the time of the last maximumKp value
be-fore the corresponding EQ. The average value of the time difference 1t=TEQ–TMis evaluated to be1t≈35 h, that is about one and a
half days after the sudden increase ofKpindex.
No Date Magnitude TEQ–TM(h)
1 26 Nov 2004 7.1 36
2- 28 Nov 2004 6.6 33
2 28 Nov 2004 7.0 30
3 6 Dec 2004 6.8 33
4 14 Dec 2004 6.8 33
* 18 Dec 2004 6.2 36
5 23 Dec 2004 8.1 42
6 26 Dec 2004 9.3 36
Mean 34.9
occurrence time and the time of the last maximumKpvalue
before the corresponding EQ during the month of a sequence of 8 earthquakes ending with the tsunami of 26 Decem-ber 2004, we perform two statistical tests. First, we per-form the Sign Test. We test the hypothesis that “35 h is the median of the eight1T values of Table 3”. For this rea-son we compare each of the eight value1T with the “me-dian”< 1T >=35 and we note the sign of the difference
1T–< 1T >. The comparison gives the following series
of signs: +, –, –, –, –, +, +, +, where “–” corresponds to values1T < < 1T > and “+” to1T > < 1T >. The smaller value of + and – signs is 4; this number is higher than the critical number provided by the appropriate Table for the Sign Test (Dixon and Mood, 1946) for a total number of 8 signs, at a significant level ofP =0.01 for a two-tailed test. Therefore, according to the Sign Test the null hypothesis is not rejected.
For further testing the statistical significance of the cor-relation between the EQ occurrence timeTEQ and the time
TM of the last maximumKpvalue before the corresponding
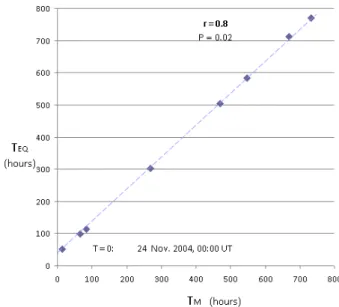
EQ, we evaluate the correlation coefficient for the 8 pairs of timesTEQandTMof Table 3. In Fig. 6 we plot the timesTEQ versusTM. Since our statistical sample is not normally
dis-tributed, we evaluate the nonparametric Spearman rank cor-relation coefficientrs. We test the null hypothesis that “there is a significant linear correlation between the valuesTEQand
TM of Table 3” The Spearman rank correlation coefficient is
found to bers=0.797≈0.8 and by using the appropriate Ta-ble (Johnson and Leone, 1964) we see that rs is lower than the critical value 0.833 forP=0.02, that means a Spearman rank correlation coefficientrs≈0.8 statistically significant at the level ofP =0.02 (coincidence chance 2 %). A line in Fig. 6 has been drawn that indicates the linear correlation be-tween the valuesTEQandTM; the horizontal distance from
the diagonal corresponds to the median time delay of the time of the EQ (TEQ)from the time of the last sudden increase in geomagnetic indexKpbefore the corresponding EQ (TM).
Fig. 6.The time of the earthquake occurrenceTEQversus the time
of the last maximumKp valueTM before the corresponding EQ
(see in the text). A strong correlation (r=0.8) was found between the eight pairs of the valuesTEQandTMconsidered.
3 Discussion
The Sun-earth relationship is a central point in many re-search directions nowadays and some Sun-Earth relation-ships have already been confirmed and have been incor-porated into the corps of several scientific areas. In par-ticular, the space science community has concentrated its interest on so-called “space weather” in order to predict ge-omagnetic and ionospheric disturbances, which have a sig-nificant impact on electrical power systems, telecommunica-tions, oil pipelines, spacecraft and aircraft electronics, astro-nauts safety, etc. (Baker, 2005; Marhavilas, 2008; Lanzerotti, 2010). Scientific research has also provided some evidence on the relation of solar-magnetospheric activity with EQs.
However, the Sun-interplanetary space-magnetosphere-ionosphere-atmosphere-lithosphere chain is a complicated, open, dynamic, nonlinear system of a complex of processes, with high unpredictability. In this context, the seismic phe-nomena of the Earth should be considered as a part of the whole Sun-Earth system. The relation between seismicity and the Sun-Earth chain processes has been considered as ambiguous, and for this reason the contribution of various solar impact processes on Earth’s lithosphere and their asso-ciation with the seismic energy release needs much work.
before 6 strong EQs: the most striking feature is that all 6 successive strong (M >6.8) earthquakes were preceded by enhanced geomagnetic activity (Fig. 2) within ∼1.5 days (Table 3). The existence of such a permanent feature and in a sequence of 6 EQs, most probably suggests that some special geological conditions (Stein and Okal, 2007) dur-ing the period examined allowed such an orderdur-ing. Indeed, the seismological data support such a hypothesis since we observed that the series of successive EQs present a spatial and temporal ordering (Fig. 1 and relative discussion in the text/Sect. 2). This special temporal-spatial earthquake or-dering most probably reflects a common underlying geolog-ical process, in metastable state, which provided the condi-tions for the high speed solar wind streams/rapidly increasing geomagnetic activity to act in some way as the EQ triggering cause.
Besides the above-discussed evidence for the solar wind high speed streams/geomagnetic activity-related seismic ac-tivity relationship in the time period examined, our data anal-ysis provides significant information which is probably re-lated to the nature of the triggering mechanism. Our analysis suggests that the strong EQs occurred at times of sudden in-crease geomagnetic activity following a geomagnetic quiet period. The high valueKpindex time rate variation suggests
a sudden geomagnetic disturbance, and therefore, intense in-duced electric phenomena close to Earth.
Sobolev et al. (2001) and Zakrzhevskaya and Sobolev (2001) have already argued that if the crust in the area of a forthcoming EQ is in metastable state, it becomes sensitive to trigger-like effects. They speculated that the electrical energy supplied to the earth during a storm is converted into mechanical energy via piezoelectric, electrokinetic or other mechanoelectric effects and increases mechanical stresses. They noted that a comparison of the energy supplied by magnetic storms and that released by EQs suggests that a magnetic storm can only act as a triggering mechanism, not as the main cause of the seismic activity. In addition, Duma and Ruzhin (2003) demonstrated a probabilistic relation of ionospheric Sq currents with seismic activity.
Some authors suggested other extraterrestrial processes as triggering mechanisms of seismic activity: solar and lunar tides (Jakubkova and Pick, 1987), solar proton fluxes (Veli-nov, 1975), and earthward movement of the magnetopause (Makarova and Shirochkov, 1999).
Kormiltsev et al. (2002) hypothesized that magnetic storms induce electro-osmotic fluid flows which causes EQ triggering due to the influence of anomalous porous pressure. Sytinskii (1997) argued that the EQ triggering mecha-nism is the solar- induced change in atmospheric circulation expressed in the large scale reorganization of|baric fields, while Prikryl et al. (2003) provided evidence that gravity waves are generated by auroral electrojets caused by high speed solar wind MHD waves.
Tarasov et al. (1999) reported a probable triggering effect of impulsive electrical signals on seismicity based on a study of the number of EQs in Kyrgyzstan associated with elec-trical signals radiated by an MHD generator. They inferred that the number of EQs tends to increase 3–4 days after the electrical signal passage at distances of the order of a few hundred kilometres. Based on these results, Doda (2001) proposed that we can regard the electric currents induced in the Earth’s crust by magnetic disturbances as the same result of the MHD generator impact.
4 Conclusions
This paper examines space and seismological data for the time period about one month before the giant Sumatra-Andaman giant (9.3) EQ followed by the tsunami that caused the death of hundreds of thousands people in a large part of our planet. The combination of seismological and space data reveals three striking results for this time period:
1. a series of successive six high speed solar wind streams/sudden increase of geomagnetic activity were all followed by strong to giant (6.8< M <9.3) earth-quakes within∼1.5 days after the incidence of the solar wind streams on the Earth’s magnetosphere,
2. the series of successive strong EQs presents a spatial and temporal relation, with the epicentre of the EQs oc-curing in a clockwise direction at the edges of the Pa-cific Plate (the Sumatra-Andaman EQ occurred at the end of this series of EQs, eastward of the first one), and 3. the EQs occurred after a rapidly disturbed
magneto-sphere following a quiet geomagnetic period.
In conclusion, we infer that before the Sumatra-Andaman EQ, some special geological conditions in the Pacific Plate probably prepared the appropriate conditions for provoking very strong EQs within∼1.5 days after a sudden disturbance of a quiet magnetosphere.
Acknowledgements. The leading author thanks P. Antoniou for the preparation of some of the figures used in this paper, and interesting discussions on this paper. He also thanks I. Veselovsky, A. Rigas and P. Preka for helpful discussions and their comments on the manuscript. We also thank the three referees of this paper for their constructive comments.
Edited by: M. E. Contadakis
Reviewed by: P. F. Biagi and two other anonymous referees
References
Baker, N. D.: Introduction to Space Weather, Lecture Notes in Physics, 656, 993–1020, doi:10.1007/978-3-540-31534-6 1, 2005.
Bakhmutov, V., Sedova, F., and Mozgovaya, T.: Morphological Features in the Structure of Geomagnetic Variations in Relation to Earthquakes in Vrancea, Publ. Inst. Geophys. Pol. Acad. Sc., 43, 931–937, doi:10.1134/S1069351307110031, 2007.
Doda, L.: Geoseismic echo of solar storms, Air fleet, 3, 56–57, 2001.
Dixon, J. W. and Mood, A. M.: The Statistical Sign Test, J. Amer. Statist. Ass., 41, 557–566, 1946.
Duma, G. and Ruzhin, Y.: Diurnal changes of earthquake activity and geomagnetic Sq-variations, Nat. Hazards Earth Syst. Sci., 3, 171–177, doi:10.5194/nhess-3-171-2003, 2003.
Gousheva, M. N., Georgieva, K. Y., Kirov, B. B., and Atanasov, D.: On the Relation Between Solar Activity and Seismicity, RAST 2003, Proceed. International Conf. “Recent Advances in Space Technologies”, Istanbul, Turkey, edited by: Kurnaz, S., Ince, F., and Onbaioglu, S., IEEE Catalog Number 03EX743. ISBN: 0-7803-8142-4, Library of Congress Catalog Card Num-ber 2003109595, the Institute of Electrical and Electronics Engi-neers, Inc., 236 pp., 2003.
Halberg, F., Corn´elissen, G., Otsuka, K., et al.: Cross-spectrally co-herent∼10.5- and 21-yr biological and physical cycles, magnetic storms and myocardial infractions, Neuroendocrinolgy Letters, ISSN 172-780X, 21, 233–258, 2000.
Hayakawa, M. and Molchanov, O. A. Editors, Seismo Electromag-netics: Lithosphere–Atmosphere–Ionosphere Coupling, TER-RAPUB, Tokyo, 477 pp., 2002.
Jakubcova, J. and Pick, M.: Correlation between solar motion, earthquakes, and other geophysical phenomena, Ann. Geophys., 5, 135–141, 1987,
http://www.ann-geophys.net/5/135/1987/.
Khain, V. E. and Kalilov, E. N.: About the possible influence of so-lar activity upon seismic and volcanic activities: long-term fore-cast, Science without borders, Trans. f the International Academy of Science H&E., SWB, 2070-0334, 3, 217–240, 2008. Kormiltsev, V. V., Kostrov, N. P., Ratushnyak, A. N., and Shapiro, V.
A.: The influence of electro-osmotic pressure generated by geo-magnetic disturbances on the evolution of seismotectonic pro-cess, in: Electromagnetic Lithosphere-Atmosphere-Ionosphere Coupling, edited by: Nayakawa, M. and Molchanov, O. A., Ter-rapub, Tokyo, 203–207, 2002.
Lanzerotti, L. J.: Pipelines and Space Weather, Space Weather, 8, S05006, doi:10.1029/2010SW000594, 2010.
Li, X., Temerin, M., Baker, D. N., Reeves, G. D., and Larson, D.: Quantative prediction of radiation belt electrons at geostationary orbit based on solar wind measurements, Geophys. Res. Lett., 28, 1887–1890, doi:10.1029/2000GL012681, 2001.
Lowell, E. W. and Davis, G. E.: The light of life: Evidence that the sun modulates human lifespan, Med Hypotheses, 70, 501–507, doi:10.1016/j.mehy.2007.05.053, 2008.
Makarova, L. N. and Shirochkov, A. V.: On the connection be-tween the Earth’s magnetosphere magnetopause position and the earthquakes occurrence, Abstracts of XXVI General Assembly LJRSI, Toronto, Canada, 13–21, p. 755, 1999.
Marhavilas, P.: Space as natural laboratory of Electronics, J. Engin. Sci. and Tech. Review, 1, 9–18, 2008.
Mikhailova, N. N.: Catalog of earthquakes in the North Tien Shan and Adjacent Areas over the Period from 1975 through 1982: Parts 1 and 2, Alma-Ata: Nauka, 1990.
Molchanov, O. A. and Hayakawa, M.: Seismo Electromagnetics and Related Phenomena: History and latest results, TERRA-PUB, Tokyo, 189 pp., 2008.
Odintsov, S. D., Ivanov-Klodonyi, G. S., and Gergieva, K.: Solar activity and Global seismicity on Earth, Bull. Russ. Aca. Sci., Physics, 71(4), 593–597, 2007.
Prikryl, P., Muldrew, D. B., and Sofko, G. J.: High-speed solar wind, auroral electrojets and atmospheric gravity waves: a link to the Earth’s atmosphere, Proceedings International Solar Cy-cle Studies Symposium 2003 “Solar Variability as an Input to the Earth Environment”, Tatranska Lomnica, Slovakia, ESA SP, 23–28, 2003.
Pulinets, S. and Boyarchuk, K.: Ionospheric Precursors of earth-quakes, Springer, ISBN3-540-20839-9, 2004.
Sobolev, G. A., Zakrzhevskaya, N. A., and Kharin, E. P.: On the relation between seismicity and magnetic storms, Phys. Solid Earth, Russian Acad. Sc., 11, 62–72, 2001.
Stein, S. and Okal, E. A.: Ultralong period seismic study of the De-cember 2004 Indian Ocean earthquake and implications for re-gional tectonics and the subduction process, Bull. Seismol. Soc. Am., 97, S279–S295, doi:10.1785/0120050617, 2007.
Sytinskii, A. D.: Influence of interplanetary disturbances on the seismicity and atmosphere of the Earth, Geomagn. Aeron., 37, 138–143, 1997.
Tarasov, N. T., Tarasova, N. V., Avagimov, A. A., and Zeigarnik, V. A.: The effect of high-power electromagnetic pulses on the seismicity of the Central Asia and Kazakhstan, Volcan. Seismol., Russian Acad. Sc. 4/5, 152–160, 1999.
Velinov, P.: The effect of solar activity on geophysical processes, Bulg. Geofiz. Spis., 1, 51–77, 1975.