Submitted5 December 2015 Accepted 19 March 2016 Published7 April 2016
Corresponding author
Shaobin Gu, shaobingu@haust.edu.cn
Academic editor Sandhya Visweswariah
Additional Information and Declarations can be found on page 10
DOI10.7717/peerj.1920
Copyright 2016 Gu et al.
Distributed under
Creative Commons CC-BY 4.0
OPEN ACCESS
Effects of sound exposure on the growth
and intracellular macromolecular
synthesis of
E. coli
k-12
Shaobin Gu, Yongzhu Zhang and Ying Wu
College of Food and Bioengineering, Henan University of Science and Technology, Luoyang Henan, China
ABSTRACT
Microbes, as one of the primary producers of the biosphere, play an important role in ecosystems. Exploring the mechanism of adaptation and resistance of microbial population to various environmental factors has come into focus in the fields of modern microbial ecology and molecular ecology. However, facing the increasingly serious problem of acoustic pollution, very few efforts have been put forth into studying the relation of single cell organisms and sound field exposure. Herein, we studied the biological effects of sound exposure on the growth ofE. coliK-12 with different acoustic parameters. The effects of sound exposure on the intracellular macromolecular synthesis and cellular morphology of E. coliK-12 were also analyzed and discussed. Experimental results indicated that E. coli K-12 exposed to sound waves owned a higher biomass and a faster specific growth rate compared to the control group. Also, the average length ofE. coli K-12 cells increased more than 27.26%. The maximum biomass and maximum specific growth rate of the stimulation group by 8000 Hz, 80dB sound wave was about 1.7 times and 2.5 times that of the control group, respectively. Moreover, it was observed that E. coli K-12 can respond rapidly to sound stress at both the transcriptional and posttranscriptional levels by promoting the synthesis of intracellular RNA and total protein. Some potential mechanisms may be involved in the responses of bacterial cells to sound stress.
SubjectsBiochemistry, Biotechnology, Environmental Sciences, Microbiology Keywords Sound exposure,E. coliK-12, Biomass, Cellular morphology
INTRODUCTION
The sound wave is a key component of environmental factors (Levin, 1995). In the natural world almost all living organisms are ‘‘immersed’’ in a variety of sound waves and interact with them (Dãnet, 2005). Sound waves are roughly classified into three regimes by its frequency: infrasound (10−4–20 Hz), audible sound (20×104Hz) and ultrasound (2×10⁴–
application field, e.g., infrasound diagnosis and therapeutic infrasound (Anastassiades &
Petounis, 1976;Yount et al., 2004).
However, with the rapid development of industrialization and urbanization, acoustic pollution has increasingly become the focus of attention. After air and aquatic pollution, noise pollution is considered third-largest public hazard in the modern cities. Long-term exposures to noise will cause diseases such as heart vascular disease, cognitive dysfunction, sleep disorders, and tinnitus (Fritschi et al., 2011). For each 10 dB of added sound exposure, the stroke rate will increase by 1.14% (Sørensen et al., 2011), and the incidence of myocardial infarction will enhance by 1.12% (Sørensen et al., 2012). Moreover, a recently published study by Chan & Blumstein, 2012shows that anthropogenic noises may modify critical ecological services in a woodland ecosystem and, by enhancing pollination and disrupted seed dispersal, expands the impact of noise into a new discipline—community ecology. Microbes, as one of the primary producers of the biosphere, play an important role in ecosystems, whether long-term sound exposure will change their physiological and ecolog-ical behavior, and how these changes affect themselves and the whole ecologecolog-ical system. To explore the mechanism of adaptation and resistance of microbial population to sound expo-sure, we examined the effects of sound exposure on the growth ofE. coliK-12 with different acoustic parameters. The effects of sound exposure on the intracellular macromolecular synthesis and cellular morphology of E. coliK-12 were also analyzed and discussed.
MATERIALS AND METHODS
E. coli strain
E. coliK-12 (4401, from The Coli Genetic Stock Center) was first cultured in LB slant agar medium at 37◦
C for 24 h. Then, cells were expanded in a 250 ml conical flask containing 100 ml of LB liquid medium with agitation of 180 rpm on a rotary shaking incubator at 37◦
C for 10 h.
Sound wave load apparatus
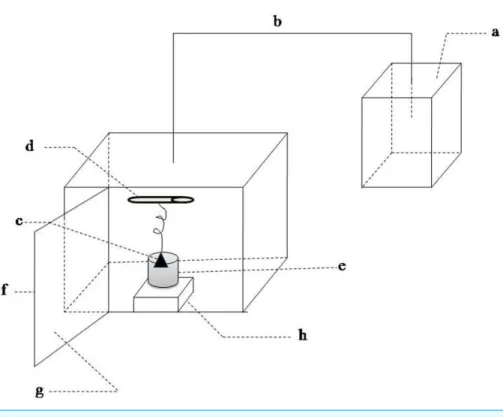
Sound exposure test were performed in the experimental installations (Fig. 1). This equipment was composed of the sound wave generating unit and sound wave load chamber. The former contained a waveform generator and the amplifying circuit. The signals produced by the waveform generator were amplified and then sent to a speaker. The inner walls of the sound load chamber were made with sound-absorbing material. The outer walls of chamber were wrapped by a metal shell in order to reduce the influence of environmental noise. The waterproof speaker was immersed in the 75% alcohol for 30 min and then irradiated by UV to kill bacteria before it was put into the LB medium. The sound frequency and intensity was set according to the experiment design. More details were described inGu et al. (2010).
Sound exposure experiments
Figure 1 Schematic of sound waves load apparatus.(A) sound waves source; (B) sound waves transmis-sion conductor; (C) speaker; (D) ultraviolet light; (E) beaker; (F) metal case; (G) sound-absorbing mate-rial; (H) magnetic stirrer.
was exposed to different conditions: (I) sound frequency varied from 250 to 16,000 Hz and maintained sound intensity level 80 dB and sound power level 55 dB; (II) sound intensity level varied from 0 to100 dB and maintained sound frequency 8 kHz and sound power level 55 dB; (III) sound power level varied from 55 to 63 dB and maintained 8 kHz and 80 dB. Sound frequency and intensity level were adjusted by waveform generator and the amplifying circuit in the sound-wave generating unit, respectively. Sound intensity also known as acoustic intensity is defined as the sound power per unit area. Sound intensity level (SIL) is the level (a logarithmic quantity) of the intensity of a sound relative to a reference value. Sound power or acoustic power is the rate at which sound energy is emitted, reflected, transmitted or received, per unit time. Sound power level (SWL) is a logarithmic measure of the power of a sound relative to a reference value. The variation of sound power level was realized by adjusting the size of the speaker. Sound power level was measured by an instrument (LAN-XI, B & K, Denmark).
Samples without sound exposure served as a control group. The temperature within the sound waves load apparatus was maintained at 37±1◦C. The sound exposure was performed continuously in the whole experiment, and the magnetic stirrer was stirring for 5 min per 15 min.
Measurement of biomass and specific growth rate
to the method of being dried for six hours at 70◦C , and the specific growth rateµwas
calculated as follow:
µ= 1m
m×1t
weremis the whole dry cell weight,µis the specific growth rate,1mis the addition of dry cell weight in1t hours, andµmaxis the maximum specific growth rate.
Measurement ofE. coli K-12 intracellular protein and RNA
The culture was sampled every 6 h, and then concentrated or diluted to 1 (OD600). Protein
was extracted using Bacterial Protein Extraction Kit (BS596, Sangon Biotech Co, Ltd, Shanghai, China) and quantified by a Modified BCA Protein Assay Kit (SK3051; Sangon Biotech Co, Ltd, Shanghai, China). Total RNA was extracted by HiPure Bacterial RNA Kit (R4181-01; Magen, China) and quantified by a spectrophotometer (DS-11; DeNovix, Wilmington, DE, USA).
Morphologic observation of E. coli K-12
Under sound wave frequency 8 kHz and power level 61 dB, E. coliK-12 was exposed to an intensity level of 80 dB and 100 dB, respectively. Cells were sampled at 48 h, centrifuged, washed with distilled water, dehydrated using graded ethanol (20%, 50%, 80%, 100%), and then dissoved in distilled water. Samples were dried on glass slides, and then a layer of metal film was plated on the surface of glass slide in a vacuum evaporator. Morphology observation ofE. coliK-12 was performed by scanning electron microscope (SEM) (JSM-5610LV; JEOL, Tokyo, Japan). A total of 100 randomly selected bacterial cells were measured, and the average size of the bacterial cells was calculated.
Statistical analysis
All the experiments were performed in triplicate, and measurements are reported as mean±standard deviation (SD). Statistical analysis was performed by applying variance (ANOVA) multiple comparisons (single factor) in SPSS. Treatment effects were considered to be significant atP<0.05.
RESULTS
Effect of different acoustic parameters on the growth of E. coli K-12
Effects of sound frequency on E. coli K-12
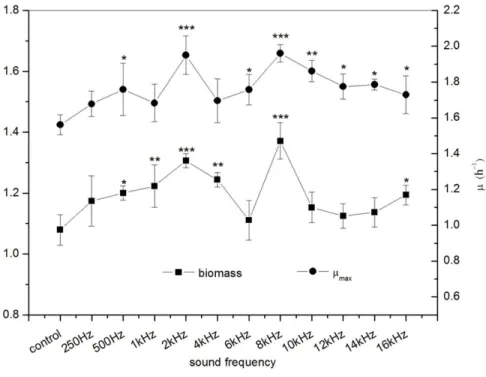
The effects of sound frequency on the biomass andµmaxofE. coliK-12 were shown in
Fig. 2. The results indicated that the sound treatment with different frequencies significantly increase the biomass ofE. coliK-12. Significant differences (P<0.001) in biomass were observed whenE. coliK-12 was exposed to sound frequency 2 kHz and 8 kHz, which were increased by about 21.04% and 27.06% versus the control group, respectively. Meanwhile, exposure ofE. coli K-12 to 2 kHz and 8 kHz sound waves also led to an increase of the µmax, reflecting a faster growth of the treated group than the control group. Theµmaxof
the treatedE. coliK-12 with 2 kHz and 8 kHz were 1.951 h−1and 1.961 h−1respectively.
Figure 2 Effects of sound frequency on the growth ofE. coliK-12. All experiments were exposed to
sound intensity level 80 dB and power level 55 dB. Asterisks indicate significance:∗∗∗p<0.001,∗∗0.001<
p<0.01,∗
0.01<p<0.05. Vertical bars represent means± SD.
accelerated theE. coliK-12 growth and the biological effects induced by sound waves stimuli had a non-linear relationship with frequency, and showed obvious frequency peculiarities.
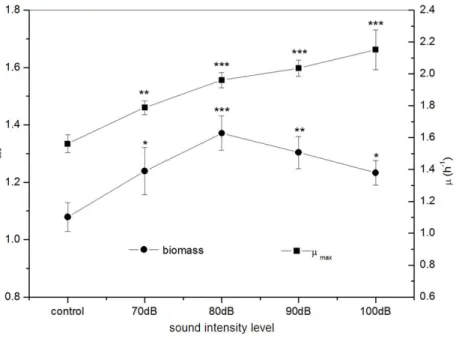
Effect of sound intensity level on E. coli K-12
Under frequency 8 kHz and power level 55 dB,E. coliK-12 was exposed to sound waves with different sound intensity levels. We found that the biomass of theE. coliK-12 were significantly higher in the treated group with sound intensity level 80 dB compared to the control group. A rapid increase of biomass in the treated group was observed reaching a maximum of 1.371 (OD600) with sound intensity level 80 dB, about 27.06% higher in the
treated group as compared with the control group, and then it decreased sharply (Fig. 3). TheµmaxofE. coliK-12 increased sharply and reached the peak at sound intensity level 80
dB, and then enhanced more slowly (Fig. 3). Particularly when the sound intensity level was 100 dB, theµmax(2.151 h−1) was approximately 1.4 times that of the control group
(1.562 h−1). Moreover, we also found that the logarithmic phase in the experimental group
exposed to sound intensity level 80 dB was extended by 21.12% compared to the 100 dB sound stimuli (data was shown inFig. S1). This is the reason why theµmaxenhanced slowly
but the biomass dramatically reduced, when the sound intensity was increased from 80 dB to 100 dB.
Effect of sound power level on E. coli K-12
Figure 3 Effects of sound intensity level on the growth ofE. coliK-12.All experiments were exposed
to the sound fields (sound intensity level varied from 0 to 100 dB and maintained sound frequency 8 KHz and sound power level 55 dB). Asterisks indicate significance:∗∗∗p<0.001,∗∗0.001<p<0.01,∗0.01<p<
0.05. Vertical bars represent means± SD.
Figure 4 Effects of sound power level on the growth ofE. coliK-12. All experiments were exposed to
the sound fields (sound power level varied from 55 to 63 dB and maintained sound frequency 8 KHz and sound intensity level 80 dB). Asterisks indicate significance:∗∗∗p<0.001,∗∗0.001<p<0.01. Vertical bars
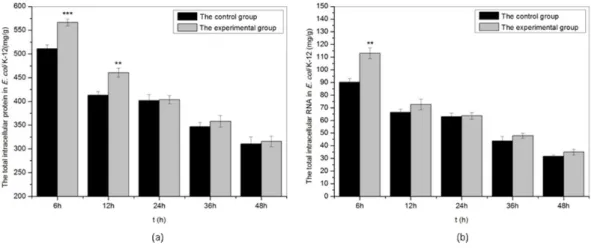
Figure 5 The total intracellular protein and RNA ofE. coliK-12 exposed to sound wave at different time.(A) The total intracellular protein. (B) The total intracellular RNA. All experiments were exposed to sound frequency 8 KHz, intensity level 80 dB and power level 61 dB. Asterisks indicate significance:∗∗∗p<
0.001,∗∗
0.001<p<0.01. Vertical bars represent means±SD.
from sound power level 59 dB to 61 dB and then reduced sharply. The maximum biomass ofE. coliK-12 treated with sound power level 61 dB was 1.863 (OD600), about 1.7 times
that of the control group (OD600 1.079). Theµmax ofE. coliK-12 was elevated rapidly
to the peak at 61 dB, and then it declined drastically. Particularly whenE. coliK-12 were exposed to sound power level 61 dB, theµmax (3.837 h−1) was about 2.5 times that of the control group (1.562 h−1). While the sound power level exceeded 61 dB, both biomass and
µmaxbecame gradually decreased, which could reflect that excess sound exposure might
evoke an inhibition of the growth ofE. coliK-12 by some potential mechanisms.
Effects of sound exposure on intracellular macromolecular synthesis
inE. coli k-12
As shown in Fig. 5, we studied the effects of sound waves on the intracellular macromolecular ofE. coli K-12 with frequency 8 kHz, intensity level 80 dB and power level 61 dB and found that certain sound exposure significantly affected the intracellular protein and RNA inE. colik-12. The intracellular protein and RNA both in the treated group and the control group reduced slowly with time. Under sound exposure, the concentration of intracellular protein presented a significant increase in the treated group at 6 h, and the value of intracellular protein in the treated group reached 566.4 mg/g, about 1.1 times that of the control group (511.1 mg/g). The concentration of the intracellular RNA ofE. coliK-12 also increased significantly in the treated group at 6 h. WhenE. coliK-12 were continuously exposed to sound waves for 6 h, the intracellular RNA (113.0 mg/g) in treated group was about 1.25 times that of the control group (90.1 mg/g). We concluded that sound exposure can significantly promote synthesis of the intracellular protein and RNA ofE. coliK-12 in the early treatment stages, which was in favor of cell division.
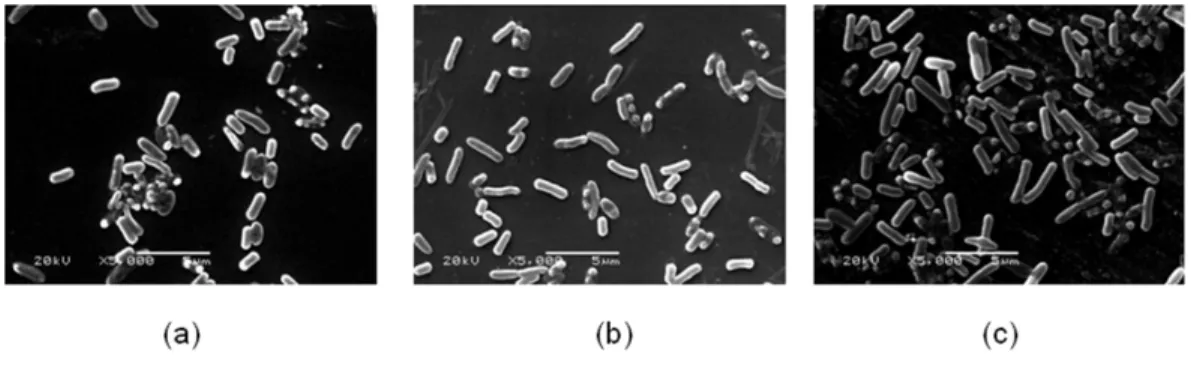
Figure 6 The bacterial cell morphology ofE. coliK-12 of SCE. (A) The cells in the control group. (B)
The cells exposed to sound frequency 8 KHz, intensity level 80 dB and power level 61 dB. (C) The cells ex-posed to sound frequency 8 KHz, intensity level 100 dB and power level 61 dB. Cells were sampled at 48 h.
that the average length ofE. coliK-12 reached 2.060±0.485µm (80 dB) and 2.395±
0.904µm (100 dB) respectively, and its length increases more than 27.26% under sound
intensity level 100 dB compared to the control group (1.882±0.375µm). However, no
difference was observed in width.
DISCUSSION
Sound is a mechanical wave that results from the back-and-forth vibration of the particles of a medium. If it is moving through living organisms, then cells will be displaced both rightward and leftward as the energy of sound wave passes through them result in biological effects. Some organisms might respond to sound stimulation with a positive effect on growth. From Fig. 2, we noted that sound stimulation evidently promoted the growth ofE. coliK-12.Cai et al. (2014)reported that the germination period of mung beans was reduced after audible sound treatments with 1.0–2.5 kHz. The PO algae under exposure of sound waves with frequency of 2,200 Hz had greatly significant increase in dry biomass (Cai et al., 2013).Chen (2013)also showed that sound waves with main frequency such as 2 kHz in environment of wild plants had better effects on plant growth than other kinds of audible sound. However, the inhibition effect of sound waves on microbial growth was also observed.Sarvaiya & Kothari (2015)reported thatSerratia marcescenswere found to suffer a decrease in growth under the influence of music. Also, all sonic stimuli tested reduced biomass production of the yeast cells by 14% (Aggio, Obolonkin & Villas-Bôas, 2012). In addition, we also found that the sound waves at frequency 2 kHz and 8 kHz evoke the most significant growth promotion ofE. coliK-12. It suggested that the action of sound waves showed obvious frequency peculiarities. Matsuhashi et al. (1998)found that cells ofB.Subtiliscould produce sound waves and the frequencies of the sound produced by
B.Subtiliswere similar with the frequencies that induced a response inB.Carboniphilus. Furthermore, microbial cells can absorb more energy when the frequency of the incoming vibration matches their natural frequency of vibration (Reguera, 2011).Ying, Dayou &
Chong (2009)revealed that the increases of viable cells ofE. coliwere equivalent to 7%,
increased more than 31.5%, 86.0% and 31.1% for the sound treatment at 1 kHz, 5 kHz and 10 kHz than the control group. In this paper, we found that the biomass ofE. coliK-12 increased more than 13.3%, 15.3% and 6.8% for the sound treatment at 1 kHz, 4 kHz and 10 kHz than the control. These findings suggested that significant differences of biological effects induced by sound stimulation exist between different strains of the same species, species of the same genus and genera of the same family.
The investigations of sound waves exposed to different intensity and power level showed that sound stimulation at certain strength can promote the growth ofE. coliK-12.Sun &
Cai (1999)andShen et al. (1999)observed that sound stimulation could benefit the absorb
of nutriment and synthesis of DNA in S period of tobacco cells and promote the fluidity of membrane wall and membrane lipid. However, our experiments indicated that a high level of sound power (sound power level at 63 dB or sound intensity at 100 dB) could induce an obvious decrease inE. coliK-12 growth promotion effects.Li et al. (2001)noted that when the sound intensity increase from 100 dB to 110 dB, the number of tobacco cells in S period reduced greatly. Consequently, excessive sound exposure might bring out negative effects on the growth ofE. coliK-12 through some unknown way.
It is necessary for cell division to accumulate rapidly intracellular biological macromolecules, such as nucleic acid molecules, proteins, lipids and polysaccharides. As shown inFig. 5, sound exposure could significantly promote synthesis of the intracellular protein and RNA in the early treatment stages. The value of intracellular protein and RNA at 6 h reached 566.4 mg/g and 113.0 mg/g in the treated group were 1.1 times and 1.25 times that of the control group respectively. It was also reported that sound stimulation can promote the synthesis of intracellular molecules such as protein (Yang, 2013), RNA (Wang et al., 2003) and DNA (Li et al., 2001) in plants.Schaechter, Maaloe & Kjeldgaard
(1958)authenticated that not only cell mass, but also nucleic acid and protein content were
a function of growth rate rather than the composition of the medium used to achieve that growth rate.
In addition,Vadia & Levin (2015)verified that cell size is a linear function of growth rate. Taheri-Araghi et al. (2014)demonstrated that cells add a constant volume each generation based on the combination of experimental results and quantitative analysis. In our experiments, sound stimulation can induce the change of cell morphology except for the growth, metabolism and cell division. We found that the average length of E. coli K-12 exposed to sound intensity level 100 dB increased more than 27.26% compared to the control group.Pelling et al. (2004)observed that the cell wall of cells of
Saccharomyces cerevisiae exhibited local, periodic nanoscale motions in an acoustically insulated environment using an atomic force microscope (AFM). The membrane fluidity increased under sound stimulation of some strength and frequency (Zhao et al., 2002). Sound stimulation also changed the secondary structure of the cell wall proteins of tobacco cells.
‘‘effector’’ for mechanical stimulation (Anishkin & Kung, 2005;Martinac, 2011). When sound waves got through the cell membrane surface it would open Msc, resulting in some small molecules outside the cell such as H2O, Na+, K+ and Ca2+ pass freely through the
cell membrane (Booth et al., 2007;Nazarenco et al., 2003). It is well known that Ca2+ , as a second messenger, plays an important role in the life activities of microbes (Ren et al., 2009). Furthermore, studies of the plant response to mechanical stimulation found that calcium signal was an early event in stress reaction (Zhang et al., 2010). We speculated that bacterial cells might sense the sound stimuli by Msc and convert physical stimuli into biological signals by the inflow of Ca2+
. In addition, bacteria dominated the increasing cell-population density by quorum sensing (Taj et al., 2014), and E. coli had a whole quorum sensing system with AI-2 as signal molecule (Ting, 2009). It was obvious that the cell-population density ofE. coliK-12 increased greatly under the condition of sound stimuli and without the addition of any nutriments compared to the control group. The result suggested that sound exposure may assist E. coliK-12 in obtaining a relatively high threshold level of cell growth by passivated density—dependent inhibition. In the subsequent research, we will aim to explore and verify the related mechanism.
The results of this study indicated that sound while travelling through microbial suspensions created a kind of mechanical stress, which can be sensed by a growth vessel inside cells, and living organisms including microbes can rapidly respond to the stress at both the transcriptional and posttranscriptional levels. However, the mechanism of sound stimulation on microorganism growth is still unknown. Our further work will concentrate on the production of AI-2 and the concentration of intracellular calcium inE. coliK-12 that occurs in response to sound waves, which will certainly provide new insights into the interaction of microbes with sound exposure in general.
ADDITIONAL INFORMATION AND DECLARATIONS
Funding
This work was supported by National Natural Science Foundation of China (Grant No. U1304307) and the Young Core Instructor Foundation from the Education Commission of Henan Province, China (Grant No. 2014GGJS-056). The funders had no role in study design, data collection and analysis, decision to publish, or preparation of the manuscript.
Grant Disclosures
The following grant information was disclosed by the authors: National Natural Science Foundation of China: U1304307.
Young Core Instructor Foundation from the Education Commission of Henan Province, China: 2014GGJS-056.
Competing Interests
The authors declare there are no competing interests.
Author Contributions
• Yongzhu Zhang performed the experiments, analyzed the data, contributed reagents/materials/analysis tools, wrote the paper, prepared figures and/or tables. • Ying Wu conceived and designed the experiments, performed the experiments, analyzed
the data, contributed reagents/materials/analysis tools, wrote the paper, reviewed drafts of the paper.
Data Availability
The following information was supplied regarding data availability: The raw data has been supplied asData S1.
Supplemental Information
Supplemental information for this article can be found online athttp://dx.doi.org/10.7717/ peerj.1920#supplemental-information.
REFERENCES
Aggio RBM, Obolonkin V, Villas-Bôas SG. 2012.Sonic vibration affects the metabolism of yeast cells growing in liquid culture: a metabolomic study.Metabolomics
8:670–678DOI 10.1007/s11306-011-0360-x.
Anastassiades AJ, Petounis AD. 1976.Infrasonic analysis of carotid vibration as a diagnostic method in carotid insufficiency syndrome.Physics in Medicine & Biology
21:128–133DOI 10.1088/0031-9155/21/1/011.
Anishkin A, Kung C. 2005.Microbial mechanosensation.Current Opinion in Neurobiol-ogy15:397–405DOI 10.1016/j.conb.2005.06.002.
Booth IR, Edwards MD, Black S, Schumann U, Miller S. 2007.Mechanosensitive channels in bacteria: signs of closure?Nature Reviews Microbiology 5(6):431–440
DOI 10.1038/nrmicro1659.
Cai W, He H, Zhu S, Wang N. 2014.Biological effect of audible sound control on mung bean (vigna radiate) sprout.Biomed Research International2014:1209–1215.
Cai W, Wang N, Dunford NT, Zhu S, He H. 2013.Study of audible sound effect on algae growth.An ASABE Meeting Presentation1316–11458.
Chan AY, Blumstein DT. 2012.Anthropogenic noise’s first reverberation into community ecology.Proceedings of the Royal Society B Biological Sciences
279(1739):2725–2726DOI 10.1098/rspb.2012.0497.
Chen Z. 2013. Effects of intelligent audio control on the growth of hydroponic plants. D. China. Thesis, Zhejiang University.
Dãnet AF. 2005.Environmental pollution monitoring: pollution, analysis, legislation, quality assurance and managing. Bucharest: S.C. Pro Act Birotic S.R.L, 56–64. Fritschi L, Brown AL, Kim R, Schwela DH, Kephalopoulos S. 2011.Burden of disease
from environmental noise, The WHO European centre for environment and health. Geneva: WHO Regional Office for Europe, 7–11.
Leighton TG. 2007.What is ultrasound?Progress in Biophysics & Molecular Biology
93:3–83DOI 10.1016/j.pbiomolbio.2006.07.026.
Leventhall G. 2007.What is infrasound?Progress in Biophysics & Molecular Biology
93:130–137DOI 10.1016/j.pbiomolbio.2006.07.006.
Levin H. 1995.Physical factors in the indoor environment.Occupational Medicine
10:59–94.
Li T, Hou YX, Cai GY, Shen ZW, Xi BS, Tao ZL. 2001.Analysis of the effect of strong sound wave on plant cells cycles using flow cytometry.Acta Biophysica Sinica
17:195–198.
Martinac B. 2011.Bacterial mechanosensitive channels as a paradigm for mechanosen-sory transduction.Cellular Physiology and Biochemistry 28(6):1051–1060
DOI 10.1159/000335842.
Matsuhashi M, Pankrushina AN, Takeuchi S, Ohshima H, Miyoi H, Endoh K, Mu-rayama K, Watanabe H, Endo S, Tobi M, Mano Y, Hyodo M, Kobayashi T, Kaneko T, Otani S, Yoshimura S, Harata A, Sawada T. 1998.Production of sound waves by bacterial cells and the response of bacterial cells to sound.Journal of General & Applied Microbiology 44(1):49–55DOI 10.2323/jgam.44.49.
Nazarenco LV, Andreev IM, Lyukevish AA, Pisareva TV, Los DA. 2003.Calcium release fromSynechocystiscells induced by depolarization of the plasma mem-brane: MscL as an outward Ca2+channel.Microbiology-sgm149(5):1147–1153
DOI 10.1099/mic.0.26074-0.
Pelling AE, Sehati S, Gralla EB, Valentine JS, Gimzewski JK. 2004.Local nanomechani-cal motion of the cell wall of saccharomyces cerevisiae.Science305(5687):1147–1150
DOI 10.1126/science.1097640.
Reguera G. 2011.When microbial conversations get physical.Trends in Microbiology
19:105–113DOI 10.1016/j.tim.2010.12.007.
Ren XH, Wang SL, Wen Y, Yang KQ. 2009.An update of calcium signaling in bacteria-A review.Acta Microbiologica Sinica49:1564–1570.
Rokhina EV, Lens P, Virkutyte J. 2009.Low-frequency ultrasound in biotechnology: state of the art.Trends in Biotechnology27:298–306 DOI 10.1016/j.tibtech.2009.02.001. Sarvaiya N, Kothari V. 2015.Effect of audible sound in form of music on microbial
growth and production of certain important metabolites.Microbiology84:227–235
DOI 10.1134/S0026261715020125.
Schaechter M, Maaloe O, Kjeldgaard NO. 1958.Dependency on medium and temperature of cell size and chemical composition during balanced growth of salmonella typhimurium.Journal of General Microbiology19:592–606
DOI 10.1099/00221287-19-3-592.
Shen ZW, Sun KL, Yang J, Cai GY, Xi BS. 1999.The secondary structure changes of plant cell wall proteins aroused by strong sound waves using FT IR.Acta Photonica Sinica
18:600–602.
incident myocardial infarction: a prospective cohort study.PLoS ONE7(6):e39283
DOI 10.1371/journal.pone.0039283.
Sørensen M, Hvidberg M, Andersen ZJ, Nordsborg RB, Lillelund KG, Jakobsen J, Tjonneland A, Overvad K, Raaschou-Nielsen O. 2011.Road traffic noise and stroke: a prospective cohort study.European Heart Journal32(6):737–744
DOI 10.1093/eurheartj/ehq466.
Sun K, Cai G. 1999.The effects of alternative stress on the thermodymical properties of cultured tobacco cells.Acta Biophysica Sinica15:579–583.
Taheri-Araghi S, Bradde S, Sauls JT, Hill NS, Levin PA, Paulsson J, Vergassola M, Jun S. 2014.Cell-size control and homeostasis in bacteria.Current Biology25:385–391
DOI 10.1016/j.cub.2014.12.009.
Taj MK, Wei YL, Samreen Z, Taj I, Hassani TM, Ji XL. 2014.Quorum sensing and its different signals systems in bacteria.Impact International Journal of Research in Applied Natural & Social Sciences2:117–124DOI 10.3390/s120302519.
Ting X. 2009.Escherichia coliand staphylococcus aureus AI-2 quorum-sensing system regulation research. D. China. Thesis, University of Science and Technology of China.
Vadia S, Levin PA. 2015.Growth rate and cell size: a re-examination of the growth law.
Current Opinion in Microbiology 24:96–103DOI 10.1016/j.mib.2015.01.011. Wang XJ, Wang BC, Jia Y, Duan CR, Sakanishi A. 2003.Effect of sound wave on the
synthesis of nucleic acid and protein in chrysanthemum.Colloids & Surfaces B: Biointerfaces29:99–102DOI 10.1016/S0927-7765(02)00152-2.
Whittingham TA. 2007.Medical diagnostic applications and sources.Progress in Bio-physics & Molecular Biology93(1–3):84–110DOI 10.1016/j.pbiomolbio.2006.07.004. William D, O’Brien J. 2007.Ultrasound–biophysics mechanisms.Progress in Biophysics &
Molecular Biology 93:212–255DOI 10.1016/j.pbiomolbio.2006.07.010.
Yang B. 2013.A research on the effects of audible wave exposure on the physiological and ecological characteristics ofEscherichia coliand its mechanism. Thesis, Henan University of Science and Technology, China.
Ying JCL, Dayou J, Chong KP. 2009.Experimental investigation on the effects of audible sound to the growth ofEscherichia coli.Modern Applied Science3:124–127
DOI 10.5539/mas.v3n3p124.
Yount G, Taft R, West J, Moore D. 2004.Possible influence of infrasound on glioma cell response to chemotherapy: a pilot study.Journal of Alternative and Complementary Medicine10:247–250 DOI 10.1089/107555304323062239.
Zhang FF, Li ZG, Du CK, Gong M. 2010.Responses and signaling transduction of plants to mechanical stimulation.Plant Physiology Communications46(6):517–528.
Zhao HC, Wang BC, Cai SX, Xi BS. 2002.Effect of sound stimulation on the lipid physical states and metabolism of plasma membrane from chrysanthemum callus.