www.atmos-chem-phys.net/11/11617/2011/ doi:10.5194/acp-11-11617-2011
© Author(s) 2011. CC Attribution 3.0 License.
Chemistry
and Physics
Reactive processing of formaldehyde and acetaldehyde in aqueous
aerosol mimics: surface tension depression and secondary organic
products
Z. Li, A. N. Schwier, N. Sareen, and V. F. McNeill
Department of Chemical Engineering, Columbia University, New York, NY, 10027, USA Received: 15 June 2011 – Published in Atmos. Chem. Phys. Discuss.: 7 July 2011
Revised: 2 November 2011 – Accepted: 3 November 2011 – Published: 22 November 2011
Abstract. The reactive uptake of carbonyl-containing volatile organic compounds (cVOCs) by aqueous atmo-spheric aerosols is a likely source of particulate organic mate-rial. The aqueous-phase secondary organic products of some cVOCs are surface-active. Therefore, cVOC uptake can lead to organic film formation at the gas-aerosol interface and changes in aerosol surface tension. We examined the chemi-cal reactions of two abundant cVOCs, formaldehyde and ac-etaldehyde, in water and aqueous ammonium sulfate (AS) solutions mimicking tropospheric aerosols. Secondary or-ganic products were identified using Aerosol Chemical Ion-ization Mass Spectrometry (Aerosol-CIMS), and changes in surface tension were monitored using pendant drop tensiom-etry. Hemiacetal oligomers and aldol condensation prod-ucts were identified using Aerosol-CIMS. Acetaldehyde de-presses surface tension to 65(±2) dyn cm−1in pure water (a 10 % surface tension reduction from that of pure water) and 62(±1) dyn cm−1in AS solutions (a 20.6 % reduction from that of a 3.1 M AS solution). Surface tension depression by formaldehyde in pure water is negligible; in AS solutions, a 9 % reduction in surface tension is observed. Mixtures of these species were also studied in combination with methyl-glyoxal in order to evaluate the influence of cross-reactions on surface tension depression and product formation in these systems. We find that surface tension depression in the solu-tions containing mixed cVOCs exceeds that predicted by an additive model based on the single-species isotherms.
Correspondence to:V. F. McNeill
1 Introduction
Organic material is a ubiquitous component of atmospheric aerosols, making up a major fraction of fine aerosol mass, but its sources and influence on aerosol properties are still poorly constrained (Jimenez et al., 2009; Kanakidou et al., 2005). Many common organic aerosol species are surface-active (Facchini et al., 1999; Shulman et al., 1996). Surface-active molecules in aqueous solution form structures that al-low hydrophobic groups to avoid contact with water while hydrophilic groups remain in solution. In an aqueous aerosol particle, they may partition to the gas-aerosol interface, re-ducing aerosol surface tension and potentially acting as a barrier to gas-aerosol mass transport (Folkers et al., 2003; McNeill et al., 2006). Depressed aerosol surface tension due to film formation may lead to a decrease in the critical su-persaturation required for the particle to activate and grow into a cloud droplet as described by K¨ohler Theory (K¨ohler, 1936). The surface tension of atmospheric aerosol samples tends to be lower than that predicted based on the combined effects of the individual surfactants identified in the aerosol (Facchini et al., 1999). This is in part because some surface-active aerosol organics remain unidentified. Additionally, the effects of interactions among these species under typi-cal aerosol conditions (i.e. supersaturated salt concentrations, acidic, multiple organic species) are generally unknown.
11618 Z. Li et al.: Surface tension depression and secondary organic products aqueous-phase chemistry to form low-volatility products, is
a source of secondary organic aerosol material (Ervens and Volkamer, 2010; Lim et al., 2010). We recently showed that methylglyoxal suppresses surface tension in aqueous aerosol mimics (Sareen et al., 2010).
Formaldehyde and acetaldehyde, two abundant, highly volatile aldehydes, can be directly emitted from combus-tion and industrial sources or generated in situ via the oxi-dation of other VOCs (Seinfeld and Pandis, 1998). In aque-ous solution, both formaldehyde and acetaldehyde become hydrated and form acetal oligomers, similar to methylgly-oxal and glymethylgly-oxal (Loudon, 2009) (see Fig. S2 in the Supple-ment for a schematic of the different reaction mechanisms discussed in this study). Nozi`ere and coworkers showed that acetaldehyde forms light-absorbing aldol condensation prod-ucts in aqueous ammonium sulfate solutions (Nozi`ere et al., 2010a). Formaldehyde was also recently suggested to react with amines to form organic salts in tropospheric aerosols (Wang et al., 2010). Due to their prevalence and known aqueous-phase oligomerization chemistry, the reactive pro-cessing of these species in aqueous aerosol mimics, alone and in combination with other cVOCs, is of interest, but has not been thoroughly studied to date.
We investigated the chemical reactions of formaldehyde and acetaldehyde in pure water and concentrated ammo-nium sulfate (AS) solutions mimicking aerosol water. The potential of these species to alter aerosol surface tension was examined, and secondary organic products were iden-tified using Aerosol Chemical Ionization Mass Spectrometry (Aerosol-CIMS).
2 Experimental methods
Aqueous solutions containing varying concentrations of organic compounds (acetaldehyde, formaldehyde and/or methylglyoxal) with near-saturation concentrations (3.1 M) of AS were prepared in 100 ml Pyrex vessels using Millipore water. The concentration of formaldehyde used was 0.015– 0.21 M. The concentration of acetaldehyde was 0.018 M– 0.54 M. In the preparations, 5 ml ampules of 99.9 wt % ac-etaldehyde (Sigma Aldrich) were diluted to 1.78 M using Millipore water immediately after opening in order to min-imize oxidization. Varying amounts of this stock solution were used to prepare the final solutions within 30 min of opening the ampule. Formaldehyde and methylglyoxal (MG) were introduced from 37 wt % and 40 wt % aqueous solutions (Sigma Aldrich), respectively. The pH value of the reac-tion mixtures, measured using a digital pH meter (Accumet, Fisher Scientific), was 2.7–3.1. The acidity of the solutions is attributable to trace amounts of acidic impurities within the organic reagent stock solutions (i.e. pyruvic acid from the MG stock solution).
The surface tension of each sample was measured 24 h after solution preparation using pendant drop tensiometry (PDT). Pendant drops were suspended from the tip of glass capillary tubes using a 100 µl syringe. The images of the pendant drops were captured and analyzed to determine the shape factor, H, and equatorial diameter,de, as described
previously (Sareen et al., 2010; Schwier et al., 2010). These parameters were used to calculate the surface tension accord-ing to:
σ=1ρd
2 e
H (1)
whereσ is surface tension, 1ρ is the difference in density between the solution and the gas phase, andgis acceleration due to gravity (Adamson and Gast, 1997). Solution density was measured using an analytical balance (Denver Instru-ments). The drops were allowed to equilibrate for 2 min be-fore image capture. Each measurement was repeated 7 times. Aerosol-CIMS was used to detect the organic composition of the product mixtures as described in detail previously (Sa-reen et al., 2010; Schwier et al., 2010). Mixtures of formalde-hyde, acetaldehyde-MG, and formaldehyde-MG in water and 3.1 M AS were prepared. Total organic concentration ranged from 0.2–2 M. All the solutions containing AS were diluted after 24 h with Millipore water until the salt concentration was 0.2 M. The solutions were aerosolized in a stream of N2
using a constant output atomizer (TSI) and flowed through a heated 23 cm long, 1.25 cm ID PTFE tube (maintained at 135◦C) at RH>50 % before entering the CIMS, in order to
volatilize the organic species into the gas phase for detection. The time between atomization and detection is≤3.5 s. Since the timescale for the oligomerization of these organics is on the order of hours (Sareen et al., 2010; Nozi`ere et al., 2010a) the detected molecules are most likely formed in the bulk aqueous solutions. The solutions were tested in both posi-tive and negaposi-tive ion mode, using H3O+·(H2O)nand I−as
reagent ions, respectively. The applicability of this approach to the detection of acetal oligomers and aldol condensation products formed by dicarbonyls in aqueous aerosol mim-ics has been demonstrated previously (Sareen et al., 2010; Schwier et al., 2010). The average particle concentration was ∼4×104cm−3and the volume weighted geometric mean
di-ameter was 414(±14) nm.
3 Results
3.1 Surface tension measurements 3.1.1 Single-organic mixtures
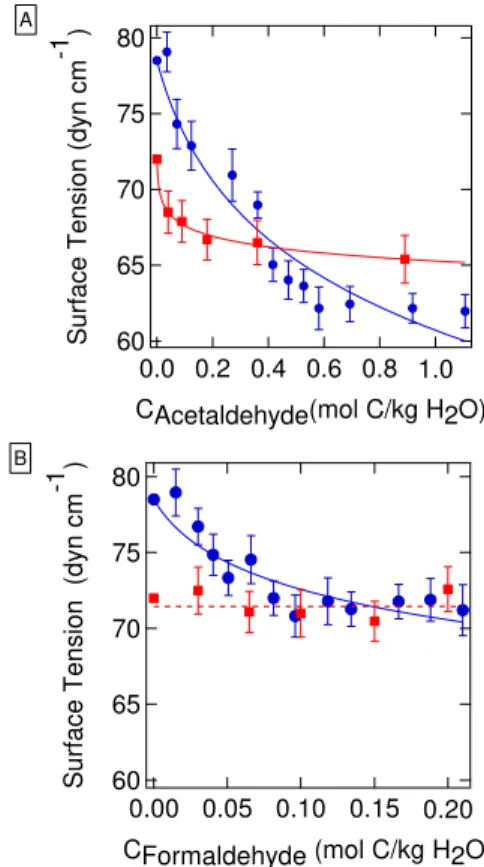
Results of the PDT experiments (Fig. 1) show that both formaldehyde and acetaldehyde depress surface ten-sion in 3.1 M AS solution, but the formaldehyde mix-ture is less surface-active than that of acetaldehyde. The formaldehyde-AS solutions reach a minimum surface ten-sion of 71.4±0.4 dyn cm−1 (a 9 % reduction from that of a 3.1 M AS solution (σ =78.5±0.3 dyn cm−1)), at 0.082 mol C (kg−1 H2O). The acetaldehyde-AS solutions
showed more significant surface tension depression. The surface tension of the solutions reached a minimum of 62±1 dyn cm−1(a 20.6 % reduction compared to 3.1 M AS
solution), when the acetaldehyde concentration exceeded 0.527 mol C (kg−1 H2O). Compared to the surface
sion of the acetaldehyde in 3.1 M AS, the surface ten-sion depresten-sion of acetaldehyde in water is less signifi-cant. The surface tension of acetaldehyde in water decreases rapidly and reaches a minimum value of 65±2 dyn cm−1at 0.89 mol C (kg−1 H2O) (a 10 % reduction from that of pure
water, 72 dyn cm−1). Formaldehyde does not show any de-tectable surface tension depression in water in the absence of AS.
The surface tension data can be fit using the Szyszkowski-Langmuir equation:
σ=σ0−aTln(1+bC) (2)
whereσ andσ0are surface tension of the solution with and
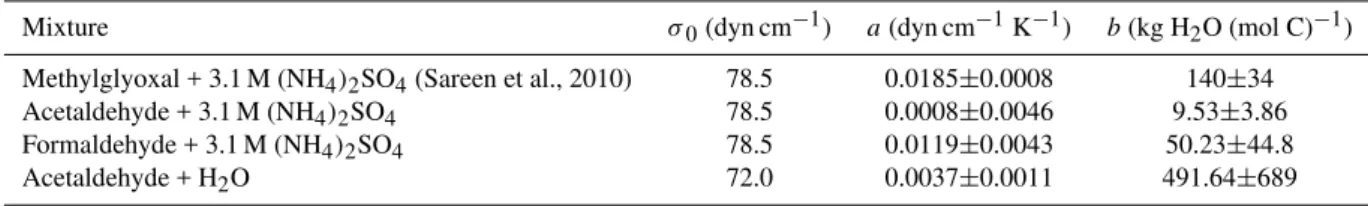
without organics, T is ambient temperature (298 K), C is total organic concentration (moles carbon per kg H2O), and a andb are fit parameters (Adamson and Gast, 1997). The parameters from the fits to the data in Fig. 1 are listed in Table 1.
3.1.2 Binary mixtures
Surface tension results for aqueous solutions containing a mixture of two organic compounds (MG and formaldehyde or acetaldehyde) and 3.1 M AS are shown in Fig. 2. For a given total organic concentration (0.5 or 0.05 M), the surface tension decreased with increasing MG concentration. Re-plotting the data from Fig. 2 as a function of MG concentra-tion, it is apparent that the surface tension was very similar for mixtures with the same MG concentration, regardless of the identity or amount of the other species present in the mix-ture (Fig. 3).
Henning and coworkers developed the following model based on the Szyszkowski-Langmuir equation to predict the surface tension of complex, nonreacting mixtures of organics (Henning et al., 2005):
σ=σ0(T )− X
i
χiaiTln(1+biCi) (3)
80
75
70
65
60
S
u
rfac
e Tension (dyn c
m
-1 )
0.20 0.15 0.10 0.05 0.00
CFormaldehyde (mol C/kg H2O)
B
80
75
70
65
60
Sur
face Tension (
dyn cm
-1 )
1.0 0.8 0.6 0.4 0.2 0.0
CAcetaldehyde(mol C/kg H2O)
A
● ■
Fig. 1. Surface tension of solutions containing (A)acetaldehyde and(B)formaldehyde in 3.1 M AS (blue) and in water (red). The curves shown are fits to the data using the Szyszkowski-Langmuir equation (Eq. 2). A linear fit (red dashed line) is shown for the formaldehyde-water data as a guide to the eye.
Here,Ci is the concentration of each organic species (moles carbon per kg H2O), χi is the concentration (moles
car-bon per kg H2O) of compoundi divided by the total
solu-ble carbon concentration in solution, andai andbi are the fit parameters from the Szyszkowski-Langmuir equation for compound i. The Henning model has been shown to de-scribe mixtures of nonreactive organics, such as succinic acid-adipic acid in inorganic salt solution, well (Henning et al., 2005). We also found that it was capable of describing surface tension depression in reactive aqueous mixtures con-taining MG, glyoxal, and AS (Schwier et al., 2010).
11620 Z. Li et al.: Surface tension depression and secondary organic products
Table 1.Szyszkowski-Langmuir Fit Parameters according to Eq. (2).
Mixture σ0(dyn cm−1) a(dyn cm−1K−1) b(kg H2O (mol C)−1) Methylglyoxal + 3.1 M (NH4)2SO4(Sareen et al., 2010) 78.5 0.0185±0.0008 140±34 Acetaldehyde + 3.1 M (NH4)2SO4 78.5 0.0008±0.0046 9.53±3.86 Formaldehyde + 3.1 M (NH4)2SO4 78.5 0.0119±0.0043 50.23±44.8 Acetaldehyde + H2O 72.0 0.0037±0.0011 491.64±689
70
65
60
55
50
Surf
ace Tension (dy
n
cm
-1 )
0.8 0.6 0.4 0.2 0.0
CAcetaldehyde (mol C/kg H2O) 1.4 1.2 1.0 0.8 0.6 0.4 CMethylglyoxal (mol C/kg H2O)
B
65
60
55
50
Surface
Tension
(d
yn cm
-1 )
1.4 1.2 1.0 0.8 0.6 0.4 CMethylglyoxal (mol C/kg H2O)
0.3 0.2 0.1 0.0
CFormaldehyde (mol C/kg H2O)
C
76
72
68
64
60
Surfac
e T
e
n
s
ion (dy
n
c
m
-1
)
0.06 0.04 0.02 0.00
CAcetaldehyde (mol C/kg H2O) 0.14 0.12 0.10 0.08 0.06 0.04 CMethylglyoxal (mol C/kg H2O)
A
562
■
●
Fig. 2. Surface tension of binary mixtures of acetaldehyde or formaldehyde with MG in 3.1 M AS solutions. The total organic concentration was 0.05 M(A)or 0.5 M(B, C). The black line shows Henning model predictions (Eq. 3) using the parameters listed in Table 1. The grey lines show the confidence interval of the model predictions. Red: MG in AS (based on the Szyszkowski-Langmuir equation (Eq. 2), using the parameters in Table 1). Blue: acetalde-hyde (AandB) or Formaldehyde(C)with MG in 3.1 M AS solu-tions.
3.1.3 Ternary mixtures
As shown in Fig. 4, 3.1 M AS solutions containing ternary mixtures of MG, acetaldehyde and formaldehyde also exhibit surface tension depression lower than that predicted by the Henning model. For the ternary mixture experiments, the molar ratio of acetaldehyde to formaldehyde was either 1:3 (Fig. 4a and b) or 1:1 (Fig. 4c and d) and the MG concen-tration was varied. The total organic concenconcen-tration remained constant at 0.05 M. Recasting the data of Fig. 4 as a function of MG concentration shows a similar trend as what was
ob-58
56
54
52
50
48
Surface Te
nsion (dyn
cm
-1 )
1.0 0.8 0.6 0.4
CMethylglyoxal (mol C/kg H2O)
A
70
68
66
64
62
60
58
Surface
Tension
(dyn cm
-1 )
0.12 0.10 0.08 0.06 0.04
CMethylglyoxal (mol C/kg H2O)
B
▲ ●
▲ ●
■ Fig. 3. Surface tension in binary and ternary organic mixtures (Figs. 2 and 4) as a function of MG concentration. (A) Binary mixtures (0.5 M total organic concentration) red: acetaldehyde-MG, blue: formaldehyde-MG (B) 0.05 M total organic concen-tration. green: ternary mixture (acetaldehyde:formaldehyde=1:1 by mole, varying MG); blue: ternary mixture (acetalde-hyde:formaldehyde=1:3 by mole, varying MG); red: binary mix-ture (acetaldehyde-MG). Black curves indicate the Szyszkowski-Langmuir curve for MG in AS using the parameters in Table 1. Grey curves show the confidence intervals.
75 70 65 60 Surface Te nsion (dyn cm -1) 2.0 1.6 1.2 0.8
CAcetaldehyde (10-2 mol C/kg H2O)
0.12 0.10 0.08 0.06 0.04
CMethylglyoxal (mol C/kg H2O) A 74 72 70 68 66 64 62 60 Su rface Te
nsion (dyn
cm -1) 3.5 3.0 2.5 2.0 1.5
CAcetaldehyde (10-2 mol C/kg H2O)
0.10 0.08 0.06 0.04
CMethylglyoxal (mol C/kg H2O) C 75 70 65 60 Surface Te nsion (dyn cm -1) 3.0 2.5 2.0 1.5 1.0
CFormaldehyde (10-2 mol C/kg H2O)
0.12 0.10 0.08 0.06 0.04
CMethylglyoxal (mol C/kg H2O) B 74 72 70 68 66 64 62 60 Sur fa c e Tens
ion (dy
n cm
-1 )
0.10 0.08 0.06 0.04 CMethylglyoxal (mol C/kg H2O)
1.6 1.2 0.8
CFormaldehyde (10-2mol C/kg H2O) D
582
Fig. 4. Surface tension data for ternary (acetaldehyde, formalde-hyde and MG) mixtures in 3.1 M AS solutions. The molar ratios of acetaldehyde to formaldehyde are 1:3 (AandB) and 1:1 (CandD). The total organic concentration was constant at 0.05 M. The black line shows Henning model predictions using the parameters listed in Table 1. The grey lines show the confidence interval of the pre-dicted data.
3.2 Aerosol-CIMS characterization
The CIMS data show products of self- and cross-reactions of formaldehyde, acetaldehyde and MG in pure water and 3.1 M AS. The resolution for all CIMS data presented here wasm/z±1.0 amu. All the peaks identified and discussed in the following sections have signal higher than that present in a N2background spectrum. Any unlabeled peaks are within
the background, and were not included in the peak assign-ment analysis. We did not perform Aerosol-CIMS analysis on acetaldehyde-AS or acetaldehyde-H2O solutions because
these systems have been characterized extensively by others (Casale et al., 2007; Nozi`ere et al., 2010a). These studies showed the acid-catalyzed formation of aldol condensation products in solutions containing AS.
3.2.1 Formaldehyde
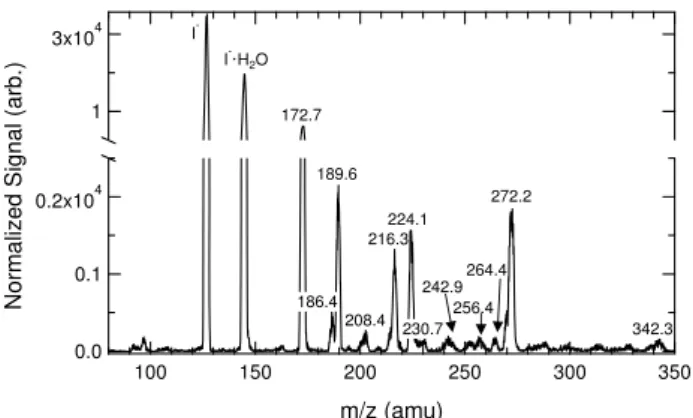
The mass spectra for formaldehyde in H2O and in 3.1 M AS
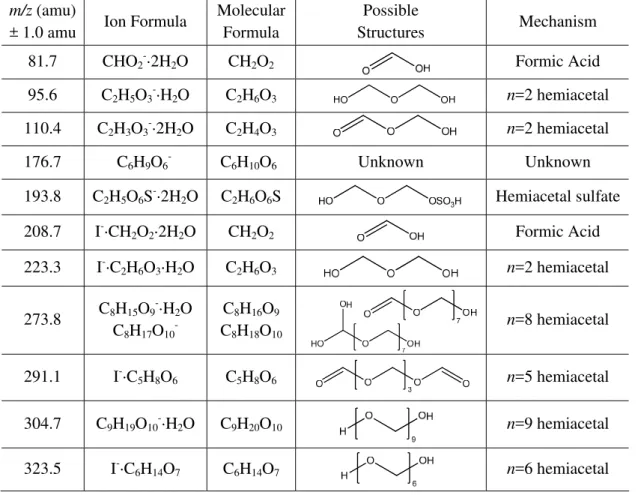
obtained using negative ion detection with I−as the reagent ion is shown in Fig. 5. Possible structures are shown in Ta-ble 2. The spectrum shows peaks with mass-to-charge ra-tios corresponding to formic acid at 81.7 (CHO−2·2H2O) and
208.7 amu (I−·CH2O2·2H2O) and several peaks consistent
with hemiacetal oligomers. 223.3, 291.1, and 323.5 amu are consistent with clusters of hemiacetals with I−. The
0.6x10⁴ 0.4 0.2 0.0 N o rmal iz
ed Signal (arb.)
350 300 250 200 150 100 m/z (amu) 6x10⁴ 2
F in AS F in H2O
I- I
-·H2O
81.7 95.6
176.7 193.8
208.7
223.3 273.8 291.1304.7 323.5 110.4
Fig. 5. Aerosol-CIMS spectra of atomized solutions of 0.2 M formaldehyde in 3.1 M AS and H2O. See the text for details of sam-ple preparation and analysis. Negative-ion mass spectrum obtained using I−as the reagent ion.
peaks at 95.6, 110.4, 273.8 and 304.7 amu are consistent with clusters of ionized hemiacetals with H2O. While
ion-ization of alcohols by I−is normally not favorable, ionized paraformaldehyde-type hemiacetals are stabilized by inter-actions between the ionized -O− and the other terminal hy-droxyl group(s) on the molecule (see Supplement).
The peaks atm/z176.7 and 193.8 amu are not observed in the formaldehyde-H2O spectrum, implying that the species
observed at those masses are formed via reaction with AS. Within our instrument resolution, these peaks could be con-sistent with methanol, which is present in our system due to its use as a stabilizer in formaldehyde solutions. However, methanol does not form stable clusters with I−and therefore
will not be detected using this ionization scheme. The peak at 193.8 amu is consistent with an organosulfate species formed from a formaldehyde hemiacetal dimer (C2H5O6S−·2H2O)
and a satellite peak is also visible at 195.6 amu (see Supple-ment). The abundance of these peaks should be consistent with a 96:4 ratio of stable sulfate isotopes (32S and34S), and instead this ratio is found to be 86:14. This is not incon-sistent with the identification of an organosulfate species at 193.8 amu, but additional compounds could also be present at 195.6 amu. The peak at 176.7 amu matches an ion formula of C6H9O−6, but the structure and formation mechanism is
unknown. Future mechanistic studies are needed in order to resolve products such as this one with unknown chemical structures and/or formation mechanisms.
11622 Z. Li et al.: Surface tension depression and secondary organic products
Table 2.Proposed peak assignments for Aerosol-CIMS mass spectra with I−of atomized solutions of 0.2 M formaldehyde in 3.1 M AS.
solutions of 0.2 M formaldehyde in 3.1 M AS.
m/z (amu)
± 1.0 amu
Ion Formula
Molecular
Formula
Possible
Structures
Mechanism
81.7 CHO
2-·2H
2O CH
2O
2Formic Acid
95.6 C
2H
5O
3-·H
2O C
2H
6O
3n=2 hemiacetal
110.4 C
2H
3O
3-·2H
2O C
2H
4O
3n=2 hemiacetal
176.7 C
6H
9O
6-C
6H
10O
6Unknown Unknown
193.8 C
2H
5O
6S
-·2H
2O C
2H
6O
6S
Hemiacetal sulfate
208.7 I
-·CH
2O
2·2H
2O CH
2O
2Formic Acid
223.3 I
-·C
2H
6O
3·H
2O C
2H
6O
3n=2 hemiacetal
273.8
C
8H
15O
9-
·H
2O
C
8H
17O
10-C
8H
16O
9C
8H
18O
10n=8 hemiacetal
291.1 I
-·C
5H
8O
6C
5H
8O
6n=5 hemiacetal
304.7 C
9H
19O
10-·H
2O C
9H
20O
10n=9 hemiacetal
323.5 I
-·C
6H
14O
7C
6H
14O
7n=6 hemiacetal
3.2.2 Formaldehyde-methylglyoxal mixtures
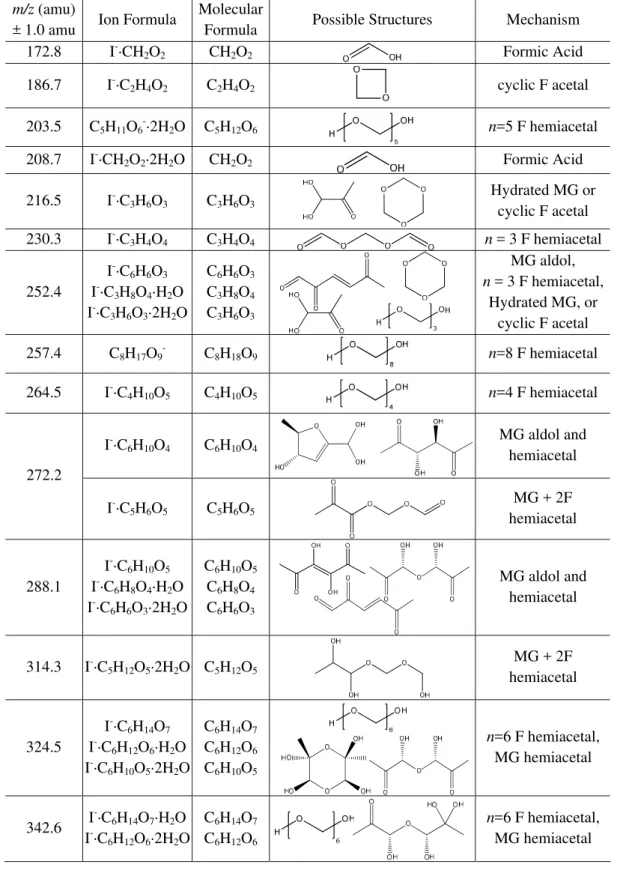
The negative-ion spectrum (detected with I−)for an aqueous mixture of formaldehyde, MG, and AS is shown in Fig. 6, with peak assignments listed in Table 3. Most of the peaks are consistent with formaldehyde hemiacetal oligomers, such as 186.7, 203.5, 230.3, 257.4, and 264.5 amu. Formic acid was detected at 172.8 amu and 208.7 amu. The peak at 288.1 amu corresponds to MG self-reaction products formed either via aldol condensation or hemiacetal mechanisms (Sa-reen et al., 2010; Schwier et al., 2010). Several peaks could correspond to self-reaction products of either formaldehyde or MG: 216.5, 252.4, 324.5, and 342.6 amu. The peak at 314.3 amu is consistent with a hemiacetal oligomer formed via cross-reaction of MG with two formaldehyde molecules, clustered with I− and two water molecules. The peak at 272.2 amu could correspond to either a similar cross-reaction product (MG + 2 formaldehyde) or a MG dimer. Formalde-hyde hemiacetal self-reaction products and formic acid were detected in the positive-ion spectrum (Supplement).
0.2x10⁴
0.1
0.0
N
ormalized S
ignal (arb.)
350 300
250 200
150 100
m/z (amu)
3x10⁴
1
I -I-·H2O
172.8
186.7
203.5
208.7 216.5
230.3 252.4
257.4 264.5
272.2
288.1 314.3 324.5
342.6
25x103 20
15
10
5
0
N
o
rmaliz
ed Signal (arb.)
300 250 200 150 100 50
m/z (amu)
80x103
40
84.4 88.9
95.5
107.2 H3O
+
·(H2O)2
126.0 137.3
145.1 164.7
192.9 206.7
235 248.9 289.6297
Fig. 7. Aerosol-CIMS spectra of atomized solutions of 0.5 M ac-etaldehyde/MG (1:1) in 3.1 M AS. See the text for details of sam-ple preparation and analysis. Positive-ion mass spectrum using H3O+·(H2O)nas the reagent ion.
While the negative-ion spectra of the formaldehyde-AS and formaldehyde-MG-AS mixtures share many similar peaks, there are some differences in the spectra. Small varia-tions in pressure and flow rates within the declustering region can affect the clustering efficiency between the analyte and the parent ions, and surrounding water molecules, resulting in the same analyte compound appearing at differentm/z val-ues.
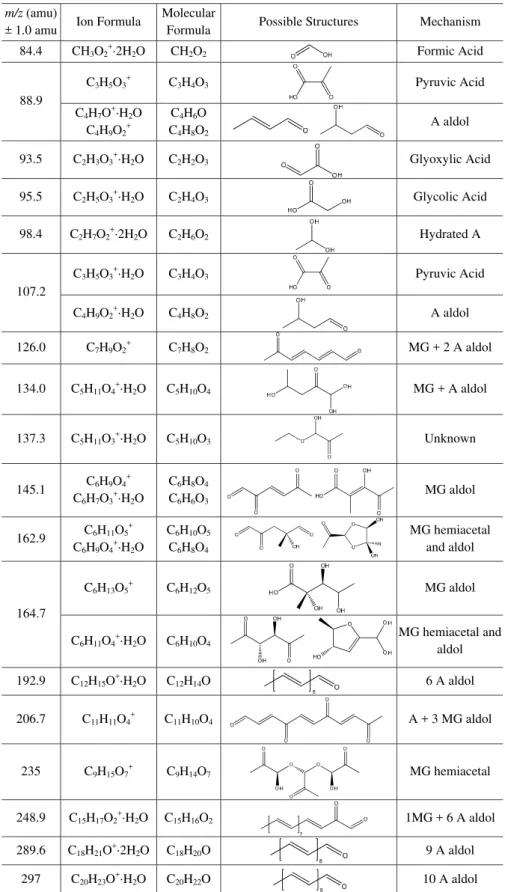
3.2.3 Acetaldehyde-methylglyoxal mixtures
The H3O+·(H2O)nspectrum for aqueous
acetaldehyde-MG-AS mixtures is shown in Fig. 7, with peak assignments listed in Table 4. Several peaks, specifically acetaldehyde aldol condensation products (i.e. 88.9, 107.2, 192.9, 289.6, and 297 amu), are similar to those expected in acetaldehyde-AS solutions (Casale et al., 2007; Nozi`ere et al., 2010a). Hydrated acetaldehyde can be observed at 98.4 amu. Sev-eral peaks are consistent with the cross-reaction products of MG and acetaldehyde via an aldol mechanism (126.0, 134.0, 206.7, and 248.9 amu). Formic, glyoxylic, and glycolic acids correspond to the peaks at 84.4, 93.5, and 95.5 amu, respec-tively. A trace amount of formic acid impurity exists in the 37 % formaldehyde aqueous stock solution. Since no sig-nificant source of oxidants exists in the reaction mixtures, the formation mechanisms for these species in this system are unknown. The peaks at 88.9 and 107.2 are consistent with either pyruvic acid or crotonaldehyde. Large aldol con-densation products from the addition of 6-10 acetaldehydes are observed at 192.9, 289.6, and 297 amu. The peaks at 145.1, 162.9, 164.7 and 235 amu are consistent with MG self-reactions, as discussed by Sareen et al. (2010). The peak at 137.3 amu is consistent with a species with molecular for-mula C5H10O3, but the mechanism is unknown.
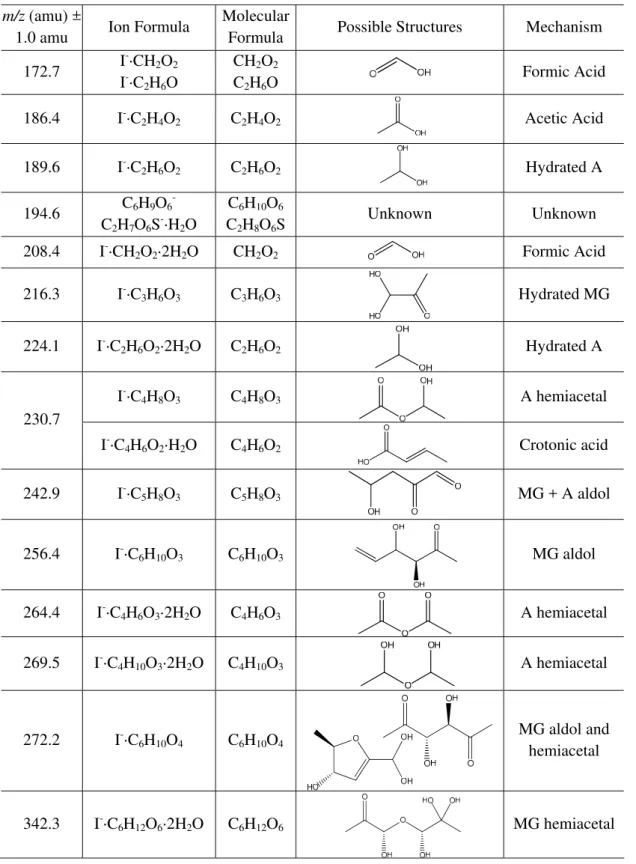
The I− negative-ion spectrum for acetaldehyde-MG-AS mixtures shows similar results to the positive-ion spectrum (see Fig. 8 and Table 5), however aldol condensation
prod-0.2x10⁴
0.1
0.0
Norm
alized Signal (arb.)
350 300
250 200
150 100
m/z (amu)
3x10⁴
1 172.7
186.4 189.6
208.4 216.3
224.1
230.7 242.9
256.4 264.4
272.2
342.3 I
-I-·H2O
Fig. 8. Aerosol-CIMS spectra of atomized solutions of 2 M ac-etaldehyde/MG (1:1) in 3.1 M AS. See the text for details of sample preparation and analysis. Negative-ion mass spectrum obtained us-ing I−as the reagent ion.
ucts are not detected by this method unless they contain a terminal carboxylic acid group or neighboring hydroxyl groups (Sareen et al., 2010). Small acid species, such as formic, acetic and crotonic acid (172.7 (208.4), 186.4 and 230.7 amu, respectively), were detected. Hydrated acetalde-hyde (189.6 and 224.1 amu) and MG (216.3 amu), and hemi-acetal self-dimers of hemi-acetaldehyde and MG (230.7, 256.4, 264.4, 269.5, and 342.3) were also observed. 256.4 amu is consistent with a MG aldol condensation dimer product, and 272.2 amu could correspond either to a MG hemiacetal dimer or an aldol condensation product. 242.9 amu, I−·C5H8O3,
is consistent with an aldol condensation cross product of MG and acetaldehyde. 194.6 amu corresponds to C6H9O−6
(mechanism and structure unknown).
Note that several peaks appear at similar mass-to-charge ratios in the negative mode mass spectra of both the formaldehyde-MG and acetaldehyde-MG mixtures. MG self-reaction products are expected to be present in both systems. Beyond this, formaldehyde and acetaldehyde are structurally similar small molecules which follow similar oligomerization mechanisms alone and with MG. In several cases, peaks in the mass spectra corresponding to structurally distinct expected reaction products for each system have sim-ilar mass-to-charge ratios. For example, the formaldehyde hemiacetal 4-mer (I−·C4H10O5)and the acetaldehyde dimer
(I−·C4H6O3·2H2O) are both apparent at 264 amu.
4 Discussion
11624 Z. Li et al.: Surface tension depression and secondary organic products
Table 3. Proposed peak assignments for Aerosol-CIMS mass spectra with I− of atomized solutions of 2 M formaldehyde/MG (1:1) in 3.1 M AS.
solutions of 2 M formaldehyde/MG (1:1) in 3.1 M AS.
m/z (amu)± 1.0 amu Ion Formula
Molecular
Formula Possible Structures Mechanism
172.8 I-·CH2O2 CH2O2 Formic Acid
186.7 I-·C2H4O2 C2H4O2 cyclic F acetal
203.5 C5H11O6
-·2H2O C5H12O6 n=5 F hemiacetal
208.7 I-·CH2O2·2H2O CH2O2 Formic Acid
216.5 I-·C3H6O3 C3H6O3
Hydrated MG or cyclic F acetal
230.3 I-·C3H4O4 C3H4O4 n = 3 F hemiacetal
252.4
I-·C6H6O3 I-·C3H8O4·H2O I-·C3H6O3·2H2O
C6H6O3 C3H8O4 C3H6O3
MG aldol, n = 3 F hemiacetal,
Hydrated MG, or cyclic F acetal
257.4 C8H17O9
-C8H18O9 n=8 F hemiacetal
264.5 I-·C4H10O5 C4H10O5 n=4 F hemiacetal
I-·C6H10O4 C6H10O4
MG aldol and hemiacetal 272.2
I-·C5H6O5 C5H6O5
MG + 2F hemiacetal
288.1
I-·C6H10O5 I-·C6H8O4·H2O I-·C6H6O3·2H2O
C6H10O5 C6H8O4 C6H6O3
MG aldol and hemiacetal
314.3 I-·C5H12O5·2H2O C5H12O5
MG + 2F hemiacetal
324.5
I-·C6H14O7 I-·C6H12O6·H2O I-·C6H10O5·2H2O
C6H14O7 C6H12O6 C6H10O5
n=6 F hemiacetal, MG hemiacetal
342.6 I
-·C6H14O7·H2O I-·C6H12O6·2H2O
C6H14O7 C6H12O6
n=6 F hemiacetal, MG hemiacetal
O OH
Table 4.Proposed peak assignments for Aerosol-CIMS mass spectra with H3O+of atomized solutions of 0.5 M acetaldehyde/MG (1:1) in 3.1 M AS.
m/z (amu)
± 1.0 amu Ion Formula
Molecular
Formula Possible Structures Mechanism
84.4 CH3O2+·2H2O CH2O2 Formic Acid
C3H5O3+ C3H4O3 Pyruvic Acid
88.9
C4H7O+·H2O
C4H9O2+
C4H6O
C4H8O2
A aldol
93.5 C2H3O3+·H2O C2H2O3 Glyoxylic Acid
95.5 C2H5O3+·H2O C2H4O3 Glycolic Acid
98.4 C2H7O2+·2H2O C2H6O2 Hydrated A
C3H5O3+·H2O C3H4O3 Pyruvic Acid
107.2
C4H9O2+·H2O C4H8O2 A aldol
126.0 C7H9O2+ C7H8O2 MG + 2 A aldol
134.0 C5H11O4+·H2O C5H10O4 MG + A aldol
137.3 C5H11O3+·H2O C5H10O3 Unknown
145.1 C6H9O4
+
C6H7O3+·H2O
C6H8O4
C6H6O3
MG aldol
162.9 C6H11O5
+
C6H9O4+·H2O
C6H10O5
C6H8O4
MG hemiacetal and aldol
C6H13O5+ C6H12O5 MG aldol
164.7
C6H11O4+·H2O C6H10O4
MG hemiacetal and aldol
192.9 C12H15O+·H2O C12H14O 6 A aldol
206.7 C11H11O4+ C11H10O4 A + 3 MG aldol
235 C9H15O7+ C9H14O7 MG hemiacetal
248.9 C15H17O2+·H2O C15H16O2 1MG + 6 A aldol
289.6 C18H21O+·2H2O C18H20O 9 A aldol
297 C20H23O+·H2O C20H22O 10 A aldol
11626 Z. Li et al.: Surface tension depression and secondary organic products
Table 5. Proposed peak assignments for Aerosol-CIMS mass spectra with I− of atomized solutions of 2 M acetaldehyde/MG (1:1) in 3.1 M AS.
m/z (amu) ±
1.0 amu
Ion Formula
Molecular
Formula
Possible Structures
Mechanism
172.7
I
-·CH
2O
2I
-·C
2H
6O
CH
2O
2C
2H
6O
Formic Acid
186.4 I
-·C
2H
4O
2C
2H
4O
2Acetic Acid
189.6 I
-·C
2H
6O
2C
2H
6O
2Hydrated A
194.6
C
6H
9O
6-
C
2H
7O
6S
-·H
2O
C
6H
10O
6C
2H
8O
6S
Unknown Unknown
208.4 I
-·CH
2O
2·2H
2O
CH
2O
2Formic Acid
216.3 I
-·C
3H
6O
3C
3H
6O
3Hydrated MG
224.1 I
-·C
2H
6O
2·2H
2O C
2H
6O
2Hydrated A
I
-·C
4H
8O
3C
4H
8O
3A hemiacetal
230.7
I
-·C
4H
6O
2·H
2O C
4H
6O
2Crotonic
acid
242.9 I
-·C
5H
8O
3C
5H
8O
3MG + A aldol
256.4 I
-·C
6H
10O
3C
6H
10O
3MG aldol
264.4 I
-·C
4H
6O
3·2H
2O C
4H
6O
3A hemiacetal
269.5 I
-·C
4H
10O
3·2H
2O C
4H
10O
3A hemiacetal
272.2 I
-·C
6H
10O
4C
6H
10O
4MG aldol and
hemiacetal
342.3 I
-·C
6H
12O
6·2H
2O C
6H
12O
6MG hemiacetal
than in pure water. These differences for both organics are likely due to chemical and physical effects of “salting out” (Setschenow, 1889), which may enhance organic film for-mation on the surface of a pendant drop (or aerosol par-ticle). The salt promotes the formation of surface-active species: several of the reaction products in the AS systems identified using Aerosol-CIMS are known or expected to be surface-active, such as organosulfates (Nozi`ere et al., 2010b) and organic acids. Salts can also alter the partitioning of these volatile yet water-soluble organic species between the gas phase and aqueous solution. Formaldehyde has a small Henry’s Law constant of 2.5 M atm−1, although hydration in the aqueous phase leads to an effective Henry’s Law con-stant of 3×10³M atm−1, similar to that of MG (Betterton and Hoffmann, 1988; Seinfeld and Pandis, 1998). The ef-fective Henry’s Law constant for acetaldehyde in water at 25◦C was measured by Betterton and Hoffmann (1988) to
be 11.4 M atm−1. The Henry’s Law constant of
formalde-hyde was shown by Zhou and Mopper to increase slightly in aqueous solutions containing an increasing proportion of sea-water (up to 100 %), but the opposite is true for acetaldehyde (Zhou and Mopper, 1990). The reaction mixtures studied here equilibrated with the headspace of the closed container for 24 h before the surface tension measurements were per-formed. Each pendant drop equilibrated for 2 min before im-age capture, after which time there was no detectable change in drop shape. Some of the organics may be lost to the gas phase during equilibration. However, the lower volatility of the aqueous-phase reaction products, especially those formed through oligomerization, leads to significant organic material remaining in the condensed phase (enough to cause surface tension depression and be detected via Aerosol-CIMS).
When formaldehyde and acetaldehyde are present in com-bination with MG, as would likely happen in the atmosphere (Fung and Wright, 1990; Grosjean, 1982; Munger et al., 1995), there is a synergistic effect: surface tension depres-sion in the solutions containing mixed organics exceeds that predicted by an additive model based on the single-species isotherms. This effect could be due to the formation of more surface-active reaction products in the mixed systems. The deviation from the Henning model prediction was less than 10 % except in the case of the acetaldehyde-MG-AS mix-tures. Between 21–30 % of the detected product mass was identified as cross products in the Aerosol-CIMS positive mode analysis of the acetaldehyde-MG mixtures following (Schwier et al., 2010). Most of the oligomers identified in this system were aldol condensation products, which have fewer hydroxyl groups than acetal oligomers and are there-fore expected to be more hydrophobic. A number of organic acid products, likely to be surface-active, were also identified in the acetaldehyde-MG-AS system.
In contrast to the MG-glyoxal system, the presence of formaldehyde and/or acetaldehyde in aqueous MG-AS solu-tions does influence surface tension depression, in fact, to a greater extent than predicted by the Henning model.
How-ever, the results of the binary and ternary mixture experi-ments suggest that MG still plays a dominant role in these systems since the measured surface tension was remarkably similar in each mixture for a given MG concentration.
The formaldehyde hemiacetal dimer sulfate (C2H6O6S)
may form via the reaction of C2H6O3 with H2SO4 (Deno
and Newman, 1950) (see Supplement for detailed discus-sion and calculations). The equilibrium concentration of H2SO4 in our bulk solutions (3.1 M AS, pH = 3) is small
(2.8×10⁻⁷M). Minerath and coworkers showed that alco-hol sulfate ester formation is slow under tropospheric aerosol conditions (Minerath et al., 2008). Based on our obser-vations, assuming a maximum Aerosol-CIMS sensitivity of 100 Hz ppt−1to this species (Sareen et al., 2010) we infer a concentration of≥2×10⁻⁴M in the bulk solution after 24
h of reaction. Using our experimental conditions and the kinetics of ethylene glycol sulfate esterification from Min-erath et al., we predict a maximum concentration of 7×10⁻⁸
M. This disagreement between model and experiment sug-gests that either (a) the kinetics of sulfate esterification for paraformaldehyde are significantly faster than for alcohols (b) SO−42or HSO−4 is the active reactant, contrary to the con-clusions of Deno and Newman, or (c) sulfate esterification is enhanced by the solution dehydration that accompanies the atomization and volatilization steps in our detection tech-nique. Photochemical production of organosulfates has also been observed (Galloway et al., 2009; Nozi`ere et al., 2010b; Perri et al., 2010). Our samples were protected from UV light by the Pyrex reaction vessels, and no significant OH source was present, so we do not expect photochemical organosul-fate production to be efficient in this system.
Nitrogen-containing compounds could also be formed in these reaction mixtures due to the presence of the ammo-nium ion (Galloway et al., 2009; Nozi`ere et al., 2009; Sareen et al., 2010). No unambiguous identifications of C-N con-taining products were made in this study, but analysis using a mass spectrometry technique with higher mass resolution could reveal their presence.
Ambient aerosol concentrations of formaldehyde and ac-etaldehyde have been measured up to 0.26 µg m−3 formalde-hyde and 0.4 µg m−3acetaldehyde in Los Angeles (Grosjean, 1982). Using a dry aerosol mass of 50 µg m−3, at a relative humidity of 80 % (with a mass ratio of water:solute of 1), these ambient in-particle concentrations of formaldehyde and acetaldehyde correspond to 0.17 and 0.18 mol (kg H2O)−1 ,
respectively, which are within the concentration ranges used in this study. At these realistic concentrations, we observed non-negligible surface tension depression by formaldehyde and acetaldehyde (8.8 % and 12.1 %, respectively). How-ever, if we assume a relative humidity of 99 %, relevant for cloud droplet activation, the mass ratio of water:solute in-creases to 35, so the in-particle concentrations correspond to 0.0049 and 0.0052 mol (kg H2O)−1, respectively, which are
11628 Z. Li et al.: Surface tension depression and secondary organic products aerosol phase in experiments, which was our intent here
(Er-vens et al., 2011; Sareen et al., 2010; Tan et al., 2009, 2010). Furthermore, the extended concentration range used here was chosen to enable us to characterize the surface tension behav-ior using the Szyszkowski-Langmuir equation.
The relatively small Henry’s Law partitioning of formalde-hyde and acetaldeformalde-hyde to water suggests that their potential to contribute to total SOA mass is low as compared to highly soluble species such as glyoxal. This is supported by the ob-servations of Kroll et al. (2005) that AS aerosols exposed to formaldehyde in an aerosol reaction chamber did not result in significant particle volume growth. However, recent studies have indicated that aldehydes partition into the aqueous par-ticle phase more than predicted by Henry’s Law (Baboukas et al., 2000; Grosjean, 1982; Healy et al., 2008); this is hypothesized to be a hydration equilibrium shift (Yu et al., 2011). Grosjean et al. determined that in-particle concentra-tions were up to 3 orders of magnitude higher for formalde-hyde than those predicted by Henry’s Law (using an aerosol mass 150 µg m−3 and 15 % water content). Additionally, formaldehyde and acetaldehyde in the gas phase could ad-sorb at the aerosol surface (vs. bulk aqueous absorption), and this may also impact aerosol surface tension (Donaldson and Vaida, 2006). Furthermore, Romakkaniemi and coworkers recently showed significant enhancement of aqueous-phase SOA production by surface-active species when OH oxi-dation is also occurring, beyond what would be predicted based on Henry’s Law due to surface-bulk partitioning (Ro-makkaniemi et al., 2011).
5 Conclusions
Two highly volatile organic compounds, formaldehyde and acetaldehyde, were found to form secondary organic prod-ucts in aqueous ammonium sulfate (AS) solutions mimick-ing tropospheric aerosols. These species, and their aqueous-phase reaction products, lead to depressed surface tension in the aqueous solutions. This adds to the growing body of ev-idence that VOCs are a secondary source of surface-active organic material in aerosols.
Supplementary material related to this article is available online at:
http://www.atmos-chem-phys.net/11/11617/2011/ acp-11-11617-2011-supplement.pdf.
Acknowledgements. This work was funded by the NASA Tropo-spheric Chemistry program (Grant NNX09AF26G) and the ACS Petroleum Research Fund (Grant 48788-DN14). The authors grate-fully acknowledge the Koberstein group at Columbia University for use of the pendant drop tensiometer.
Edited by: B. Ervens
References
Adamson, A. W. and Gast, A. P., Physical chemistry of surfaces, Wiley, New York, 1997.
Baboukas, E. D., Kanakidou, M., and Mihalopoulos, N.: Car-boxylic acids in gas and particulate phase above the Atlantic Ocean, J. Geophys. Res., 105, 14459–14471, 2000.
Betterton, E. A. and Hoffmann, M. R.: Henry Law Constants of Some Environmentally Important Aldehydes, Environ. Sci. Technol., 22, 1415–1418, 1988.
Casale, M. T., Richman, A. R., Elrod, M. J., Garland, R. M., Beaver, M. R., and Tolbert, M. A.: Kinetics of acid-catalyzed aldol con-densation reactions of aliphatic aldehydes, Atmos. Environ., 41, 6212–6224, 2007.
Deno, N. C. and Newman, M. S.: Mechanism of Sulfation of Alco-hols, J. Am. Chem. Soc., 72, 3852–3856, 1950.
Djikaev, Y. S. and Tabazadeh, A.: Effect of adsorption on the uptake of organic trace gas by cloud droplets, J. Geophys. Res.-Atmos., 108, 4869, doi:10.1029/2003JD003741, 2003.
Donaldson, D. J. and Vaida, V.: The influence of organic films at the air-aqueous boundary on atmospheric processes, Chem. Rev., 106, 1445–1461, 2006.
Ervens, B. and Volkamer, R.: Glyoxal processing by aerosol multi-phase chemistry: towards a kinetic modeling framework of sec-ondary organic aerosol formation in aqueous particles, Atmos. Chem. Phys., 10, 8219–8244, doi:10.5194/acp-10-8219-2010, 2010.
Ervens, B., Turpin, B. J., and Weber, R. J.: Secondary or-ganic aerosol formation in cloud droplets and aqueous parti-cles (aqSOA): a review of laboratory, field and model stud-ies, Atmos. Chem. Phys., 11, 11069–11102, doi:10.5194/acp-11-11069-2011, 2011.
Facchini, M. C., Mircea, M., Fuzzi, S., and Charlson, R. J.: Cloud albedo enhancement by surface-active organic solutes in growing droplets, Nature, 401, 257–259, 1999.
Folkers, M., Mentel, T. F., and Wahner, A.: Influence of an organic coating on the reactivity of aqueous aerosols probed by the het-erogeneous hydrolysis of N2O5, Geophys. Res. Lett., 30, 1644– 1647, 2003.
Fung, K. and Wright, B.: Measurement of Formaldehyde and Ac-etaldehyde using 2,4-dinitrophenylhydrazine-impregnated car-tridges during the carbonaceous species methods comparison study, Aerosol Sci. Technol., 12, 44–48, 1990.
Galloway, M. M., Chhabra, P. S., Chan, A. W. H., Surratt, J. D., Flagan, R. C., Seinfeld, J. H., and Keutsch, F. N.: Glyoxal up-take on ammonium sulphate seed aerosol: reaction products and reversibility of uptake under dark and irradiated conditions, At-mos. Chem. Phys., 9, 3331–3345, doi:10.5194/acp-9-3331-2009, 2009.
Grosjean, D.: Formaldehyde and other carbonyl in Los Angeles am-bient air, Environ. Sci. Technol., 16, 254–262, 1982.
Healy, R. M., Wenger, J. C., Metzger, A., Duplissy, J., Kalberer, M., and Dommen, J.: Gas/particle partitioning of carbonyls in the photooxidation of isoprene and 1,3,5-trimethylbenzene, At-mos. Chem. Phys., 8, 3215–3230, doi:10.5194/acp-8-3215-2008, 2008.
Jimenez, J. L., Canagaratna, M. R., Donahue, N. M., Prevot, A. S. H., Zhang, Q., Kroll, J. H., DeCarlo, P. F., Allan, J. D., Coe, H., Ng, N. L., Aiken, A. C., Docherty, K. S., Ulbrich, I. M., Grieshop, A. P., Robinson, A. L., Duplissy, J., Smith, J. D., Wil-son, K. R., Lanz, V. A., Hueglin, C., Sun, Y. L., Tian, J., Laak-sonen, A., Raatikainen, T., Rautiainen, J., Vaattovaara, P., Ehn, M., Kulmala, M., Tomlinson, J. M., Collins, D. R., Cubison, M. J., Dunlea, E. J., Huffman, J. A., Onasch, T. B., Alfarra, M. R., Williams, P. I., Bower, K., Kondo, Y., Schneider, J., Drewnick, F., Borrmann, S., Weimer, S., Demerjian, K., Salcedo, D., Cot-trell, L., Griffin, R., Takami, A., Miyoshi, T., Hatakeyama, S., Shimono, A., Sun, J. Y., Zhang, Y. M., Dzepina, K., Kimmel, J. R., Sueper, D., Jayne, J. T., Herndon, S. C., Trimborn, A. M., Williams, L. R., Wood, E. C., Middlebrook, A. M., Kolb, C. E., Baltensperger, U., and Worsnop, D. R.: Evolution of Organic Aerosols in the Atmosphere, Science, 326, 1525–1529, 2009. Kanakidou, M., Seinfeld, J. H., Pandis, S. N., Barnes, I., Dentener,
F. J., Facchini, M. C., Van Dingenen, R., Ervens, B., Nenes, A., Nielsen, C. J., Swietlicki, E., Putaud, J. P., Balkanski, Y., Fuzzi, S., Horth, J., Moortgat, G. K., Winterhalter, R., Myhre, C. E. L., Tsigaridis, K., Vignati, E., Stephanou, E. G., and Wilson, J.: Organic aerosol and global climate modelling: a review, At-mos. Chem. Phys., 5, 1053–1123, doi:10.5194/acp-5-1053-2005, 2005.
K¨ohler, H.: The nucleus in the growth of hygroscopic droplets, Trans. Faraday Soc., 32, 1152–1161, 1936.
Kroll, J. H., Ng L. N., Murphy, S. M., Varutbangkul, V., Fla-gan, R. C., and Seinfeld, J. H.: Chamber studies of sec-ondary organic aerosol growth by reactive uptake of sim-ple carbonyl compounds, J. Geophys. Res., 110, D23207, doi:10.1029/2005JD006004, 2005.
Lim, Y. B., Tan, Y., Perri, M. J., Seitzinger, S. P., and Turpin, B. J.: Aqueous chemistry and its role in secondary organic aerosol (SOA) formation, Atmos. Chem. Phys., 10, 10521– 10539, doi:10.5194/acp-10-10521-2010, 2010.
Loudon, G. M.: Organic chemistry, Roberts and Co, Greenwood Village, Colo, 2009.
McNeill, V. F., Patterson, J., Wolfe, G. M., and Thornton, J. A.: The effect of varying levels of surfactant on the reactive uptake of N2O5to aqueous aerosol, Atmos. Chem. Phys., 6, 1635–1644, doi:10.5194/acp-6-1635-2006, 2006.
Minerath, E. C., Casale, M. T., and Elrod, M. J.: Kinetics feasibility study of alcohol sulfate esterification reactions in tropospheric aerosols, Environ. Sci. Technol., 42, 4410—4415, 2008. Munger, J. W., Jacob, D. J., Daube, B. C., Horowitz, L. W., Keene,
W. C., and Heikes, B. G.: Formaldehyde, glyoxal, and methyl-glyoxal in air and cloudwater at a rural mountain site in central Virginia, J. Geophys. Res., 100, 9325–9333, 1995.
Nozi`ere, B., Dziedzic, P., and C´ordova, A.: Products and Kinetics of the Liquid-Phase Reaction of Glyoxal Catalyzed by Ammonium Ions (NH4+), J. Phys. Chem. A, 113, 231–237, 2009.
Nozi`ere, B., Dziedzic, P., and C´ordova, A.: Inorganic ammonium salts and carbonate salts are efficient catalysts for aldol conden-sation in atmospheric aerosols, Phys. Chem. Chem. Phys., 12, 3864–3872, 2010a.
Nozi`ere, B., Ekstr¨om, S., Alsberg, T., and Holmstr¨om, S.: Radical-initiated formation of organosulfates and surfactants in atmospheric aerosols, Geophys. Res. Lett., 37, L05806, doi:10.1029/2009GL041683, 2010b.
Perri, M. J., Lim, Y. B., Seitzinger, S. P., and Turpin, B. J.: Organosulfates from glycolaldehyde in aqueous aerosols and clouds: Laboratory studies, Atmos. Environ., 44, 2658–2664, 2010.
Romakkaniemi, S., Kokkola, H., Smith, J. N., Prisle, N. L., Schwier, A. N., McNeill, V. F., and Laaksonen, A.: Par-titioning of Semivolatile Surface-Active Compounds Between Bulk, Surface, and Gas-Phase, Geophys. Res. Lett., 38, L03807, doi:10.1029/2010GL046147, 2011.
Sareen, N., Schwier, A. N., Shapiro, E. L., Mitroo, D., and McNeill, V. F.: Secondary organic material formed by methylglyoxal in aqueous aerosol mimics, Atmos. Chem. Phys., 10, 997–1016, doi:10.5194/acp-10-997-2010, 2010.
Schwier, A. N., Sareen, N., Mitroo, D. M., Shapiro, E. L., and McNeill, V. F.: Glyoxal-Methylglyoxal Cross-Reactions in Sec-ondary Organic Aerosol Formation, Environ. Sci. Technol., 44, 6174–6182, 2010.
Seinfeld, J. H. and Pandis, S. N.: Atmospheric chemistry and physics from air pollution to climate change, Wiley, New York, 1998.
Setschenow, J. Z.: Uber Die Konstitution Der Salzosungen auf Grund ihres Verhaltens zu Kohlensaure, Z. Phys. Chem., 4, 117– 125, 1889.
Shapiro, E. L., Szprengiel, J., Sareen, N., Jen, C. N., Giordano, M. R., and McNeill, V. F.: Light-absorbing secondary organic mate-rial formed by glyoxal in aqueous aerosol mimics, Atmos. Chem. Phys., 9, 2289–2300, doi:10.5194/acp-9-2289-2009, 2009. Shulman, M. L., Jacobson, M. C., Carlson, R. J., Synovec, R. E.,
and Young, T. E.: Dissolution behavior and surface tension ef-fects of organic compounds in nucleating cloud droplets, Geo-phys. Res. Lett., 23, 277–280, 1996.
Tan, Y., Perri, M. J., Seitzinger, S. P., and Turpin, B. J.: Effects of Precursor Concentration and Acidic Sulfate in Aqueous Glyoxal-OH Radical Oxidation and Implications for Secondary Organic Aerosol, Environ. Sci. Technol., 43, 8105–8112, 2009.
Tan, Y., Carlton, A. G., Seitzinger, S. P., and Turpin, B. J.: SOA from methylglyoxal in clouds and wet aerosols: Measurement and prediction of key products, Atmos. Environ., 44, 5218–5226, 2010.
Wang, X. F., Gao, S., Yang, X., Chen, H., Chen, J. M., Zhuang, G. S., Surratt, J. D., Chan, M. N., and Seinfeld, J. H.: Evidence for High Molecular Weight Nitrogen-Containing Organic Salts in Urban Aerosols, Environ. Sci. Technol., 44, 4441–4446, 2010. Yu, G., Bayer, A. R., Galloway, M. M., Korshavn, K. J., Fry, C.
G., and Keutsch, F. N.: Glyoxal in Aqueous Ammonium Sulfate Solutions: Products, Kinetics and Hydration Effects, Environ. Sci. Technol., 45, 6336–6342, 2011.