www.atmos-chem-phys.net/16/5171/2016/ doi:10.5194/acp-16-5171-2016
© Author(s) 2016. CC Attribution 3.0 License.
Seasonal characterization of submicron aerosol chemical
composition and organic aerosol sources in the
southeastern United States: Atlanta, Georgia,
and Look Rock, Tennessee
Sri Hapsari Budisulistiorini1, Karsten Baumann2, Eric S. Edgerton2, Solomon T. Bairai3, Stephen Mueller4, Stephanie L. Shaw5, Eladio M. Knipping6, Avram Gold1, and Jason D. Surratt1
1Department of Environmental Sciences and Engineering, Gillings School of Global Public Health,
The University of North Carolina at Chapel Hill, Chapel Hill, NC, USA
2Atmospheric Research & Analysis, Inc., Cary, NC, USA 3Battelle, Pueblo, CO, USA
4Ensafe, Nashville, TN, USA
5Electric Power Research Institute, Palo Alto, CA, USA 6Electric Power Research Institute, Washington, DC, USA
Correspondence to:J. D. Surratt ([email protected])
Received: 29 July 2015 – Published in Atmos. Chem. Phys. Discuss.: 20 August 2015 Revised: 13 April 2016 – Accepted: 17 April 2016 – Published: 26 April 2016
Abstract. A year-long near-real-time characterization of non-refractory submicron aerosol (NR-PM1)was conducted
at an urban (Atlanta, Georgia, in 2012) and rural (Look Rock, Tennessee, in 2013) site in the southeastern US using the Aerodyne Aerosol Chemical Speciation Monitor (ACSM) collocated with established air-monitoring network measure-ments. Seasonal variations in organic aerosol (OA) and in-organic aerosol species are attributed to meteorological con-ditions as well as anthropogenic and biogenic emissions in this region. The highest concentrations of NR-PM1were
ob-served during winter and fall seasons at the urban site and during spring and summer at the rural site. Across all seasons and at both sites, NR-PM1was composed largely of OA (up
to 76 %) and sulfate (up to 31 %). Six distinct OA sources were resolved by positive matrix factorization applied to the ACSM organic mass spectral data collected from the two sites over the 1 year of near-continuous measurements at each site: hydrocarbon-like OA (HOA), biomass burn-ing OA (BBOA), semi-volatile oxygenated OA (SV-OOA), low-volatility oxygenated OA (LV-OOA), isoprene-derived epoxydiols (IEPOX) OA (IEPOX-OA) and 91Fac (a factor dominated by a distinct ion at m/z91 fragment ion previ-ously observed in biogenic influenced areas). LV-OOA was
1 Introduction
Characterization of the chemical composition of atmospheric fine aerosol is important, because of its adverse human health effects (Pope III and Dockery, 2006) and possible impacts on the Earth’s climate system (Forster et al., 2007). Aerosol with aerodynamic diameters ≤1 µm (PM1)plays a
signif-icant role in scattering and/or absorbing solar radiation as well as cloud formation (IPCC, 2013). Long-term regional characterizations of ambient PM1are required to understand
its sources, formation and aging mechanisms, as well as at-mospheric lifetime. This information will lead to more accu-rately constrained air quality models for making regulatory decisions to mitigate the potential adverse impacts of PM1.
Over the past decade, online aerosol mass spectrometry (AMS) has been used to extensively characterize ambient non-refractory (NR)-PM1 (Zhang et al., 2007; Jimenez et
al., 2009; Ng et al., 2010; Crippa et al., 2014); however, prior studies were limited by short measurement periods (weeks to a several months) because the need for intensive instrument maintenance required the continuous on-site pres-ence of skilled personnel in order to generate high-quality data. The Aerodyne Aerosol Chemical Speciation Monitor (ACSM) based on the AMS technology has been modified to allow for long-term operation with less maintenance (Ng et al., 2011b). The ACSM has been recently used for long-term NR-PM1measurements (Petit et al., 2015; Ripoll et al.,
2015; Parworth et al., 201; Zhang et al., 2015) and shown to be durable and data are comparable to data collected from existing fine aerosol monitoring networks (Budisulistiorini et al., 2014).
Worldwide studies have shown that tropospheric PM1
mass is dominated by organic aerosol (OA; Zhang et al., 2007; Jimenez et al., 2009). OA consists of aerosol di-rectly emitted into the atmosphere, primary organic aerosol (POA) and aerosol formed from atmospheric oxidation of volatile organic compounds (VOCs), secondary organic aerosol (SOA). POA sources include fossil fuel combus-tion from vehicles, power generacombus-tion, and residential burning (cooking and heating) as well as forest fires (Kanakidou et al., 2005). Contribution of hydrocarbon-like OA (HOA) as-sociated with POA to urban OA mass may be significant dur-ing morndur-ing traffic, while oxygenated OA (OOA) associated with SOA exceeds POA at midday or in the afternoon (Zhang et al., 2005). SOA has been observed to contribute upwards of 90 % to the total OA mass (Docherty et al., 2008), indi-cating the critical role of photochemical processes in SOA formation.
Studies in Atlanta, Georgia, have characterized the chemi-cal components of ambient aerosol collected during differ-ent seasons (Lee et al., 2002; Kim et al., 2003; Butler et al., 2003); however, they were limited by low time or mass resolution. A recent study reported characterization of am-bient NR-PM1by high-resolution time-of-flight AMS
(HR-ToF-AMS) from multiple sites in Georgia, including Atlanta,
Table 1.Seasonal classification of measurements at JST and LRK is based on direction of angle of the Earth to the sun and the angle of the sunlight as it hits the Earth.
JST LRK
Winter 22/12/2011–19/03/2012 18/01/2013–19/03/2013 Spring 20/03/2012–19/06/2012 20/03/2013–31/05/2013 Summer 20/06/2012–21/09/2012 01/06/2013–21/09/2013∗
Fall 22/09/2012–20/12/2012 22/09/2013–20/12/2013 ∗Measurements in summer at the LRK site included in the 2013 SOAS campaign from
1 June to 17 July 2013.
but was limited by 1-month measurement periods at each site (Xu et al., 2015a). Non-fossil carbon derived from mod-ern sources (e.g., biogenic) is reported to account for 50 % of carbon at two urban sites and 70–100 % of carbon at 10 near-urban or remote sites in the US (Schichtel et al., 2008). Additionally, isoprene-derived SOA was recently ob-served to contribute substantially to SOA in downtown At-lanta during summer (Budisulistiorini et al., 2013; Xu et al., 2015a, b). The isoprene-derived SOA was attributed to the heterogeneous chemistry of isomeric isoprene epoxydi-ols (IEPOX), known oxidation products of isoprene under both low- (Paulot et al., 2009) and high-NO (Jacobs et al., 2014) conditions, in the presence of acidic sulfate aerosol (Budisulistiorini et al., 2013).
Biogenic hydrocarbons and their oxidation products are major contributors to ambient fine aerosol in rural areas where anthropogenic sources are low (Budisulistiorini et al., 2015). In summer 2001, the fraction of non-fossil carbon was reported to vary from 66 to 80 % of total carbon at Look Rock (LRK), Great Smoky Mountains National Park (GSMNP), Tennessee (TN), indicating the likely importance of photo-chemical oxidation of biogenic VOCs (BVOCs; Tanner et al., 2004a). Sulfate did not show significant diurnal variabil-ity at LRK, TN, suggesting that local meteorological con-ditions are less influential in determining concentrations of long-lived species (Tanner et al., 2005). SOA is a predomi-nant component of PM2.5mass during summer and early fall
but POA is more dominant in the late fall (Ke et al., 2007), suggesting that the LRK site is influenced by biogenic and anthropogenic emissions.
We present a 2-year study comparing near-real-time chem-ical characterizations of NR-PM1collected for 1-year at the
urban Jefferson Street (JST) site in downtown Atlanta, Geor-gia (GA), and a subsequent year at the rural LRK site lo-cated in the GSMNP, TN. NR-PM1was sampled, chemically
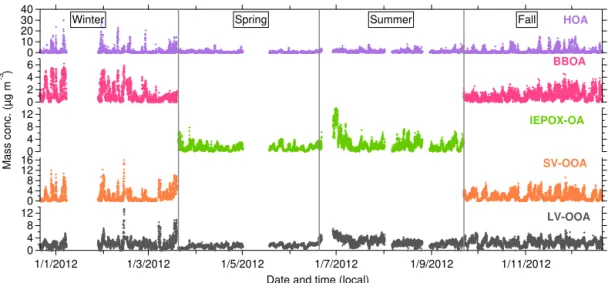
Figure 1.Annual temporal variations of OA and inorganic species (µg m−3)measured at the Jefferson Street (JST) site, Atlanta,
Geor-gia, in 2012. Included in the plots are ambient temperature (◦C) and
relative humidity (RH, in %) measured by SEARCH network, as well as pH and liquid water content (LWC, in mol L−1)estimated
by ISORROPIA-II.
2 Methods
2.1 Fine aerosol sampling and data analysis
Real-time continuous chemical measurements were con-ducted during 2012 at a downtown urban site (JST) in At-lanta, GA, and during 2013 at a rural/forested site (LRK) in GSMNP, TN, respectively. Analysis of data obtained from measurements at JST and LRK was classified by season (Ta-ble 1), which was a(Ta-ble to capture changes in meteorology, in particular ambient temperature, at JST in 2012 and LRK in 2013 as illustrated in Figs. 1 and 2. The period with the cold-est temperatures is classified as the winter season, and when the temperature rises, the period is classified as the spring season. Summer season is signified by constant high temper-ature at the JST and LRK sites. When tempertemper-ature decreases after summer, this period is categorized as the fall season.
Organic and inorganic species characterizations during the 2013 Southern Oxidant Aerosol Study (SOAS; Budisulis-tiorini et al., 2015) were included in analysis of the sum-mer season at the LRK site in this study. Detailed descrip-tions of both sites have been published (Budisulistiorini et al., 2013, 2015). Briefly, the JST site is one of several re-search sites of the Southeastern Aerosol Rere-search and Char-acterization (SEARCH) network. The JST site is located in a mixed industrial-residential area about 4.2 km northwest of downtown Atlanta and within approximately 200 m of a bus maintenance yard and several warehouse facilities to the south and southwest (Hansen et al., 2003; Solomon et al., 2003), and within 53 km of a coal-fired power plant (Plant Bowen; Edgerton et al., 2006). The LRK site is located on a ridge top on the northwestern edge of the GSMNP
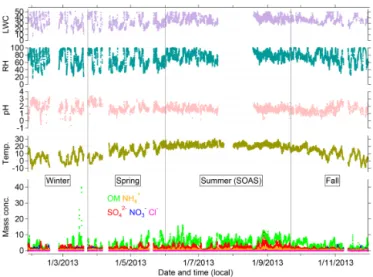
down-Figure 2.Annual temporal variations of OA and inorganic species (µg m−3)measured at the Look Rock (LRK) site, Great Smoky
Mountains, Tennessee, in 2013. Included in the plots are ambi-ent temperature and RH (%) measured by Tennessee Valley Au-thority (TVA), as well as pH and LWC (mol L−1)estimated by
ISORROPIA-II.
wind of urban areas, such as Knoxville and Maryville, TN, and small farms with animal grazing areas. Coal-fired power plants Kingston and Bull Run are located within 50–60 km northwest of LRK site (Tennessee Valley Authority, 2015). In summer, up-slope flow carries pollutants emitted in the val-ley during early morning to the LRK site by mid-morning, and in the evening down-slope flow accompanies a shift of wind direction to the south and east that could isolate the site from fresh primary emissions from the valley and allows aged secondary species to accumulate (Tanner et al., 2005).
Ambient NR-PM1 was analyzed using the Aerodyne
ACSM in a similar manner at both sites. Details of NR-PM1
sampling at the JST and LRK sites have been described in Budisulistiorini et al. (2013, 2015). Briefly, the ACSM was operated with a sampling flow rate of 3 L min−1, resulting in
a residence time of < 2 s for PM2.5in the sampling line. The
aerodynamic lens mounted on the ACSM inlet continuously samples PM1from the bypass PM2.5sampling line (Ng et al.,
2011b). Particle-laden air was dried using a 50-tube Nafion dryer (Perma Pure PD-50T-24SS) in which a dry-air system delivered 7 L min−1of dry sheath air to keep the sample air
relative humidity (RH) well below 10 %, preventing conden-sation within the sampling line that could adversely affect the collection efficiency (CE) of PM1and clog the ACSM
2015). We estimated dry density of ambient PM1 based on
average particle composition for each season, and the as-sumption of organic, inorganic and elemental carbon (EC) densities are 1.4 (Hallquist et al., 2009), 1.77 (Turpin and Lim, 2001), and 1.77 g cm−3(Park et al., 2004), respectively.
The estimated dry aerosol densities at both the JST and LRK sites are 1.55 g cm−3 on average (Table S1 in the
Supple-ment), which is about 13 % less than the density of 1.75 at JST (Budisulistiorini et al., 2014) and similar to the density of 1.52 g cm−3at LRK (Budisulistiorini et al., 2015) during
summer. If a CE of 1 was applied to JST and LRK data sets, the estimated aerosol density is < 1 g cm−3, which is much
lower than the suggested organic of 1.4 g cm−3 (Hallquist
et al., 2009) and inorganic aerosol density of 1.77 g cm−3
(Cross et al., 2007). Therefore, we applied a CE value of 0.5 to all seasonal data sets.
2.2 Organic aerosol characterization by PMF
Details of PMF analysis of the organic mass fraction have been described previously (Lanz et al., 2007; Ulbrich et al., 2009; Zhang, 2011). The PMF2 algorithm (Paatero and Tap-per, 1994) was used in robust mode via PMF Evaluation Tool panel (PET v2.04) using the methods outlined in Ulbrich et al. (2009) and Zhang et al. (2011). Only the mass range
m/z12–120 was utilized for PMF because no organic frag-ment ions are possible atm/z< 12 and low transmission
ef-ficiency for ions with m/z> 120 (Ng et al., 2011b), which
results in low signal-to-noise ratios as well as possible inter-ference from naphthalene calibrant atm/z128.
PMF analysis of year-long data collected from JST and LRK yielded similar factor solutions as those obtained from seasonal data, but showed additional factor splitting that made solid identification of unique factors difficult. There-fore, we present results from PMF analysis performed sepa-rately for winter, spring, summer and fall seasons for the JST and LRK sites. Solutions were chosen based on the qual-ity of PMF fits as well as interpretabilqual-ity when compared to reference mass spectra (Ng et al., 2011a; Robinson et al., 2011) and independent gas- and particle-phase measure-ments (Budisulistiorini et al., 2013, 2015). For each analy-sis, uncertainty of selected factor solutions was investigated with different seeds (seed parameter varied from 0 to 100, in steps of 5), FPEAK parameters, and 100 bootstrapping runs. PMF analysis of each season is detailed in Figs. S1– S24 in the Supplement and correlations of selected PMF fac-tors with external tracers and reference mass spectra are pro-vided in Tables S2–S3.Q/Qexp from PMF analysis of JST
data for all four seasons is 2.2–2.9, indicating that the er-rors are somewhat underestimated (Ulbrich et al., 2009). This could be due to some missing data points and the lack of dis-tinct time series during nighttime due to atmospheric stability and limitation of ACSM measurements (not high-resolution), such as observed by Guha et al. (2015).Q/Qexp from PMF
analysis of LRK data for all four seasons is between 0.15–
0.28, suggesting that the errors are overestimated (Ulbrich et al., 2009). However, the error values are deemed appropriate sinceQ/Qexpis consistently less than unity, regardless of the
number of factors and the data sets.
2.3 Estimation of aerosol acidity by ISORROPIA The thermodynamic model, ISORROPIA-II, in forward mode (Fountoukis and Nenes, 2007; Nenes et al., 1999), was used to estimate aerosol pH. Inputs for the model include aerosol-phase sulfate, nitrate, and ammonium as µmol m−3,
measured by the ACSM under ambient conditions. In addi-tion, RH and temperature obtained from the SEARCH net-work and the National Park Service (NPS) for JST and LRK sites, respectively, were used as inputs. Inputs of gas-phase ammonia for the JST site were obtained from SEARCH and for the LRK site, from the Ammonia Monitoring Net-work (AMoN, TN01/Great Smoky Mountains National Park – Look Rock). ISORROPIA-II predicted particle hydro-nium ion concentration per volume of air (H+, µg m−3)and
aerosol liquid water content (LWC, mol L−1). Calculation
of aerosol pH follows that of Eq. (1) in Budisulistiorini et al. (2015).
3 Results
Seasonally averaged NR-PM1 was typically higher at JST
in 2012 (6–13 µg m−3) compared to LRK in 2013 (5–
8 µg m−3), especially during colder seasons (fall and
win-ter; Table 2). However, during warmer seasons (spring and summer) the average NR-PM1 concentrations were similar
at both sites. The highest average seasonal concentration of NR-PM1at JST was observed during the fall (12.5 µg m−3),
whereas the summer season yielded the highest average NR-PM1concentration at the LRK site (8.4 µg m−3). These
pat-terns correspond to OA and sulfate seasonal trends, suggest-ing the important roles of these species to total NR-PM1mass
at urban and rural sites across the southeastern US (Tanner et al., 2015; Xu et al., 2015a).
3.1 Submicron aerosol chemical composition
At the LRK site, average OA loadings increased from spring (3.2 µg m−3)to summer (5.3 µg m−3), and then decreased in
fall (2.8 µg m−3), which is likely related to BVOC emissions
that depend on leaf surface area, solar radiation and ambient temperature (Fig. 2; Guenther et al., 2006). A different pat-tern was observed at the urban site (Fig. 1), where average OA loadings were highest during the fall (8.2 µg m−3)
fol-lowed by winter (7.2 µg m−3), suggesting contributions from
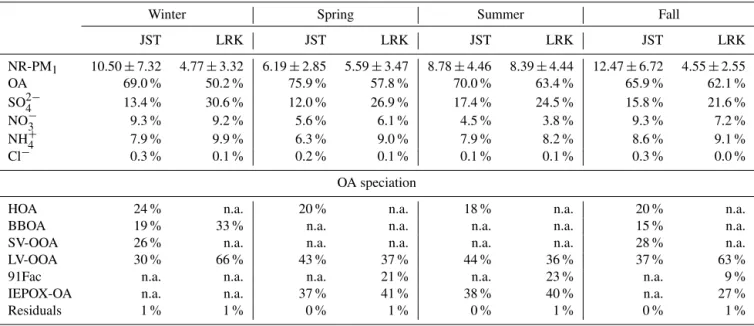
meteo-Table 2.Seasonal averaged mass concentrations of non-refractory PM1(NR-PM1)in µg m−3, percent contributions of organic and inorganic
species measured by the Aerodyne ACSM and PMF factors resolved from Atlanta, GA (JST site), and Look Rock, TN (LRK site), during 2012 and 2013.
Winter Spring Summer Fall
JST LRK JST LRK JST LRK JST LRK
NR-PM1 10.50±7.32 4.77±3.32 6.19±2.85 5.59±3.47 8.78±4.46 8.39±4.44 12.47±6.72 4.55±2.55 OA 69.0 % 50.2 % 75.9 % 57.8 % 70.0 % 63.4 % 65.9 % 62.1 % SO2−
4 13.4 % 30.6 % 12.0 % 26.9 % 17.4 % 24.5 % 15.8 % 21.6 %
NO−3 9.3 % 9.2 % 5.6 % 6.1 % 4.5 % 3.8 % 9.3 % 7.2 % NH+
4 7.9 % 9.9 % 6.3 % 9.0 % 7.9 % 8.2 % 8.6 % 9.1 %
Cl− 0.3 % 0.1 % 0.2 % 0.1 % 0.1 % 0.1 % 0.3 % 0.0 %
OA speciation
HOA 24 % n.a. 20 % n.a. 18 % n.a. 20 % n.a. BBOA 19 % 33 % n.a. n.a. n.a. n.a. 15 % n.a. SV-OOA 26 % n.a. n.a. n.a. n.a. n.a. 28 % n.a. LV-OOA 30 % 66 % 43 % 37 % 44 % 36 % 37 % 63 % 91Fac n.a. n.a. n.a. 21 % n.a. 23 % n.a. 9 % IEPOX-OA n.a. n.a. 37 % 41 % 38 % 40 % n.a. 27 % Residuals 1 % 1 % 0 % 1 % 0 % 1 % 0 % 1 %
n.a. denotes values not available or resolved from PMF analysis. PMF analysis yielded some residuals of unresolved OA mass that make up the remaining percentage of OA factors.
rology. Average OA contributions to NR-PM1 were higher
in spring and summer at JST and LRK, suggesting that bio-genic SOA plays a significant role during these periods. OA characterization is further discussed in Sect. 3.2.
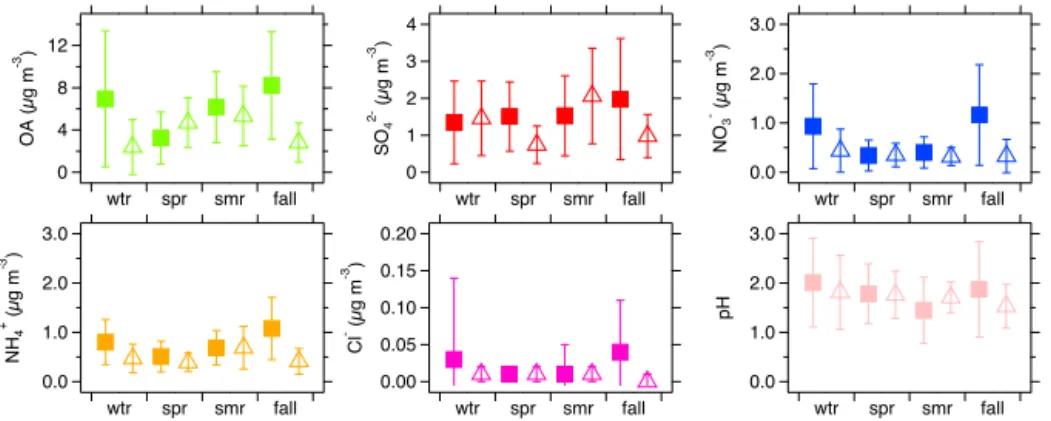
Average sulfate concentrations were highest in summer for LRK (2.1 µg m−3)and fall for JST (∼2 µg m−3; Fig. 3). This
suggests that sulfate may contribute to enhanced SOA for-mation in this region (Lin et al., 2013a; Xu et al., 2015b; Budisulistiorini et al., 2015). Changes in sulfate concentra-tion at LRK were mainly affected by changes in SO2
emis-sions from electrical-generating units in the region (Tanner et al., 2015). At JST, sulfate measurements are lower but still within a standard deviation of those measured by HR-ToF-AMS in May and July 2012 in Atlanta (Xu et al., 2015a). SO2
emissions from coal-fired power plants nearby Atlanta con-tributed to spatial variability of sulfate concentration (Peltier et al., 2007). The average contribution of sulfate to NR-PM1
loading was quite significant throughout the year, ranging from 12 to 17 % at JST and from 21 to 31 % at LRK (Table 2). Average concentrations of ammonium and nitrate were < 1 JST and < 0.5 µg m−3at LRK. The average ammonium and
nitrate contribution to seasonal average NR-PM1loadings is
small compared to OA and sulfate (Table 2). Both ammo-nium and nitrate showed similar trends at the JST site, where they were highest during colder seasons (winter and fall), while showing no significant fluctuations during the duration of the study at LRK. This observation is consistent with pvious studies (Tanner et al., 2004b; Olszyna et al., 2005) re-porting that average contributions of ammonium and nitrate are not significant for rural PM1. Average non-refractory
chloride loadings were low (< 0.1 µg m−3), indicating that it
is not a significant contributor to inorganic aerosol mass in this region. The increasing average contributions from the sum of sulfate, ammonium and nitrate in winter and fall at JST suggests the important role of inorganics in NR-PM1, in
accord with observations in other major urban areas (Sun et al., 2011; Petit et al., 2015).
The lowest seasonal average pH was observed in summer (1.45) for JST (Fig. 3) and in fall (1.53) for LRK (Fig. 3). On the other hand, the highest seasonal average pH was 2.01 for JST and 1.81 for LRK, which were observed dur-ing winter. Overall, seasonal aerosol pH was 1.5–2.0 at both sites, indicating that NR-PM1in the southeastern US is acidic
year round. This is consistent with a recent study by Guo et al. (2015). No direct correlation (r2< 0.1) was observed be-tween aerosol pH and OA at both sites. However, this does not necessarily rule out the potential role of aerosol acidity in enhancing SOA formation in light of laboratory studies, demonstrating a significant pH effect (Gao et al., 2004; Sur-ratt et al., 2007; Lin et al., 2013b). Uncertainty of aerosol acidity estimation by ISORROPIA-II by omission of organic sulfate as input (Lin et al., 2014) could lead to underpredic-tion of aerosol acidity and the observed lack of correlaunderpredic-tion with OA. Seasonal averages of LWC were highest during summer at both JST (33.97 mol L−1 of aerosol) and LRK
(38.17 mol L−1) sites. It should be noted that the possible
12
8
4
0
OA (µ
g m
-3 )
wtr spr smr fall
4
3
2
1
0
SO
4
2- (µ
g m
-3 )
wtr spr smr fall
3.0
2.0
1.0
0.0
NO
3
- (µ
g m
-3 )
wtr spr smr fall
3.0
2.0
1.0
0.0
NH
4
+ (µ
g m
-3)
wtr spr smr fall
0.20
0.15
0.10
0.05
0.00
Cl
- (µ
g m
-3 )
wtr spr smr fall
3.0
2.0
1.0 0.0
pH
wtr spr smr fall
Figure 3.Seasonal averages of OA, inorganic species and pH from JST (solid squares) and LRK (open triangles). Error bars show±1 standard deviation. Seasons are classified into winter (wtr), spring (spr), summer (smr) and fall.
reactive uptake decreases with enhanced RH (Nguyen et al., 2014; Gaston et al., 2014); however, some isoprene-derived SOA tracers were elevated by high RH (Zhang et al., 2011). Although organic water fraction in total LWC was found to be significant, Guo et al. (2015) suggested that pH prediction using ISORROPIA-II based on inorganic ions alone gave a reasonable estimate. The lack of correlation between OA and pH as well as LWC indicates that pH and LWC might not be limiting factors in OA production in this region, consis-tent with previous studies in Georgia and Alabama (Xu et al., 2015a) and Tennessee (Budisulistiorini et al., 2015). It should be noted that this study did not include the contribu-tion of organic water into pH estimacontribu-tion, which could con-tribute to the relationship between pH and OA.
3.2 OA characterizations
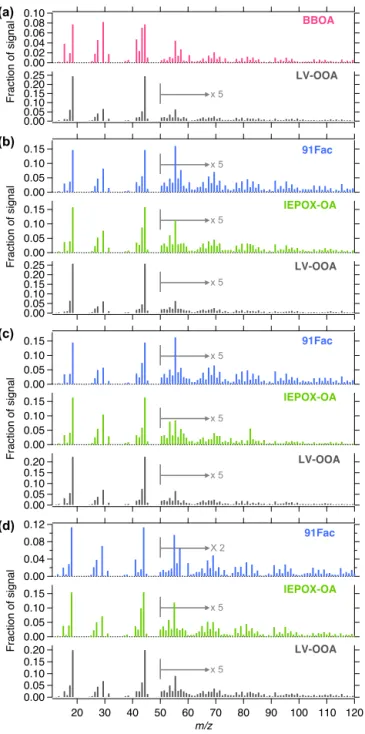
The mass spectra and time series of OA factors resolved from PMF analysis at JST in 2012 are provided in Figs. 4 and 5, respectively, and at LRK in 2013 are provided in Figs. 6 and 7, respectively. More PMF factors were re-solved from JST OA than from LRK OA, which could be due to a larger number of OA source types in urban areas. Each factor had a distinctive time trend throughout 2012 (Fig. 5) at JST and 2013 at LRK (Fig. 7). OA measured at JST in 2012 and LRK in 2013 was composed primar-ily of low-volatility oxygenated OA (LV-OOA) and IEPOX-derived OA factor (IEPOX-OA). Concentrations of LV-OOA and IEPOX-OA at both sites were 1.9 and 1.6 µg m−3 on
average, respectively (Fig. 8). Hydrocarbon-like OA (HOA) and semi-volatile oxygenated OA (SV-OOA) concentrations varied between 1 and 2 µg m−3at JST and biomass burning
OA (BBOA) was ∼1 µg m−3 at both sites. A biogenically
influenced factor (91Fac) was observed only at LRK and ac-counted for∼1 µg m−3. Due to a lack of measurements, the
potential role of planetary boundary layer (PBL) height to diurnal variation of PMF factors was not accounted for in this study. However, diurnal PBL dynamics or loss processes
(e.g. deposition) could influence diurnal patterns observed here for the PMF factors.
3.2.1 Winter
PMF analysis of winter OA yielded a four-factor solution at JST (Figs. 4a and 5a) and a two-factor solution at LRK (Figs. 6a and 7a). HOA, BBOA, SV-OOA and low-volatility oxygenated OA (LV-OOA) factors (Ng et al., 2011a) were resolved from the JST data set, whereas only the BBOA and LV-OOA factors were resolved from the LRK data set. In-creasing the number of factors in PMF analysis of LRK data resulted in splitting factors that share similarities with BBOA factor. Thus, we selected a two-factor solution (p=2) for LRK in winter.
The temporal variation of the HOA factor correlates well (r2> 0.7) with black carbon (BC), carbon monoxide (CO) and reactive nitrogen species (NOy; Table S2). Moreover,
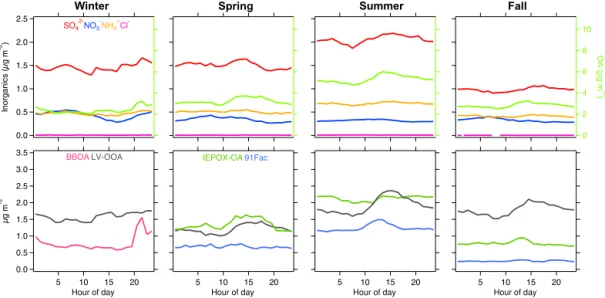
its diurnal variation (Fig. 9) showed a morning peak, consis-tent with an expected contribution from vehicular emissions (Zhang et al., 2007).
The BBOA factor concentration increased during the night and decreased during the day at JST (Fig. 9), which could be related to residential and non-residential wood burning as well as PBL dynamics. BBOA at the LRK site also showed a large nighttime peak with a gradual decrease during the day (Fig. 10). The large peak appears to result from a short period of intense biomass burning that occurred during 15– 18 March 2013. Since a source for this event could not be identified, we do not report it specifically in this study. The time series of BBOA showed low to moderate correlation (r2
x 5 x 5 0.12
0.08 0.04 0.00 0.12 0.08 0.04 0.00
Fraction of signal
0.20 0.15 0.10 0.05 0.00 0.16 0.12 0.08 0.04 0.00
HOA
BBOA
SV-OOA
LV-OOA (a)
x 5 x 5
0.12 0.08 0.04 0.00 0.12 0.08 0.04 0.00 Fraction of Signal 0.20 0.15 0.10 0.05 0.00
HOA
IEPOX-OA
LV-OOA (b)
x 5 (c) 0.10
0.08 0.06 0.04 0.02 0.00 0.16 0.12 0.08 0.04 0.00 Fraction of Signal 0.20 0.15 0.10 0.05 0.00
HOA
IEPOX-OA
LV-OOA
x 5
x 5 x 5
0.10 0.08 0.06 0.04 0.02 0.00
120 100
80 60
40 20
m/z 0.12
0.08 0.04 0.00 0.15 0.10 0.05 0.00
Fraction of signal
0.20 0.15 0.10 0.05 0.00
HOA
BBOA
SV-OOA
LV-OOA (d)
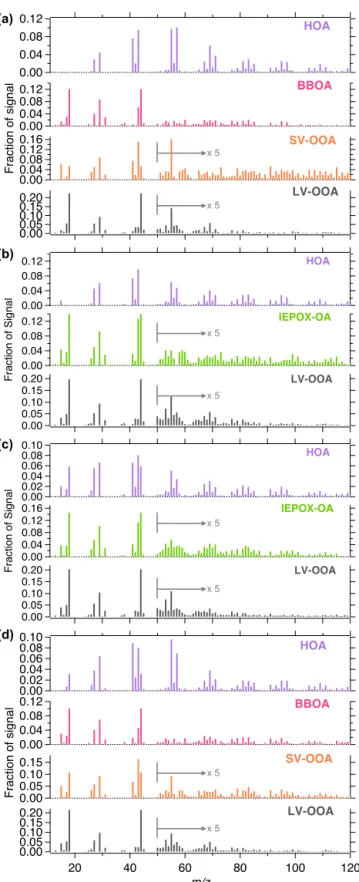
Figure 4.Mass spectra of PMF factors resolved from(a)winter,
(b)spring,(c)summer and(d)fall OA measured at JST in 2012.
measurements (Wood et al., 2010). The similarity of BBOA and OOA factor mass spectra could indicate aging of the BBOA factor, which was observed to have enhanced signals atm/z18, 29 and 44 ions and low signals atm/z60 and 73 ions (Bougiatioti et al., 2014). However, the BBOA factor observed at JST and LRK displayed an enhanced signal at
m/z44 ion but retained signals atm/z60 and 73 ions, sug-gesting that it was not as oxidized as the aged BBOA factor. LV-OOA is characterized by a high fraction of total ion intensity at m/z44 (f44)resulting from high oxygen
con-tent (Ng et al., 2011a) and is the most abundant OA type at both JST and LRK (Table 2). Maxima around midnight at JST (Fig. 9) and in the mid-afternoon at LRK (Fig. 10) were not significant, indicating that LV-OOA concentration is relatively constant throughout the day in this region. LV-OOA has been shown to correlate with non-volatile sec-ondary species, such as sulfate (Jimenez et al., 2009). Weak correlation (r2< 0.2) between LV-OOA and sulfate might be due to a complex oxidation process, as previously observed in urban ambient aerosol (Sun et al. 2011a). On the other hand, the mass spectral comparison of LV-OOA from both sites showed strong correlation (r2∼1, Fig. S25), possibly suggesting similar sources of LV-OOA at these sites.
SV-OOA, which was observed only at JST, showed an
f44 smaller than that of LV-OOA (Fig. 4a), indicating that
the factor is less oxidized and thus semi-volatile (Ng et al., 2011a). The temporal variation of SV-OOA was moderately correlated (r2∼0.4) with nitrate (Table S2) while the mass spectrum was well correlated with previously resolved 82Fac and IEPOX-OA factors (82Fac and IEPOX-OA are equiv-alent and are characterized by a prominent ion at m/z82;
Robinson et al., 2011; Budisulistiorini et al., 2013, 2015). Since isoprene emission is expected to be negligible during winter season, SV-OOA might not relate to IEPOX-derived SOA. The diurnal profile of SV-OOA showed an increase in the evening and decrease in the morning, similar to the BBOA profile and HOA factors. Moreover, it tracked well with the diurnal profile of NO−
3. This suggests a possible
in-fluence of nitrate-radical chemistry on nighttime SOA for-mation during winter (Xu et al., 2015b; Rollins et al., 2012).
3.2.2 Spring
1/1/2012 1/3/2012 1/5/2012 1/7/2012 1/9/2012 1/11/2012 Date and time (local)
12 8 4 0 16 12 8 4 0 12 8 4 0
Mass
conc.
(µg
m
)
-3
6 4 2 0 40 30 20 10 0
LV-OOA SV-OOA IEPOX-OA
BBOA HOA
Winter Spring Summer Fall
Figure 5.Annual temporal variation of PMF factors resolved from OA measured at JST in 2012.
Thus, BBOA and/or HOA were not resolved from LRK in spring.
The average concentration of HOA in Atlanta was lower in spring (0.7 µg m−3)than in winter (1.7 µg m−3), which could
be influenced by dilution – from a rise of the PBL –and evap-oration of POA during warmer conditions (Robinson et al., 2007). Although its concentration decreases, the diurnal pat-tern of HOA was consistent from winter to spring (Fig. 9) and correlation with primary species was strong (r2∼0.6, Table S2).
Average LV-OOA concentration at JST also was the lowest in spring (1.4 µg m−3), which might be attributed to
warm-ing temperatures that elevate the PBL and enhance atmo-spheric mixing. Diurnal variation of LRK LV-OOA (Fig. 10) showed a small diurnal maximum in the afternoon, whereas no variation was observed for JST LV-OOA (Fig. 9). LRK LV-OOA showed moderate correlation with sulfate (r2> 0.4,
Table S3), suggesting influence of sulfate at this site dur-ing sprdur-ing (Tanner et al., 2015). Although no correlation was found for JST LV-OOA vs. sulfate, comparison of mass spec-tra revealed the same strong correlation (r2∼1, Fig. S25) between JST and LRK LV-OOA factors observed in winter, suggesting possible similar sources over a regional scale.
The IEPOX-OA factor, attributed to IEPOX heterogeneous chemistry (Budisulistiorini et al., 2013; Lin et al., 2012), was resolved from data sets at both JST and LRK. It was the sec-ond most abundant OA type after LV-OOA at JST, but the most abundant OA component at LRK (Table 2). The average IEPOX-OA concentration was slightly higher at LRK than at JST, which is expected due to abundant emissions of isoprene at the forested site. Diurnal patterns of IEPOX-OA are differ-ent at JST and LRK. At LRK, IEPOX-OA has insignificant diurnal variability, which is likely influenced by small vari-ability of sulfate as previously observed at this site (Tanner et al., 2005). However, a small increase in the afternoon and
constant concentration until the evening suggests that this factor is driven by photooxidation of isoprene (Budisulistior-ini et al., 2013). At JST, the diurnal pattern of IEPOX-OA followed that of total OA, where it slightly decreased during the day before it increased again in the evening. This diurnal pattern is different from previous observations at JST during summer 2011 (Budisulistiorini et al., 2013), but quite similar to isoprene OA from May 2012 reported by Xu et al. (2015a), suggesting influence of year-to-year changes in meteorology, such as precipitation and solar radiation (Table S1). Never-theless, the mass spectra of IEPOX-OA at JST and LRK are tightly correlated (r2∼1), indicative of similar composition. 91Fac was resolved only at the LRK site and accounted for 0.7–1.2 µg m−3. 91Fac has been attributed to various
sources: monoterpenes-derived SOA (Budisulistiorini et al., 2015; Boyd et al., 2015), biogenic SOA (Chen et al., 2015) and aged BBOA (Robinson et al., 2011). However, a recent field study identified ions at m/z18, 29 and 44 as
mark-ers for aged BBOA but notm/z91 ion (Bougiatioti et al., 2014). Since BBOA was not resolved from OA measure-ments in spring, aging of BBOA seems unlikely to be the source of 91Fac in this study, although it cannot be conclu-sively ruled out. The lack of 91Fac at the JST site suggests that its sources may be limited to emissions and chemical processes in forested and/or rural areas. 91Fac will be fur-ther discussed in Sect. 4.2.
3.2.3 Summer
PMF analysis of summer OA resolved the same factors as spring at both sites: HOA, LV-OOA and IEPOX-OA factors at JST (Figs. 4c and 5c), and LV-OOA, 91Fac and IEPOX-OA factors at LRK (Figs. 6c and 7c). Average HIEPOX-OA mass concentration at JST increased in summer to∼1.1 µg m−3
diur-X 2 x 5
0.10 0.08 0.06 0.04 0.02 0.00
Fraction of signal
0.25 0.20 0.15 0.10 0.05 0.00
BBOA
LV-OOA (a)
x 5
x 5
x 5 0.15
0.10 0.05 0.00
0.15 0.10 0.05 0.00 Fraction of signal 0.25 0.20 0.15 0.10 0.05 0.00
91Fac
IEPOX-OA
LV-OOA (b)
x 5
x 5
x 5 0.15
0.10 0.05 0.00
0.15 0.10 0.05 0.00 Fraction of signal 0.20 0.15 0.10 0.05 0.00
91Fac
IEPOX-OA
LV-OOA (c)
x 5
x 5 0.12
0.08
0.04
0.00
120 110 100 90 80 70 60 50 40 30 20
m/z 0.15
0.10 0.05 0.00 Fraction of signal 0.20 0.15 0.10 0.05 0.00
91Fac
IEPOX-OA
LV-OOA (d)
Figure 6.Mass spectra of PMF factors resolved from(a)winter,
(b)spring,(c)summer and(d)fall OA measured at LRK in 2013.
nal pattern was similar to that of spring (Fig. 9). Similar to spring, SV-OOA was not resolved in summer, which could be attributed to rapid evaporation of semi-volatile species under high ambient temperatures (Table S1).
Average LV-OOA concentrations at both sites increased in summer; however, the proportional contribution decreased as a result of a larger contribution of IEPOX-OA at JST and 91Fac at LRK (Table 2). The time series of LV-OOA was weakly correlated with sulfate (r2∼0.2) at JST, but more strongly correlated with sulfate at LRK (r2=0.6–0.7;
Ta-bles S2–S3). The diurnal profile of LRK LV-OOA showed a local maximum in mid-afternoon (Fig. 10) and has a moder-ate correlation (r2∼0.4) with the sulfate (Table S3), suggest-ing that sulfate plays a role in LV-OOA in summer at LRK. Comparison of JST and LRK LV-OOA mass spectra revealed a strong correlation (r2=0.94), possibly suggesting similar sources between two sites.
Average concentration of the 91Fac OA at LRK was higher in summer than spring, which indicates the role of meteorol-ogy – an increasing temperature from∼13◦C in spring to
∼21◦C in summer (Table S1). The relative contribution of
91Fac to total OA increased at LRK (Table 2) and its diurnal profile showed a local maximum around noon. A moderate correlation of 91Fac with nitrate (r2∼0.5, Table S3) sug-gests that the factor is moderately oxidized.
Average concentration of IEPOX-OA at JST and LRK in-creased during summer. At LRK, the average concentration of IEPOX-OA reached a maximum in summer, but its relative contribution to total OA mass was lower due to the increas-ing concentration of 91Fac. Concentrations of IEPOX-OA at both sites are comparable (Fig. 8), suggesting that in summer this factor may become spatially homogeneous in the south-eastern US. Since measurements at JST and LRK were con-ducted during different years, meteorological changes might play a role in site-to-site comparison. At LRK, IEPOX-OA showed a small increase around noon, while at JST there was a local maximum in the mid-afternoon, suggesting an influx of IEPOX-OA likely transported from surrounding forested areas. The time series of IEPOX-OA was moderately cor-related with nitrate (r2∼0.4) at JST, and at LRK, stronger correlations (r2> 0.5) with sulfate and nitrate were observed,
suggesting that this factor is moderately oxidized.
3.2.4 Fall
At JST, PMF analysis of fall OA resulted in a four-factor solution (i.e., HOA, BBOA, SV-OOA and LV-OOA), while at LRK a three-factor solution was resolved (i.e., LV-OOA, 91Fac and IEPOX-OA). Increasing the number of factors in PMF analysis of JST fall data resulted in factor splitting, and thus, the IEPOX-OA factor was not resolved from this data set. Similarly, we could not resolve the BBOA factor from LRK fall data because the analysis resulted in splitting com-ponents.
The concentration of JST HOA increased to a level com-parable to that in winter (Fig. 5), which might be influenced by meteorology – a low ambient temperature and less solar radiation – in fall and winter. The correlation of the time se-ries of HOA with BC, CO and NOx (r2> 0.7) was similar
1/3/2013 1/5/2013 1/7/2013 1/9/2013 1/11/2013 Date and time (local)
8 6 4 2 0 12
8
4
0
Mass
conc.
(µg
m
)
-3
6
4
2
0 60
40
20
0
Winter Spring Summer (SOAS) Fall
BBOA
91Fac
IEPOX-OA
LV-OOA
Figure 7.Annual temporal variation of PMF factors resolved from OA measured at LRK in 2013. OA measurements in the summer included results from the Southern Oxidant Aerosol Study (SOAS) campaign that have been published in Budisulistiorini et al. (2015).
5 4 3 2 1 0
HOA (µ
g m
-3 )
wtr spr smr fall 5 4 3 2 1 0
BBOA (µ
g m
-3 )
wtr spr smr fall 5 4 3 2 1 0
SV-OOA (µ
g m
-3 )
wtr spr smr fall
5 4 3 2 1 0
LV-OOA (µ
g m
-3 )
wtr spr smr fall 5 4 3 2 1 0
IEPOX-OA (µ
g m
-3 )
wtr spr smr fall 5 4 3 2 1 0
91Fac (µ
g m
-3 )
wtr spr smr fall
Figure 8.Seasonal average mass concentrations of PMF factors resolved from JST (solid squares) and LRK (open triangles). Error bars are shown as±1 standard deviation.
At JST, the BBOA factor was resolved again from OA with average concentration and fractional contribution to total OA less than observed in winter. The diurnal profile of BBOA during fall at JST appeared similar to that in winter, suggest-ing similar emission sources as well as possible PBL effect during these two colder seasons. The lack of the BBOA fac-tor at LRK could be attributed to the inability of the ACSM to capture a factor with low concentration. In winter, the ACSM could capture the strong signal of BBOA due to some periods of intense burning which would not be expected in fall.
SV-OOA was also resolved from JST OA with slightly higher average concentration and fractional contribution than that observed in winter. The diurnal profile of fall SV-OOA was similar to that in winter, suggesting similar sources and the role of the PBL. The return of SV-OOA might be influ-enced by decreases in temperature from∼26◦C in summer to∼15◦C in fall (Table S1), resulting in less evaporation of semi-volatile species.
LV-OOA was resolved from OA at both JST and LRK. Average concentrations of LV-OOA remained relatively
con-stant from summer to fall at both the urban and rural sites (Fig. 8). However, the contribution of LV-OOA to total OA at LRK increased due to decreasing concentrations of other OA factors (i.e., IEPOX-OA and 91Fac; Table 2). JST LV-OOA did not show diurnal variation, whereas Xu et al. (2015a) ob-served a small diurnal variation by HR-ToF-AMS. The mass resolution of the ACSM instrument is not as high as the HR-ToF-AMS; thus, it might not be able to capture the diur-nal variability. LRK LV-OOA increased in mid-morning and reached a maximum around mid-afternoon. Temporal vari-ation of LV-OOA was weakly correlated (r2∼0.2) with in-organics at JST, but moderately correlated (r2=0.4–0.5) at LRK. Strong correlation of LV-OOA mass spectra (r2∼1, slope=0.8–1.1, Fig. S25) at JST and LRK indicates a simi-lar or identical source.
The concentration of 91Fac at LRK dropped significantly in fall. The drop coincided with a decrease of total OA con-centration and ambient temperature – from around 20◦C
to around 10◦C (Fig. 2). Temperature has been shown to
2.5
2.0
1.5
1.0
0.5
0.0
Inorganics (µ
g m
-3 )
SO4
2-NO3
-NH4 +
Cl- 10
8
6
4
2
0
OA (µ
g m
-3
)
3.5
3.0
2.5
2.0
1.5
1.0
0.5
0.0
µ
g m
-3
20 15 10 5
Hour of day
HOA BBOA SV-OOA LV-OOA
20 15 10 5
Hour of day
IEPOX-OA 91Fac
20 15 10 5
Hour of day
20 15 10 5
Hour of day
Winter Spring Summer Fall
Figure 9.Diurnal variations of OA and inorganic species measured by ACSM (upper panel) and OA factors resolved by PMF analysis (lower panel) from winter, spring, summer and fall measurements at JST in 2012.
Winter Spring Summer Fall
2.5
2.0
1.5
1.0
0.5
0.0
Inorganics (µ
g m
-3)
SO4
2-NO3
-NH4 +
Cl- 10
8
6
4
2
0
OA (µ
g m
-3
)
3.5
3.0
2.5
2.0
1.5
1.0
0.5
0.0
µ
g m
-3
20 15 10 5
Hour of day BBOA LV-OOA
20 15 10 5
Hour of day
IEPOX-OA 91Fac
20 15 10 5
Hour of day
20 15 10 5
Hour of day
Figure 10.Diurnal variations of OA and inorganic species measured by ACSM (upper panel) and OA factors resolved by PMF analysis (lower panel) from winter, spring, summer and fall measurements at LRK in 2013.
(Emanuelsson et al., 2013), but isoprene SOA is shown to be dependent on temperature (Worton et al., 2013). Similar to 91Fac, IEPOX-OA concentration at LRK also decreased in fall, suggesting that their sources could be similar. The lack of the IEPOX-OA factor at JST is likely due to reduced iso-prene emissions, leading to low SOA formation, consistent with previous studies (Budisulistiorini et al., 2013; Xu et al., 2015a).
3.3 Seasonal changes and contribution of OA sources HOA was observed throughout the year at JST in 2012 and contributes significantly to total OA (on average 21 %), while it was not observed at LRK in 2013. Wider standard
devia-tions in winter and fall suggest more variability in HOA mass in Atlanta during these seasons.
LV-OOA, which was also observed throughout the year, contributes 30–43 % of the total OA on average. At LRK, LV-OOA was also observed throughout the year, accounting for a large proportion of total OA in winter, up to 66 %. Re-sults from JST and LRK sites suggest that LV-OOA is an-nually and spatially homogeneous, consistent with previous observations in this region (Xu et al., 2015a).
0.015
0.010
0.005
0.000
f53
sprsmr
spr smr
fall
JST LRK 0.006
0.004
0.002
0.000 f75
spr smr
spr smr
fall
0.0030
0.0020
0.0010
0.0000
f100
0.010 0.000
f82
spr
smr
spr
smr fall
0.005
0.004
0.003
0.002
0.001
0.000
f101
0.010 0.000
f82 spr
smr
spr smr
fall
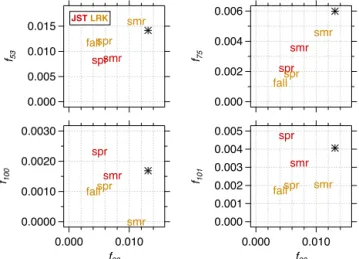
Figure 11.Scatter plots of the m/z53 (possibly C4H+5),m/z75 (possibly C3H7O+2), m/z100 (possibly C5H8O+2) and m/z101 (possibly C5H9O+
2) normalized fragment ions from the
IEPOX-OA mass spectra vs. them/z82 normalized fragment ion from the same mass spectra over different seasons at the JST and LRK sites. ACSM measures unit mass resolution (UMR); thus the proposed formulas are based on previous study using HR-ToF-AMS (Lin et al., 2012). The asterisk marker is the respective ion fragments of IEPOX-OA mass spectra resolved from OA measurements during summer 2011 at the JST site (Budisulistiorini et al., 2013).
BBOA was observed only during winter 2013 at LRK. The average concentration of BBOA at LRK was consistently ∼1 µg m−3, but several episodes of high levels resulted in a large standard deviation (Fig. 8). The LRK site is located quite far from residential areas; thus emissions from resi-dential burning activities might not be well captured by the ACSM during the fall season.
SV-OOA was resolved only at JST and only in the fall and winter, implying that it might be formed from local ag-ing process or transported from nearby areas. SV-OOA con-tributed 27 % of the total OA on average. During spring and summer, SV-OOA concentrations were probably at or below the ACSM limits of detection due to higher ambient tem-peratures that likely promote evaporation of semi-volatile species.
IEPOX-OA concentrations were elevated from spring to summer of 2012 at JST and 2013 at LRK in accord with ex-pected enhanced emission and photochemistry of isoprene. In Atlanta (JST), concentration of IEPOX-OA was 38 % of total OA over spring and summer on average. Mass variabil-ity of JST IEPOX-OA in summer was large, primarily as a result of a sharp peak in early July, when levels were as high as∼4 µg m−3. At LRK, IEPOX-OA was observed in spring,
summer and fall seasons with average concentrations of 1.4, 2.1 and 0.8 µg m−3in spring, summer and fall, respectively,
contributing 36 % of total OA mass on average. The drastic decrease of IEPOX-OA concentration from summer to fall at LRK (Fig. 7) could be attributed to the drop of ambient
temperature that might affect SOA formation (Worton et al., 2013). In addition, significant IEPOX-OA drop is consistent with loss of tree foliage as a major source of isoprene emis-sion, which is supported by a lack of IEPOX-OA during win-ter.
91Fac factor was observed during spring, summer and fall at LRK in 2013. Seasonal average concentrations of 91Fac were 0.68 (21 %) in spring, 1.25 (23 %) in summer and 0.25 µg m−3(9 %) in fall. Further discussion about the
possi-ble source(s) of 91Fac is presented in Sect. 4.2. Decrease of 91Fac factor from summer to fall (Fig. 7) coincided with de-crease total OA and IEPOX-OA factor, possibly suggesting a similar biogenic source.
4 Discussion
4.1 IEPOX-OA factor: fragment ion contributions The IEPOX-OA component has been observed in chamber experiments and field OA (Hu et al., 2015). Mass spectra generated by thermal decomposition of isomeric authentic 3-MeTHF and IEPOX standards directly atomized into the Aerodyne HR-ToF-AMS show major fragments at m/z82
(mostly C5H6O+),m/z53 (mostly C4H+5) and 75 (mostly
C3H7O+2, Lin et al., 2012). The ion fragment at m/z100
(mostly C5H8O+2) was also suggested as an ion marker
for IEPOX-derived SOA (Lin et al., 2013b); however, field studies using ACSM (Budisulistiorini et al., 2013, 2015) showed stronger signal atm/z101 (possibly C5H9O+2).
Tem-poral variation of them/z82 fragment ion associated with
LV-OOA, IEPOX-OA and 91Fac (Fig. S26) shows that the IEPOX-OA factor is the predominant contributor tom/z82 at both LRK and JST in spring and summer. During fall the LV-OOA factor becomes a significant contributor tom/z82 at LRK, which might be due to influence of aged IEPOX-OA. Further studies, however, will be needed to examine ef-fects of atmospheric oxidation in IEPOX-OA and LV-OOA mass spectra. The IEPOX-OA mass spectra fragment ions at m/z82 show weak and strong linear relationships with
m/z53 and m/z75, respectively and no correlation with
m/z100 (Fig. 9). Fractional contribution of ions at 75 (f75)
vs. the contribution of the ion atm/z82 (f82)to IEPOX-OA
mass spectra show a strong linear relationship (r2=0.95, slope=0.49±0.06) over different locations and seasons, while f53 and f82 were moderately correlated (r2=0.48). ACSM mass spectra acquired from the atomization of filter extracts of laboratory-generated IEPOX-derived SOA (Bud-isulistiorini et al., 2013) and in the IEPOX-OA factor re-solved from field studies using the ACSM (Budisulistiorini et al., 2015) gave a quite prominent ion atm/z101 rather thanm/z100. The scatter plots off101andf100againstf82
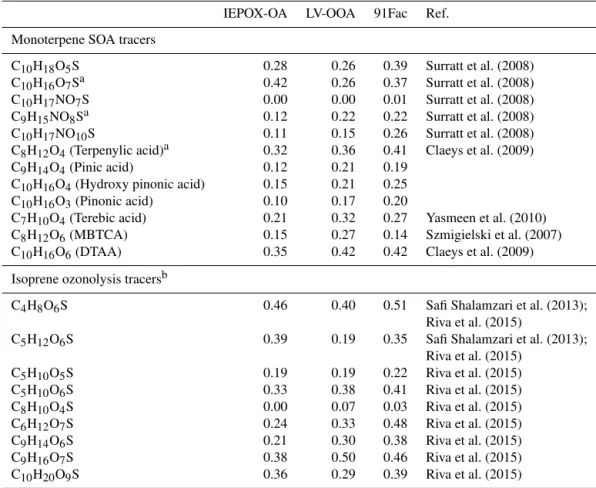
Table 3.Correlations of PMF factors resolved from OA measurements at LRK, TN, against SOA tracers from monoterpene chemistry and isoprene ozonolysis quantified during the 2013 SOAS. Some of the monoterpene SOA tracers have been published in Budisulistiorini et al. (2015).
IEPOX-OA LV-OOA 91Fac Ref. Monoterpene SOA tracers
C10H18O5S 0.28 0.26 0.39 Surratt et al. (2008) C10H16O7Sa 0.42 0.26 0.37 Surratt et al. (2008)
C10H17NO7S 0.00 0.00 0.01 Surratt et al. (2008) C9H15NO8Sa 0.12 0.22 0.22 Surratt et al. (2008)
C10H17NO10S 0.11 0.15 0.26 Surratt et al. (2008) C8H12O4(Terpenylic acid)a 0.32 0.36 0.41 Claeys et al. (2009)
C9H14O4(Pinic acid) 0.12 0.21 0.19 C10H16O4(Hydroxy pinonic acid) 0.15 0.21 0.25
C10H16O3(Pinonic acid) 0.10 0.17 0.20
C7H10O4(Terebic acid) 0.21 0.32 0.27 Yasmeen et al. (2010) C8H12O6(MBTCA) 0.15 0.27 0.14 Szmigielski et al. (2007)
C10H16O6(DTAA) 0.35 0.42 0.42 Claeys et al. (2009) Isoprene ozonolysis tracersb
C4H8O6S 0.46 0.40 0.51 Safi Shalamzari et al. (2013); Riva et al. (2015)
C5H12O6S 0.39 0.19 0.35 Safi Shalamzari et al. (2013); Riva et al. (2015)
C5H10O5S 0.19 0.19 0.22 Riva et al. (2015) C5H10O6S 0.33 0.38 0.41 Riva et al. (2015)
C8H10O4S 0.00 0.07 0.03 Riva et al. (2015) C6H12O7S 0.24 0.33 0.48 Riva et al. (2015)
C9H14O6S 0.21 0.30 0.38 Riva et al. (2015)
C9H16O7S 0.38 0.50 0.46 Riva et al. (2015) C10H20O9S 0.36 0.29 0.39 Riva et al. (2015)
aPublished in Budisulistiorini et al. (2015).bOnly nighttime samples were used in PMF factor correlation with isoprene ozonolysis tracers.
IEPOX-OA factor based on its markers (Hu et al., 2015) were not done in this study, this study presents some insights into the role of the m/z82 fragment ion over different seasons
in the southeastern US. Observation of them/z75 fragment
ion variation over different seasons indicates its potential as a marker ion for IEPOX-OA detection. Here we have es-timated from our field data that the intensity of the ion at
m/z75 is about half that of the ion atm/z82 in IEPOX-OA mass spectra. This warrants future study to examinem/z75 ion fragment detection from laboratory-generated IEPOX-derived SOA using a higher-resolution aerosol mass spec-trometer.
4.2 Insights into 91Fac OA formation
Laboratory and field studies have reported significant sig-nal of an m/z91 fragment ion measured by the Aerodyne AMS (e.g., Surratt et al., 2006; Robinson et al., 2011; Slowik et al., 2011; Chen et al., 2015). Surratt et al. (2006) found that this ion strongly correlated with OA mass during iso-prene photooxidation under low-NOx and low-RH
condi-tions in a chamber using ToF-AMS, and proposed C3H7O+3
formula for this ion as a tracer for peroxide under low-NOx condition. Field measurements showed that a PMF
factor with intense signal at m/z91 (91Fac) was resolved
from OA measurements over densely forested areas where isoprene emissions were dominant and the NOx level was
negligible (Robinson et al., 2011; Budisulistiorini et al., 2015) as well as sites influenced by monoterpene emis-sions (Slowik et al., 2011). In this study, we found that NOx is not correlated (r2∼0) with m/z91 of 91Fac
dur-ing sprdur-ing and summer, suggestdur-ing that at the LRK site, the factor is not influenced by NOx (Fig. S27). Correlation
values of 0.14 and 0.2 were found betweenm/z91 ion of 91Fac andm/z82 ion of IEPOX-OA factor during spring and summer, respectively. Since IEPOX-OA is associated with isoprene-derived SOA, the weak correlations indicate that biogenic source(s) – not necessarily isoprene – might con-tribute to 91Fac formation in densely forested areas like at the LRK site. High-volume PM2.5 filter samples collected
chro-matography/diode array detection-electrospray ionization-high-resolution quadrupole time-of-flight mass spectrome-try (UPLC/DAD-ESI-HR-QTOFMS; Budisulistiorini et al., 2015). In addition to monoterpene SOA tracers (Surratt et al., 2008; Claeys et al., 2009; Yasmeen et al., 2010; Szmigiel-ski et al., 2007) reported in Budisulistiorini et al. (2015), SOA tracers from isoprene ozonolysis chemistry (Safi Sha-lamzari et al., 2013; Riva et al., 2015) were also detected (Table 3). Correlations between 91Fac and SOA tracers from isoprene ozonolysis and monoterpene chemistry are 0.4 and 0.3 on average (Table 3), respectively. These suggest higher potential contributions of isoprene chemistry through a non-IEPOX pathway over monoterpene chemistry in 91Fac for-mation. Photooxidation of isoprene hydroxy hydroperoxide (ISOPOOH) under low-NOxconditions was recently shown
to yield the formation of low-volatility hydroperoxide com-pounds (St. Clair et al., 2015), leading to the production of non-IEPOX SOA in chamber and field studies (Krechmer et al., 2015). Further investigations of peroxide contributions to the formation of 91Fac could not be performed in this study because the details of aerosol-phase tracers and elec-tron ionization fragmentation patterns of non-IEPOX SOA produced from condensation of the low-volatility hydroper-oxide compounds are not yet known (St. Clair et al., 2015; Krechmer et al., 2015). This should be a focus of future work. The weak correlations of 91Fac with monoterpene SOA tracers (r2=0.3, Table 3) might indicate that multiple sources could contribute to the formation of 91Fac. Labora-tory studies found that combined isoprene-, α-pinene-, and β-caryophyllene-derived SOA mass (Chen et al., 2015) as
well asβ-pinene+NO3SOA mass spectra (Boyd et al., 2015)
produced an intense signal atm/z91 associated with C7H+7.
Due to limitation in unit mass resolution of ACSM measure-ments, we could not identify composition of m/z91 frag-ment ion. Thus, contributions of C7H+7 and C3H7O+3 could
not be examined in this study.
5 Conclusions
Seasonal characterization of NR-PM1collected in the
south-eastern US revealed that OA is the most abundant species, accounting for 50–65 % of total NR-PM1 at LRK and 65–
75 % of total NR-PM1at JST. Sulfate is the most abundant
inorganic species throughout the year, accounting for 20–30 and 10–20 % of total NR-PM1 at the rural and urban site,
respectively. Nitrate and ammonium followed as the third and fourth most abundant inorganic species, respectively, and were dependent on the season and location. The highest av-erage concentrations of OA, sulfate and ammonium were ob-served during summer season at LRK and during fall at JST. Characterization of OA using PMF resolved a combined six factors at JST and LRK sites, with different factors being resolved depending on location, season and year. HOA and SV-OOA were only resolved at JST that represent urban OA.
BBOA, LV-OOA and IEPOX-OA were resolved from both sites during different seasons, while 91Fac was only resolved from LRK site during warmer seasons. HOA contributions to total OA mass were fairly consistent (∼21 % of total OA) over four seasons, and its contributions peaked during win-ter. SV-OOA was only observed during colder seasons, hav-ing a consistent contribution of 27 % of total OA. BBOA was observed during winter and fall seasons at JST and only dur-ing winter at LRK, with the highest contribution of 33 % of total OA observed during winter at the LRK site and 17 % of total OA on average at the JST site. The higher contribu-tion of BBOA at LRK was likely due to a single, significant burning event, whereas contribution at JST is more consistent between winter and fall.
Average IEPOX-OA contributions during warmer seasons were∼38 and ∼41 % of total OA at JST and LRK sites, respectively. While the IEPOX-OA resolved from PMF is characterized by the fragment ion atm/z82, strong correla-tion of the fraccorrela-tional contribucorrela-tions of the ionsm/z82 and 75 fragment ions to IEPOX-OA mass spectra (f75:f82 ∼0.5)
suggests that both ions can serve as markers for IEPOX-OA. Average 91Fac OA contribution was∼22 % of total OA at the LRK site over spring and summer. Based on corre-lations with SOA tracer analysis performed offline, 91Fac showed an overall higher correlation with SOA markers of isoprene ozonolysis and photooxidation than with monoter-pene oxidation. This might indicate that 91Fac at LRK could be influenced by isoprene chemistry, but might have differ-ent sources in other locations where isoprene is not in high abundance. The abundance of 91Fac in isoprene-dominated forested areas such as LRK warrants further study to de-termine the source, since multiple biogenic sources or low-volatility hydroperoxide compounds might contribute to this factor.
The Supplement related to this article is available online at doi:10.5194/acp-16-5171-2016-supplement.
Acknowledgements. This study was supported by the Electric
References
Bougiatioti, A., Stavroulas, I., Kostenidou, E., Zarmpas, P., Theo-dosi, C., Kouvarakis, G., Canonaco, F., Prévôt, A. S. H., Nenes, A., Pandis, S. N., and Mihalopoulos, N.: Processing of biomass-burning aerosol in the eastern Mediterranean during summer-time, Atmos. Chem. Phys., 14, 479–4807, doi:10.5194/acp-14-4793-2014, 2014.
Boyd, C. M., Sanchez, J., Xu, L., Eugene, A. J., Nah, T., Tuet, W. Y., Guzman, M. I., and Ng, N. L.: Secondary organic aerosol formation from the β-pinene+NO3system: effect of humidity
and peroxy radical fate, Atmos. Chem. Phys., 15, 7497–7522, doi:10.5194/acp-15-7497-2015, 2015.
Budisulistiorini, S. H., Canagaratna, M. R., Croteau, P. L., Marth, W. J., Baumann, K., Edgerton, E. S., Shaw, S. L., Knipping, E. M., Worsnop, D. R., Jayne, J. T., Gold, A., and Surratt, J. D.: Real-Time Continuous Characterization of Secondary Or-ganic Aerosol Derived from Isoprene Epoxydiols in Down-town Atlanta, Georgia, Using the Aerodyne Aerosol Chemi-cal Speciation Monitor, Environ. Sci. Technol., 47, 5686–5694, doi:10.1021/es400023n, 2013.
Budisulistiorini, S. H., Canagaratna, M. R., Croteau, P. L., Bau-mann, K., Edgerton, E. S., Kollman, M. S., Ng, N. L., Verma, V., Shaw, S. L., Knipping, E. M., Worsnop, D. R., Jayne, J. T., We-ber, R.J., and Surratt, J. D.: Intercomparison of an Aerosol Chem-ical Speciation Monitor (ACSM) with ambient fine aerosol mea-surements in downtown Atlanta, Georgia, Atmos. Meas. Tech., 7, 1929–1941, doi:10.5194/amt-7-1929-2014, 2014.
Budisulistiorini, S. H., Li, X., Bairai, S. T., Renfro, J., Liu, Y., Liu, Y. J., McKinney, K. A., Martin, S. T., McNeill, V. F., Pye, H. O. T., Nenes, A., Neff, M. E., Stone, E. A., Mueller, S., Knote, C., Shaw, S. L., Zhang, Z., Gold, A., and Surratt, J. D.: Examining the effects of anthropogenic emissions on isoprene-derived secondary organic aerosol formation during the 2013 Southern Oxidant and Aerosol Study (SOAS) at the Look Rock, Tennessee ground site, Atmos. Chem. Phys., 15, 8871–8888, doi:10.5194/acp-15-8871-2015, 2015.
Butler, A. J., Andrew, M. S., and Russell, A. G.: Daily sampling of PM2.5in Atlanta: Results of the first year of the Assessment of
Spatial Aerosol Composition in Atlanta study, J. Geophys. Res., 108, SOS 3-1–SOS 3-11, doi:10.1029/2002JD002234, 2003. Chen, Q., Farmer, D. K., Rizzo, L. V., Pauliquevis, T., Kuwata, M.,
Karl, T. G., Guenther, A., Allan, J. D., Coe, H., Andreae, M. O., Pöschl, U., Jimenez, J. L., Artaxo, P., and Martin, S. T.: Submi-cron particle mass concentrations and sources in the Amazonian wet season (AMAZE-08), Atmos. Chem. Phys., 15, 3687–3701, doi:10.5194/acp-15-3687-2015, 2015.
Claeys, M., Iinuma, Y., Szmigielski, R., Surratt, J. D., Blockhuys, F., Van Alsenoy, C., Boge, O., Sierau, B., Gómez-González, Y., Vermeylen, R., Van der Veken, P., Shahgholi, M., Chan, A. W. H., Herrmann, H., Seinfeld, J. H., and Maenhaut, W.: Terpenylic Acid and Related Compounds from the Oxida-tion ofα-Pinene: Implications for New Particle Formation and Growth above Forests, Environ. Sci. Technol., 43, 6976–6982, doi:10.1021/es9007596, 2009.
Crippa, M., Canonaco, F., Lanz, V. A., Äijälä, M., Allan, J. D., Car-bone, S., Capes, G., Ceburnis, D., Dall’Osto, M., Day, D. A., De-Carlo, P. F., Ehn, M., Eriksson, A., Freney, E., Hildebrandt Ruiz, L., Hillamo, R., Jimenez, J. L., Junninen, H., Kiendler-Scharr, A., Kortelainen, A.-M., Kulmala, M., Laaksonen, A., Mensah,
A. A., Mohr, C., Nemitz, E., O’Dowd, C., Ovadnevaite, J., Pan-dis, S. N., Petäjä, T., Poulain, L., Saarikoski, S., Sellegri, K., Swietlicki, E., Tiitta, P., Worsnop, D. R., Baltensperger, U., and Prévôt, A. S. H.: Organic aerosol components derived from 25 AMS data sets across Europe using a consistent ME-2 based source apportionment approach, Atmos. Chem. Phys., 14, 6159– 6176, doi:10.5194/acp-14-6159-2014, 2014.
Cross, E. S., Slowik, J. G., Davidovits, P., Allan, J. D., Worsnop, D. R., Jayne, J. T., Lewis, D. K., Canagaratna, M., and Onasch, T. B.: Laboratory and Ambient Particle Density Determinations using Light Scattering in Conjunction with Aerosol Mass Spectrometry, Aerosol Sci. Technol., 41, 343–359, doi:10.1080/02786820701199736, 2007.
Docherty, K. S., Stone, E. A., Ulbrich, I. M., DeCarlo, P. F., Snyder, D. C., Schauer, J. J., Peltier, R. E., Weber, R. J., Murphy, S. M., Seinfeld, J. H., Grover, B. D., Eatough, D. J., and Jimenez, J. L.: Apportionment of Primary and Secondary Organic Aerosols in Southern California during the 2005 Study of Organic Aerosols in Riverside (SOAR-1), Environ. Sci. Technol., 42, 7655–7662, doi:10.1021/es8008166, 2008.
Edgerton, E. S., Hartsell, B. E., and Jansen, J. J.: Mercury Specia-tion in Coal-fired Power Plant Plumes Observed at Three Surface Sites in the Southeastern US, Environ. Sci. Technol., 40, 4563– 4570, doi:10.1021/es0515607, 2006.
Emanuelsson, E. U., Watne, K., Lutz, A., Ljungström, E., and Hal-lquist, M.: Influence of Humidity, Temperature, and Radicals on the Formation and Thermal Properties of Secondary Organic Aerosol (SOA) from Ozonolysis ofβ-Pinene, J. Phys. Chem. A, 117, 10346–10358, doi:10.1021/jp4010218, 2013.
Forster, P., Ramaswamy, V., Artaxo, P., Berntsen, T., Betts, R., Fa-hey, D. W., Haywood, J., Lean, J., Lowe, D. C., Myhre, G., Nganga, J., Prinn, R., Raga, G., Schulz, M., and Van Dorland, R.: Changes in Atmospheric Constituents and in Radiative Forc-ing, in: Climate Change 2007: The Physical Science Basis, Con-tribution of Working Group I to the Fourth Assessment Report of the Intergovernmental Panel on Climate Change, Cambridge University Press, Cambridge, United Kingdom and New York, NY, USA, 2007.
Fountoukis, C. and Nenes, A.: ISORROPIA II: a computa-tionally efficient thermodynamic equilibrium model for K+–
Ca2+–Mg2+–NH+
4–Na+–SO2 − 4 –NO
−
3–Cl−–H2O aerosols,
At-mos. Chem. Phys., 7, 4639–4659, doi:10.5194/acp-7-4639-2007, 2007.
Gao, S., Ng, N. L., Keywood, M., Varutbangkul, V., Bahreini, R., Nenes, A., He, J., Yoo, K. Y., Beauchamp, J. L., Hodyss, R. P., Flagan, R. C., and Seinfeld, J. H.: Particle Phase Acidity and Oligomer Formation in Secondary Organic Aerosol, Environ. Sci. Technol., 38, 6582–6589, doi:10.1021/es049125k, 2004. Gaston, C. J., Riedel, T. P., Zhang, Z., Gold, A., Surratt, J. D., and
Thornton, J. A.: Reactive Uptake of an Isoprene-Derived Epoxy-diol to Submicron Aerosol Particles, Environ. Sci. Technol., 48, 11178–11186, doi:10.1021/es5034266, 2014.
Guha, A., Gentner, D. R., Weber, R. J., Provencal, R., and Gold-stein, A. H.: Source apportionment of methane and nitrous ox-ide in California’s San Joaquin Valley at CalNex 2010 via posi-tive matrix factorization, Atmos. Chem. Phys., 15, 12043–12063, doi:10.5194/acp-15-12043-2015, 2015.
using MEGAN (Model of Emissions of Gases and Aerosols from Nature), Atmos. Chem. Phys., 6, 3181–3210, doi:10.5194/acp-6-3181-2006, 2006.
Guo, H., Xu, L., Bougiatioti, A., Cerully, K. M., Capps, S. L., Hite Jr., J. R., Carlton, A. G., Lee, S.-H., Bergin, M. H., Ng, N. L., Nenes, A., and Weber, R. J.: Fine-particle water and pH in the southeastern United States, Atmos. Chem. Phys., 15, 5211–5228, doi:10.5194/acp-15-5211-2015, 2015.
Hallquist, M., Wenger, J. C., Baltensperger, U., Rudich, Y., Simp-son, D., Claeys, M., Dommen, J., Donahue, N. M., George, C., Goldstein, A. H., Hamilton, J. F., Herrmann, H., Hoff-mann, T., Iinuma, Y., Jang, M., Jenkin, M. E., Jimenez, J. L., Kiendler-Scharr, A., Maenhaut, W., McFiggans, G., Mentel, Th. F., Monod, A., Prévôt, A. S. H., Seinfeld, J. H., Surratt, J. D., Szmigielski, R., and Wildt, J.: The formation, properties and im-pact of secondary organic aerosol: current and emerging issues, Atmos. Chem. Phys., 9, 5155–5236, doi:10.5194/acp-9-5155-2009, 2009.
Hansen, D. A., Edgerton, E. S., Hartsell, B. E., Jansen, J. J., Kandasamy, N., Hidy, G. M., and Blanchard, C. L.: The Southeastern Aerosol Research and Characterization Study: Part 1-Overview, JAPCA J. Air Waste Ma., 53, 1460–1471, doi:10.1080/10473289.2003.10466318, 2003.
Hu, W. W., Campuzano-Jost, P., Palm, B. B., Day, D. A., Ortega, A. M., Hayes, P. L., Krechmer, J. E., Chen, Q., Kuwata, M., Liu, Y. J., de Sá, S. S., McKinney, K., Martin, S. T., Hu, M., Budisulistiorini, S. H., Riva, M., Surratt, J. D., St. Clair, J. M., Isaacman-Van Wertz, G., Yee, L. D., Goldstein, A. H., Carbone, S., Brito, J., Artaxo, P., de Gouw, J. A., Koss, A., Wisthaler, A., Mikoviny, T., Karl, T., Kaser, L., Jud, W., Hansel, A., Docherty, K. S., Alexander, M. L., Robinson, N. H., Coe, H., Allan, J. D., Canagaratna, M. R., Paulot, F., and Jimenez, J. L.: Characteri-zation of a real-time tracer for isoprene epoxydiols-derived sec-ondary organic aerosol (IEPOX-SOA) from aerosol mass spec-trometer measurements, Atmos. Chem. Phys., 15, 11807–11833, doi:10.5194/acp-15-11807-2015, 2015.
IPCC: Climate Change 2013: The Physical Science Basis, Contri-bution of Working Group I to the Fifth Assessment Report to the Intergovernmental Panel on Climate Change, Cambridge Uni-versity Press, Cambridge, United Kingdom and New York, NY, USA, 2013.
Jacobs, M. I., Burke, W. J., and Elrod, M. J.: Kinetics of the re-actions of isoprene-derived hydroxynitrates: gas phase epoxide formation and solution phase hydrolysis, Atmos. Chem. Phys., 14, 8933–8946, doi:10.5194/acp-14-8933-2014, 2014.
Jimenez, J. L., Canagaratna, M. R., Donahue, N. M., Prévôt, A. S. H., Zhang, Q., Kroll, J. H., DeCarlo, P. F., Allan, J. D., Coe, H., Ng, N. L., Aiken, A. C., Docherty, K. S., Ulbrich, I. M., Grieshop, A. P., Robinson, A. L., Duplissy, J., Smith, J. D., Wil-son, K. R., Lanz, V. A., Hueglin, C., Sun, Y. L., Tian, J., Laak-sonen, A., Raatikainen, T., Rautiainen, J., Vaattovaara, P., Ehn, M., Kulmala, M., Tomlinson, J. M., Collins, D. R., Cubison, M. J. E., Dunlea, J., Huffman, J. A., Onasch, T. B., Alfarra, M. R., Williams, P. I., Bower, K., Kondo, Y., Schneider, J., Drewnick, F., Borrmann, S., Weimer, S., Demerjian, K., Salcedo, D., Cot-trell, L., Griffin, R., Takami, A., Miyoshi, T., Hatakeyama, S., Shimono, A., Sun, J. Y., Zhang, Y. M., Dzepina, K., Kimmel, J. R., Sueper, D., Jayne, J. T., Herndon, S. C., Trimborn, A. M., Williams, L. R., Wood, E. C., Middlebrook, A. M., Kolb,
C. E., Baltensperger, U., and Worsnop, D. R.: Evolution of Or-ganic Aerosols in the Atmosphere, Science, 326, 1525–1529, doi:10.1126/science.1180353, 2009.
Kanakidou, M., Seinfeld, J. H., Pandis, S. N., Barnes, I., Dentener, F. J., Facchini, M. C., Van Dingenen, R., Ervens, B., Nenes, A., Nielsen, C. J., Swietlicki, E., Putaud, J. P., Balkanski, Y., Fuzzi, S., Horth, J., Moortgat, G. K., Winterhalter, R., Myhre, C. E. L., Tsigaridis, K., Vignati, E., Stephanou, E. G., and Wilson, J.: Organic aerosol and global climate modelling: a review, At-mos. Chem. Phys., 5, 1053–1123, doi:10.5194/acp-5-1053-2005, 2005.
Ke, L., Ding, X., Tanner, R. L., Schauer, J. J., and Zheng, M.: Source contributions to carbonaceous aerosols in the Tennessee Valley Region, Atmos. Environ., 41, 8898–8923, doi:10.1016/j.atmosenv.2007.08.024, 2007.
Kim, E., Hopke, P. K., and Edgerton, E. S.: Source Iden-tification of Atlanta Aerosol by Positive Matrix Fac-torization, JAPCA J. Air Waste Ma., 53, 731–739, doi:10.1080/10473289.2003.10466209, 2003.
Krechmer, J. E., Coggon, M. M., Massoli, P., Nguyen, T. B., Crounse, J. D., Hu, W., Day, D. A., Tyndall, G. S., Henze, D. K., Rivera-Rios, J., Nowak, J. B., Kimmel, J. R., Mauldin, R. L., Stark, H., Jayne, J. T., Sipila, M., Junninen, H., Clair, J. M. S., Zhang, X., Feiner, P. A., Zhang, L., Miller, D. O., Brune, W. H., Keutsch, F. N., Wennberg, P. O., Seinfeld, J. H., Worsnop, D. R., Jimenez, J. L., and Canagaratna, M. R.: Formation of Low Volatility Organic Compounds and Sec-ondary Organic Aerosol from Isoprene Hydroxyhydroperoxide Low-NO Oxidation, Environ. Sci. Technol., 49, 10330–10339, doi:10.1021/acs.est.5b02031, 2015.
Lanz, V. A., Alfarra, M. R., Baltensperger, U., Buchmann, B., Hueglin, C., and Prévôt, A. S. H.: Source apportionment of sub-micron organic aerosols at an urban site by factor analytical mod-elling of aerosol mass spectra, Atmos. Chem. Phys., 7, 1503– 1522, doi:10.5194/acp-7-1503-2007, 2007.
Lee, S., Murphy, D. M., Thomson, D. S., and Middlebrook, A. M.: Chemical components of single particles measured with Par-ticle Analysis by Laser Mass Spectrometry (PALMS) during the Atlanta SuperSite Project: Focus on organic/sulfate, lead, soot, and mineral particles, J. Geophys. Res., 107, 4003–4015, doi:10.1029/2000JD000011, 2002.
Lin, Y., Budisulistiorini, S. H., Chu, K., Siejack, R. A., Zhang, H., Riva, M., Zhang, Z., Gold, A., Kautzman, K. E., and Surratt, J. D.: Light-Absorbing Oligomer Formation in Secondary Organic Aerosol from Reactive Uptake of Isoprene Epoxydiols, Environ. Sci. Technol., 48, 12012–12021, doi:10.1021/es503142b, 2014. Lin, Y.-H., Knipping, E. M., Edgerton, E. S., Shaw, S. L., and
Sur-ratt, J. D.: Investigating the influences of SO2and NH3levels on isoprene-derived secondary organic aerosol formation using con-ditional sampling approaches, Atmos. Chem. Phys., 13, 8457– 8470, doi:10.5194/acp-13-8457-2013, 2013a.