ACPD
3, 4097–4127, 2003Size-segregated aerosol mass closure
and chemical composition
J.-P. Putaud et al.
Title Page
Abstract Introduction
Conclusions References
Tables Figures
◭ ◮
◭ ◮
Back Close
Full Screen / Esc
Print Version
Interactive Discussion
©EGU 2003
Atmos. Chem. Phys. Discuss., 3, 4097–4127, 2003 www.atmos-chem-phys.org/acpd/3/4097/
© European Geosciences Union 2003
Atmospheric Chemistry and Physics Discussions
Size-segregated aerosol mass closure
and chemical composition in Monte
Cimone (I) during MINATROC
J.-P. Putaud1, R. Van Dingenen1, A. Dell’Acqua1, F. Raes1, E. Matta2, S. Decesari2, M. C. Facchini2, and S. Fuzzi2
1
European Commission, Joint Research Centre, Institute for Environment and Sustainability, Ispra (Va), Italy
2
Consiglio Nazionale delle Ricerche, Istituto delle Scienze dell’Atmosfera e del Clima, Bologna, Italy
ACPD
3, 4097–4127, 2003Size-segregated aerosol mass closure
and chemical composition
J.-P. Putaud et al.
Title Page
Abstract Introduction
Conclusions References
Tables Figures
◭ ◮
◭ ◮
Back Close
Full Screen / Esc
Print Version
Interactive Discussion
©EGU 2003
Abstract
Physical and chemical characterizations of the atmospheric aerosol was carried out at Mt. Cimone (Italy) during the 4 June–4 July 2000 period. Particle size distributions in the size range 6 nm-10µm were measured with a differential mobility analyzer (DMA) and a optical particle counter (OPC). Size-segregated aerosol was sampled using a 5
6-stage low pressure impactor. Aerosol samples were submitted to gravimetric and chemical analyses. Ionic, carbonaceous and refractory components of the aerosol were quantified. We compared the sub- and super-µm aerosol mass concentrations determined by gravimetric measurements (mGM), chemical analyses (mCA), and by converting particle size distribution to aerosol mass concentrations (mSD). Mean ran-10
dom uncertainties associated with the determination ofmGM, mCA, andmSD were
as-sessed. The three estimates of the sub-µm aerosol mass concentration agreed, which shows that within experimental uncertainty, the sub-µm aerosol was composed of the quantified components. The three estimates of the super-µm aerosol mass concentra-tion did not agree, which indicates that random uncertainties and/or possible system-15
atic errors in aerosol sampling, sizing or analyses were not adequately accounted for. Aerosol chemical composition in air masses from different origins showed differences, which were significant in regard to experimental uncertainties. During the Saharan dust advection period, coarse dust and fine anthropogenic particles were externally mixed. No anthropogenic sulfate could be found in the super-µm dust particles. In contrast, 20
nitrate was shifted towards the aerosol super-µm fraction in presence of desert dust.
1. Introduction
Due to the short atmospheric lifetime and complex chemical composition of atmo-spheric aerosols, their global distribution shows large regional differences and their radiative properties are poorly known. As a consequence, the radiative forcing by 25
ACPD
3, 4097–4127, 2003Size-segregated aerosol mass closure
and chemical composition
J.-P. Putaud et al.
Title Page
Abstract Introduction
Conclusions References
Tables Figures
◭ ◮
◭ ◮
Back Close
Full Screen / Esc
Print Version
Interactive Discussion
©EGU 2003
changes (IPCC, 2001). Very little is still known about the aerosol forcing related to the effect of particles on the size and number of cloud droplets. Not even best estimates of the current forcing by mineral dust can be given (IPCC, 2001). The parameters control-ling the aerosol direct and indirect radiative forcing can be calculated from the aerosol composition as a function of the particle size. Ideally, single particle size, composition, 5
(and shape) should be determined. Recently developed instruments based on aerody-namic sizing and time of flight mass spectroscopy are able to size and analyze on-line particles ranging in size from a few tens of nm to a fewµm (e.g. Carson et al., 1997; Ge et al., 1998). However, obtaining quantitative measurements is still challenging (Mur-phy et al., 1998). An alternative is to measure simultaneously but independently the 10
aerosol size distribution, chemical composition and mixing state. The consistency of the various complementary analytical techniques needed can be evaluated by closure experiments.
This work focuses on the size-segregated aerosol chemical composition observed during the first MINATROC (MINeral dust And TROpospheric Chemistry) field ex-15
periment at Mte Cimone, Italy (2165 m a.s.l.). We investigate how well the aerosol mass can be described as a mixture of the measured organic and inorganic aerosol components in the sub- and super-µm aerosol fractions. For this, we compare the aerosol size-segregated mass concentration determined from gravimetric measure-ments (mGM) with the aerosol volume calculated particle size distribution
measure-20
ments, from which we derive the aerosol mass estimate mSD. The aerosol size-segregated mass concentration determined from chemical analyses (mCA) is com-pared to mGM and mSD. The uncertainties associated with each of the methods
are quantified, and the differences between these independent estimates compared to these uncertainties.
25
ACPD
3, 4097–4127, 2003Size-segregated aerosol mass closure
and chemical composition
J.-P. Putaud et al.
Title Page
Abstract Introduction
Conclusions References
Tables Figures
◭ ◮
◭ ◮
Back Close
Full Screen / Esc
Print Version
Interactive Discussion
©EGU 2003
2. Experimental set-up
2.1. Site and meteorology
The measurements were made between 4 June and 4 July 2000 at the CNR Monte Cimone station (MTC, 44◦11′N–10◦42′E, 2165 m a.s.l.). MTC is located on the high-est summit of the Northern Appennines, and experiences long range transport of air 5
masses from Europe, the Mediterranean basin, and Africa, with on average 5 major dust outbreaks per year (Bonasoni et al., 1996). Ancillary measurements include me-teorology, CO2 and O3 (Bonasoni et al., 1996, 2000). During the experiment, hourly mean temperature, wind speed and relative humidity averaged 9.5◦C (range 4–18◦C), 5.6 m s−1(range 1–20 m s−1), and 74% (range 1–100%), respectively. Average diurnal 10
variations in CO2 concentration and standard deviation show that in summer during daytime, surface thermal winds cause up-slope flow that transports possibly polluted low altitude air to MTC (Fig. 1).
2.2. Aerosol mass concentration and chemical composition
2.2.1. Sampling 15
Aerosol was sampled from the terrace of the MTC station situated about 3 m above ground. Size-segregated aerosol was collected at ambient relative humidity over 11-hour periods (10:00–21:00, and 22:00–09:00 UTC) using a low-pressure 6-stage Berner impactor (LPI 80/0.05) loaded with half foils of aluminum and half foils of Ted-lar™. At the nominal flow rate of 80 L/min, the 50% aerodynamic cut-offdiameters of 20
ACPD
3, 4097–4127, 2003Size-segregated aerosol mass closure
and chemical composition
J.-P. Putaud et al.
Title Page
Abstract Introduction
Conclusions References
Tables Figures
◭ ◮
◭ ◮
Back Close
Full Screen / Esc
Print Version
Interactive Discussion
©EGU 2003
the virtual impactor’s 50% cut-offis 1.50±0.1 µm aerodynamic diameter. The Hi-Vol sampler was loaded with ashless cellulose filters (Whatman 41). The virtual impactor sampled on pre-fired quartz fiber filters (Schleicher & Schuell QF20).
2.2.2. Analyses
Low-pressure impactor stages 1–5 were analyzed. The half foils of aluminum were 5
used for gravimetric measurements of samples collected during the 17/06–04/07 period and for the analysis of organic carbon (OC) and black carbon (BC) of samples collected over the whole campaign period. They were weighed with a micro-balance (Sartorius, MC5) at RH= 23±3% and T = 24±1◦C (Putaud et al., 2000). The mass of carbon collected on the aluminum foils was determined using a thermal method (Evolved Gas 10
Analysis, EGA), where samples are exposed successively to 5 increasing temperature plateaus up to 650◦C in an oxygen-free carrier gas, and then in an oxygen-rich carrier gas at 650–750◦C (Putaud et al., 2000). The carbon evolved at T<650◦C in He is defined as OC but contains also carbonate, and the fraction evolved at T>650◦C in the oxidizing carrier gas is expected to be black carbon (BC). It appeared that the 15
phenomenon of charring was particularly acute when analyzing samples collected on aluminum foils. The amplitude of the charring effect was assessed over 20 samples collected with the same Berner impactor at the same place at MTC in August 2001. Each sample was divided into two half foils, one of which was exposed at 340◦C for 2 h in an oxidizing carrier gas (He:O280:20). This thermal treatment was shown to remove 20
most of the OC susceptible to be charred (Cachier et al., 1989). Both half foils were then analyzed using our routine method. BC was determined from the treated aliquot, and the difference in OC between the treated and not treated aliquot was interpreted as charred OC. The regression between the BC mass (µg) found on the treated half foil vs. the BC mass found on the non-treated half foil (BCtreated=0.60 BCnon−treated, R
2
=
25
0.97, n=20) was used to correct the BC data obtained from the non-treated samples collected during the Minatroc campaign.
ACPD
3, 4097–4127, 2003Size-segregated aerosol mass closure
and chemical composition
J.-P. Putaud et al.
Title Page
Abstract Introduction
Conclusions References
Tables Figures
◭ ◮
◭ ◮
Back Close
Full Screen / Esc
Print Version
Interactive Discussion
©EGU 2003
and analyzed by ion chromatography (Dionex 500) for Na+, NH+4, K+, Mg2+, Ca2+, ac-etate, formate, methanesulfonate (MSA), pyruvate, Cl−, NO−2, NO−3, SO24−, oxalate and for total water-soluble organic carbon (WSOC) with a Shimadzu TOC-5000A analyzer. Four quartz filter collected with the virtual impactor were extracted in 6 ml of ultrapure water. The extracts were concentrated to dryness and recovered with 1ml of deuterated 5
water for HNMR analysis. Spectra were recorded at 400 MHz in a 5 mm probe, with a Varian Mercury 400 spectrometer. A pre-saturation pulse sequence was adopted for suppression of the HDO signal (Decesari et al., 2000).
Cellulose filters collected with the Hi-Vol sampler were used for mineral dust quan-tification. Aliquots of filters were ashed at 600◦C for 8 h in quartz crucibles after extrac-10
tion of water soluble species in mQ™water. The residue, defined as mineral dust, was weighed using a microbalance (Sartorius, MC5). Amounts of mineral dust significantly higher than the blank level (1.0±0.8 µg/cm2) were observed in 90% of the analyzed samples.
2.2.3. Definition of the aerosol components 15
Except for NH+4, NO−3 and BC concentrations, which were directly obtained from mea-surements, the main aerosol components were defined as a combination of the ana-lyzed species. The regressions between K+, Mg2+, Ca2+ and SO24− on one side and Na+ on the other side indicate a common source for Na+and Mg2+at MTC (sea spray) but not for K+, Ca2+ and SO24−. Consequently, sea salt was calculated as the sum of 20
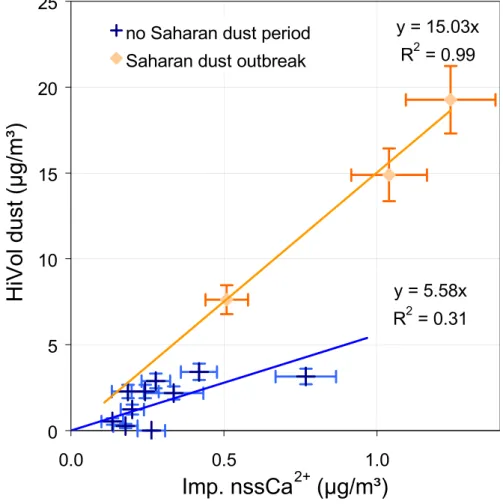
Na+, Mg2+, Cl−. The sea salt fractions of K+, Ca2+ and SO24− were calculated from the measured Na+concentrations and a standard sea water composition. The sea salt SO24−fraction was subtracted to measured SO24−to get non-sea salt sulfate (nssSO24−). The dust component was obtained from the regressions between Ca2+ and ash found in the Hi-Vol samples. Different correlations were observed between Ca2+and mineral 25
regres-ACPD
3, 4097–4127, 2003Size-segregated aerosol mass closure
and chemical composition
J.-P. Putaud et al.
Title Page
Abstract Introduction
Conclusions References
Tables Figures
◭ ◮
◭ ◮
Back Close
Full Screen / Esc
Print Version
Interactive Discussion
©EGU 2003
sions:
mineral dust=5.6×nssCa2+, for non Saharan dust periods (1a) mineral dust=15.0×nssCa2+, for the Saharan dust period (1b) were used to estimate the amount of mineral dust in each stage of the impactor for each period, based on measured amounts of Ca2+. The water soluble organic matter 5
(WSOM) was derived from measured WSOC using a mean molecular-to-carbon mass ratio equal to 1.9, corresponding to the raw molecular formulas for WSOM derived by HNMR functional group analysis (Fuzzi et al., 2001). Non-water soluble organic matter (NWSOM) was estimated as:
NWSOM=1.2(OC−WSOC). (2)
10
The 1.2 molecular-to-carbon mass ratio is the lower limit reported for urban organic matter (Gray et al., 1986) and corresponds to large saturated hydrocarbons. For each sample, the “unknown” fraction was calculated as the difference between the aerosol massmGM ormSD and the sum of the quantified aerosol componentsmCA.
2.2.4. Uncertainties 15
The weighing precision was±2 µg and the standard variation of the aluminum blank foils ±10µg (n=5). The precision of OC and BC determination was ±8%. The un-certainty in the slope of the regression between the BC mass from the non-treated aliquots and the BC mass from the treated aliquots was±0.03 (95% confidence level). Blank variability for the OC and BC fraction were ±1.7 and ±0.3 µg foil–1, respec-20
ACPD
3, 4097–4127, 2003Size-segregated aerosol mass closure
and chemical composition
J.-P. Putaud et al.
Title Page
Abstract Introduction
Conclusions References
Tables Figures
◭ ◮
◭ ◮
Back Close
Full Screen / Esc
Print Version
Interactive Discussion
©EGU 2003
arbitrary set to±0.1 for both WSOM and NWSOM, because eof the lack of data re-garding the variability of these ratios. The uncertainty in the slope of the regression between ash and nssCa2+ masses measured from the Hi-Vol filters was±2.1 for the 4 June–2 July period, and±1.73 for the 3–4 July period (95% confidence level). Finally, based on measurements performed later with an identical impactor, the uncertainty 5
in the sampling flow rate was estimated to± 10%. Tables 1 and 2 show how evolve the relative mean random uncertainties in each aerosol component and in the mass concentration estimatesmCA,mGM, andmSD, when sources of errors such analyses,
blank variability, conversion from species to aerosol components, and air volume deter-mination., are successively introduced. The law of propagation of errors (3) was used 10
to combine absolute uncertainties associated with the determination of non-correlated parameters. According to the law of propagation of errors, the random error S(y) of a variable y calculated as a function of n non-correlated parameters xi, y=f (x1,. . . , xi,
. . . ,xn), can be approximated by:
S2(y) = Σ{d f /dxi(x1, . . . , xi, . . . , xn)S(xi)}
2
, (3)
15
where (df/dxi) represents the partial derivative off with respect toxi andS(xi) is the
absolute uncertainty of parameterxi. For correlated parameters, such as the various
components of sea salt, absolute uncertainties were conservatively added. Uncertain-ties for the sub-µm aerosol range is also the sum of uncertainties for stages 1-3 of the impactor, and uncertainties for the super-µm range the sum of uncertainties for stages 20
4–5. The main source of uncertainty for the gravimetric method (mGM) was the vari-ability of the blank masses. For most aerosol components, the main source of random error is blank variability as well. Analytical precision is the largest source of random error only for NH+4, nssSO24−, and BC in the aerosol sub-µm fraction, and for NWSOM in both the super- and sub-µm fraction. The large uncertainty in NWSOM derives 25
ACPD
3, 4097–4127, 2003Size-segregated aerosol mass closure
and chemical composition
J.-P. Putaud et al.
Title Page
Abstract Introduction
Conclusions References
Tables Figures
◭ ◮
◭ ◮
Back Close
Full Screen / Esc
Print Version
Interactive Discussion
©EGU 2003
(mCA) was dominated by uncertainties in OM (OM=WSOM+NSOM) and nssSO24− for the sub-µm fraction, and by uncertainties in OM and dust for the super-µm fraction. In addition to random uncertainties, systematic errors can occur, related to inaccu-rate sampling or analytical techniques. Aerosol sampling with low-pressure impactors is suspected to be affected by negative artifacts, due to the volatilization of semi-volatile 5
particulate species. During Minatroc, sub-µm aerosol was collected and analyzed on-line at MTC using an artifact free sampler made of a wet annular denuder (WAD) com-bined with a steam jet aerosol collector (SJAC) built by ECN, Petten (Keuken et al., 1988; Khlystov et al., 1995). The correlation between the sub-µm NO−3 concentrations calculated from the impactor samples and the WAD-SJAC concentrations averaged 10
over the impactor sampling time show that the low-pressure impactor did not lead to systematically lower concentrations than the artifact free sampler. This suggests that no significant loss of semi-volatile compounds occurred in the low-pressure impactor in the conditions encountered during this campaign. Possible losses of coarse dust particles into the impactor are discussed in Sect. 3.
15
The determination of OM concentrations is also affected by possibly large systematic errors due to the lack of accurate data regarding the molecular mass-to-carbon mass ratio of organic aerosol in NWSOM, and to the uncertainties involved by the assump-tions needed to interpret HNMR data to determine the mean raw formula of WSOM. Such systematic uncertainties are very difficult to estimate.
20
2.3. Aerosol physical properties
2.3.1. Measurements
All instruments sampled from the same PM10 inlet located at 4 m above the terrace floor (Van Dingenen et al., this issue). Particle size distributions at 5±5% RH were measured with a 10-min time resolution in the size range 6–600 nm using a Vienna 25
ACPD
3, 4097–4127, 2003Size-segregated aerosol mass closure
and chemical composition
J.-P. Putaud et al.
Title Page
Abstract Introduction
Conclusions References
Tables Figures
◭ ◮
◭ ◮
Back Close
Full Screen / Esc
Print Version
Interactive Discussion
©EGU 2003
counter (OPC). The optical diameters determined by the OPC are converted to geo-metric diameters assuming spherical particles. A tandem-DMA was used to measure the aerosol growth factor from 0 to 90% RH at particle diameters of 10, 20, 50, 100 and 200 nm. Aerosol absorption coefficient was measured with an aethalometer ™(Magee AE-1).
5
2.3.2. Data processing
Particle number size distributions measured with the DMA and the OPC agreed well in the overlapping 300–600 nm range (Van Dingenen et al., this issue). Volume size distri-butions were calculated assuming that aerosol particles were spheres with a diameter equal to that measured by the instruments. DMA rather than OPC data were consid-10
ered in the 300–600 nm range, but this choice had no significant influence (<1%) on the aerosol volume determination. Volume size distributions in the size range 6 nm–10
µm were averaged over the impactor sampling periods.
2.3.3. Uncertainties
The possible error in DMA sizing due to the uncertainty in the air flow rates (±5%) are 15
−7,+5% of the particle diameter. The comparison with a condensation particle counter (CPC) indicates that the uncertainty in DMA counting was±2% (95% confidence level). According to the manufacturer, the reproducibility of the Grimm 1.108 OPC in particle counting is±2%. We assumed random uncertainties in particle sizing to ±10% and ±20% out and during the desert dust advection period, respectively. The overall ran-20
ACPD
3, 4097–4127, 2003Size-segregated aerosol mass closure
and chemical composition
J.-P. Putaud et al.
Title Page
Abstract Introduction
Conclusions References
Tables Figures
◭ ◮
◭ ◮
Back Close
Full Screen / Esc
Print Version
Interactive Discussion
©EGU 2003
3. Results and discussion
3.1. Mass closure
3.1.1. Comparison between the aerosol mass concentrations derived from gravimet-ric measurements and aerosol volume derived from particle size distributions.
Such a comparison requires first the conversion of the 50% aerodynamic cut-off diame-5
ters of the impactor operated at ambient temperature to geometric diameters measured in dry conditions in the particle sizing instruments. The aerodynamic diameter of a par-ticle at ambient relative humidity Daand its geometric diameter at 0% relative humidity Dg are linked by the relationship:
Dg =1/GFa×[Da/(da)1/2]×[Cc1/Ccd]1/2, (4)
10
whereGFaanddaare the particle growth factor and density at ambient relative
humid-ity, andCc1and Ccd are the slip correction factors for spheres with diametersDaand
Da ×d
−1/2
a , respectively. Variations in the slip correction factors are significant for
par-ticle diameters<0.2µm only. They were neglected in the conversion from aerodynamic to geometric cut-offdiameters.
15
The aerosol density at ambient RH (da) can be calculated by:
da=(d0+(GFa3−1)dw)/GFa3, (5)
whered0is the aerosol density at 0% relative humidity,dwis the density of water (=1.0)
andGFa the aerosol growth factor at ambient relative humidity.
Aerosol growth factor at 90% RH (GF90) were measured continuously at MTC during 20
this campaign (Van Dingenen et al., this issue). From the GF90 values averaged over the impactor sampling periods, the fractions of hygroscopic (α) and hygrophobic
ACPD
3, 4097–4127, 2003Size-segregated aerosol mass closure
and chemical composition
J.-P. Putaud et al.
Title Page
Abstract Introduction
Conclusions References
Tables Figures
◭ ◮
◭ ◮
Back Close
Full Screen / Esc
Print Version
Interactive Discussion
©EGU 2003
like (NH4)2SO4, and (2) hydrophobic aerosol do not grow at any RH, and the GF of a mixture can be calculated according to the formula (Virkkula et al., 1999):
GF903 =αGF903scopic+(1−α)GF903phobic. (6)
The coefficientαcalculated from (6) was used to estimate the aerosol growth factor at ambient relative humidity, based on the above mentioned assumptions (1) and (2): 5
GFa3=αGFa scopic3 +(1−α)GFa phobic3 . (7)
For each impactor sample, the geometric diameterDg(4) corresponding to the 50% cut-offdiameter of stage 4 (1.2µm aerodynamic diameter) was calculated for the dry aerosol density values 1.0, 1.5, 2.0 (this range of values largely covers the possible atmospheric dry aerosol density). This equivalent geometric diameterDg(4) was found 10
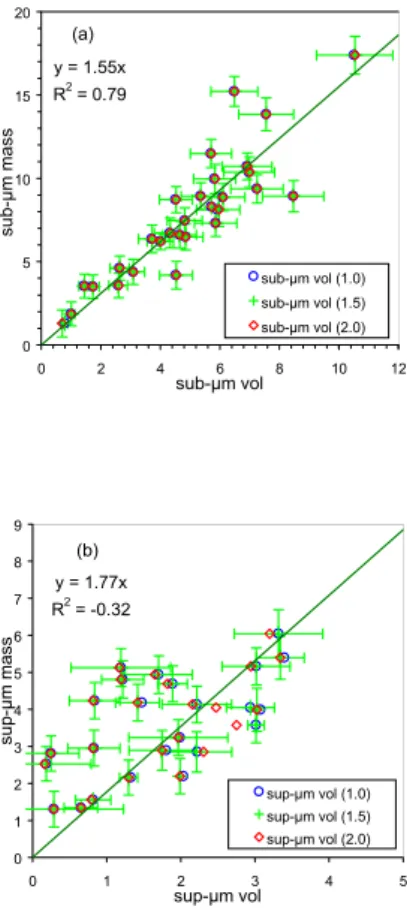
to be on average 0.95 ± 0.12 µm. The aerosol mass concentration measured on stages 1–3 of the impactor was then compared to the aerosol volume integrated up to the geometric diameter Dg(4) (Fig. 4a), and the aerosol mass concentration
mea-sured on stages 4 and 5 of the impactor to the aerosol volume integrated from to the geometric diameter Dg(4) to 10 µm (Fig. 4b). For the sub-µm aerosol range, a
15
good correlation is observed between the gravimetrically measured mass mGM and
the aerosol volume, independently of thea priori assumed dry aerosol density. The slope of the regression suggests that the density of the dry aerosol was in the range 1.55 ± 0.12 (95% confidence level) at MTC during the Minatroc campaign. For the periods when gravimetric measurements are not available, this regression together 20
with the size distribution measurements performed on these days were use to estimate the sub-µm aerosol mass mSD. The comparison between gravimetrically measured
mass and aerosol volume was carried out for each of the 3 sub-µm aerosol fractions resolved by the low-pressure impactor. A reasonable agreement could be found by as-suming that the 50% cut-offdiameter of stage 3 was 0.26 instead of the nominal 0.42 25
ACPD
3, 4097–4127, 2003Size-segregated aerosol mass closure
and chemical composition
J.-P. Putaud et al.
Title Page
Abstract Introduction
Conclusions References
Tables Figures
◭ ◮
◭ ◮
Back Close
Full Screen / Esc
Print Version
Interactive Discussion
©EGU 2003
indicates that the discrepancies between super-µm aerosol mass and volume are not systematically due to losses of coarse particles into the impactor. It shows that coarse particle sampling with the low-pressure impactor and/or counting with the OPC were affected by random uncertainties (sampling artifacts into the impactor, error in particle sizing, etc. . . ), which were not adequately accounted for.
5
3.1.2. Comparison between aerosol mass concentrations derived from gravimetric measurements and chemical analysis
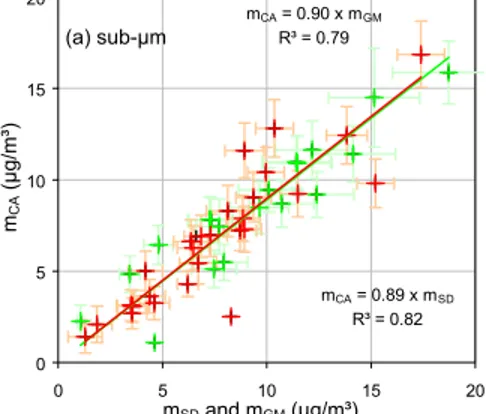
Sub- and super-µm aerosol mass concentrations derived from gravimetric measure-ments (mGM) and chemical analyses (mCA) are compared in Figs. 5a and 5b, respec-tively. A good correlation appears for the sub-µm aerosol fraction (slope=0.89, R2 =
10
0.82), but not for the super-µm fraction (slope=0.65, R2=0.58). To comparemGM and
mCA with regard to the uncertainty of each method, the absolute difference between two methods ∆ =|mCA−mGM| was compared with the uncertainty in this difference
(S∆), which can be estimated according to Eq. (3) as:
S(∆)2=S(mCA)2+S(mGM)2. (8)
15
Mean relative uncertainties σ(∆) in the difference and relative differences between the two methodsδ(mGM,mCA), respectively defined by:
σ(∆)=S(∆)/m (9)
δ(mGM, mCA)=(∆)/m, (10)
wherem =average (mGM, mCA), are listed in Table 3. For the sub-µm aerosol frac-20
tion, δ(mGM, mCA) < σ(∆), which means that the difference betweenmGM and mCA
are not statistically significant. This shows that the quantified aerosol components ad-equately describe the sub-µm aerosol mass. In contrast, for the super-µm fraction,
δ(mGM, mCA)> σ(∆), which indicates that differences in aerosol the aerosol mass de-termined from chemical analyses g(mGM) compared to gravimetry (mCA) were larger
ACPD
3, 4097–4127, 2003Size-segregated aerosol mass closure
and chemical composition
J.-P. Putaud et al.
Title Page
Abstract Introduction
Conclusions References
Tables Figures
◭ ◮
◭ ◮
Back Close
Full Screen / Esc
Print Version
Interactive Discussion
©EGU 2003
than the estimated random errors. This suggests that systematic errors might not have been adequately taken into account.
3.2. Aerosol chemical composition in various particle size classes and air masses
Numerous parameters such as relative humidity, CO2concentration and standard devi-ation, aerosol absorption coefficient (Babs) indicate that during the Minatroc campaign, 5
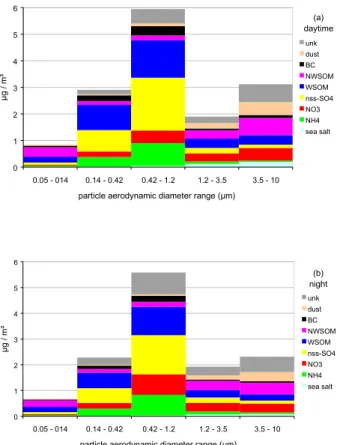
MTC was reached from about 08:00 to 21:00 UTC by air masses coming from low altitude and therefore possibly affected by local pollution. Impactor measurements show also that aerosol concentration was on average 30% higher during day-time compared to night-time, mainly due to enhanced mass concentrations in stages 2 (0.14 < Da <0.42µm) and 5 (3.46 < Da <10µm). However, the chemical
composi-10
tion in each size fraction did not vary much between night and day (Fig. 6). Particles with Da < 0.14µm (stage 1) were mainly made of carbonaceous species. The con-tribution of carbonaceous components decreased for stages 2 and 3, and increased again for stages 4 and 5. This was mainly due to variations in the NSWOM contribu-tion, since the one of WSOM was quite similar in each size fraction (22±7%). NssSO24− 15
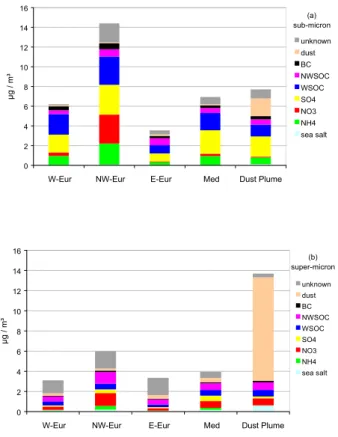
and NH+4 were mainly found into sub-µm particles, whereas NO−3 was more equally dis-tributed over the 5 size fractions. Sea-salt and dust were almost exclusively present in the super-µm aerosol fraction. The air masses reaching MTC over the impactor night-time sampling periods (21:00–09:00 UTC) were classified into 5 categories (W-Europe, NW-Europe, E-Europe, Mediterranean) based on 3-D back trajectories calculated by 20
Balkanski et al. (2003) and observation of super-µm particle number (indicating the Saharan dust outbreak). The sub- and super-µm aerosol chemical compositions de-termined from nighttime impactor samples corresponding to air masses of clearly iden-tified origins are indicated in Table 4 and 5 and presented in Fig. 7. It should be noted that the variability in the composition of both size fractions is high, even in air masses 25
ACPD
3, 4097–4127, 2003Size-segregated aerosol mass closure
and chemical composition
J.-P. Putaud et al.
Title Page
Abstract Introduction
Conclusions References
Tables Figures
◭ ◮
◭ ◮
Back Close
Full Screen / Esc
Print Version
Interactive Discussion
©EGU 2003
concentration was >20% for 3 among 5 samples collected in air masses from NW-Europe origin, which is much higher than what was observed in any other type of air mass. In contrast, sub-µm aerosol in air masses from E-Europe origin was for more than 50% made of carbonaceous matter, due to specially high contribution of NWSOM and BC. The molar ratio NH+4 / (NO−3 +2×nssSO24−) also suggests that sub-µm was 5
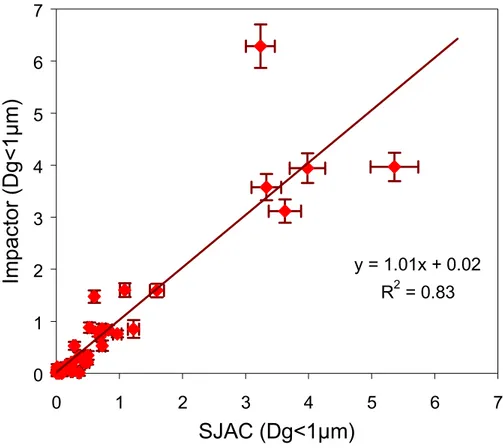
acidic in air masses from E-Europe and Mediterranean origin only. In air masses from Mediterranean origin, nssSO24− was on average the main single component, and could make up to 50% of the aerosol mass in some samples. Despite a large uncertainty, it appears that mineral dust was a major component of the sub-µm aerosol during the Saharan dust outbreak. However, no Ca2+ was observed in the sub-µm aerosol col-10
lected with the SJAC. The occurrence of mineral dust in the sub-µm aerosol fraction might therefore result form the bouncing of non-sticky particles into the impactor. The super-µm aerosol chemical composition is presented is Table 5. It should be kept in mind that chemical closure was not reached for the super-µm fraction, which indicates that overall uncertainties were larger than estimated. It was characterized by a rather 15
constant contribution of sea-salt with regard to uncertainties. The large contribution of NO−3 observed for air masses with NW-European origin (20±6%) and Mediterranean origin (15%) were not significantly different from others with respect to uncertainties. The contribution of mineral dust to the super-µm aerosol mass concentration was the highest during the Saharan dust outbreak. During this event, the nssSO24−/nssCa2+ 20
ratio observed at MTC in the super-µm aerosol averaged 0.4 ± 0.1. Alpine glacier ice-cores (Schwikowski et al., 1995) and IC analyses of Saharan sand fine grain sam-ples suggest that the SO24−/Ca2+ mass ratio should be about 0.4-0.6 in pure Saharan dust. This shows that super-µm nssSO24− was probably of pure Saharan origin during the dust outbreak. In contrast, large amounts of excess-SO24− were still present in the 25
ACPD
3, 4097–4127, 2003Size-segregated aerosol mass closure
and chemical composition
J.-P. Putaud et al.
Title Page
Abstract Introduction
Conclusions References
Tables Figures
◭ ◮
◭ ◮
Back Close
Full Screen / Esc
Print Version
Interactive Discussion
©EGU 2003
coarse fraction (coarseNO−3/total NO−3 =88±1%). This value is not significantly higher than the value observed in air masses from Mediterranean and E-Europe origin, in which large contribution of dust to the super-µm aerosol mass was also observed, but significantly higher that in air masses from W-and NW-Europe origin (coarseNO−3/total NO−3 =47±23%). This suggests that in presence of coarse dust particles, NO−3 shifts 5
to the aerosol super-µm fraction due to the adsorption of HNO3 onto dust particles, leading to the displacement to the right of the equilibrium:
NH4NO3←→HNO3+NH3 (11)
4. Conclusions
For the Minatroc campaign at MTC, the mean random uncertainties in the determi-10
nation of sub- and super-µm aerosol mass concentrations from gravimetric measure-ments (mGM), chemical analyses (mCA), and particle size distribution measurements
(mSD) ranged between ±14 and ±29%. The main sources of random uncertainties were blank variability formGM andmCA, and particle sizing formSD. Additional possi-ble systematic error affecting mainly the conversion factors used to determine WSOM 15
and NWSOM concentrations cannot be estimated. The comparison ofmCAwithmGM
and mSD shows that average differences were within experimental uncertainties for the sub-µm aerosol fraction. This indicates that within experimental uncertainties, the sub-µm aerosol was made of the ionic, carbonaceous and refractory components we quantified. In contrast, mass closure was not obtained for the aerosol super-µm 20
fraction. This shows that the sources of random and/or systematic errors associated with the determination ofmCA,mGM and mSD for the super-µm aerosol fraction were not fully understood. Taking into account analytical uncertainties, we found significant differences in the sub-µm aerosol composition in air masses from different origins. The largest contribution of NO−3 was observed in air masses from NW-Europe origin, 25
ACPD
3, 4097–4127, 2003Size-segregated aerosol mass closure
and chemical composition
J.-P. Putaud et al.
Title Page
Abstract Introduction
Conclusions References
Tables Figures
◭ ◮
◭ ◮
Back Close
Full Screen / Esc
Print Version
Interactive Discussion
©EGU 2003
components in air masses from E-Europe origin. The difference in sub- and super-µm chemical composition during the Saharan dust outbreak suggests that Saharan dust and anthropogenic particles were externally mixed. No interaction between SO2 and dust could be detected from our measurements. In contrast, the displacement of NO−3 towards the aerosol super-µm fraction in presence of dust coarse particles suggests a 5
significant interaction of HNO3with dust particles. This suggests that the interaction of secondary aerosol precursors with pre-existing primary particles should be taken into account in secondary aerosol formation modeling.
Acknowledgements. This work was supported by the EC contract EVK2-CT-1999-00003 (MI-NATROC).
10
References
Balkanski, Y., Bauer S. E., Van Dingenen R., Bonasoni P., Schulz M., Fischer H., Gobbi G. P., Hanke M., Hauglustaine D., Putaud J. P., Stohl, A., and Raes, F.: The Mt Cimone, Italy, free tropospheric campaign: principal characteristics of the gaseous and aerosol composition from European pollution, Mediterranean influences and during African dust events, Atmos. 15
Chem. Phys. Discuss., 3, 1753–1776, 2003.
Bonasoni, P., Colombo, T., Lenaz, R., Giovanelli, G., Evangelisti, F., Ravegnani, F., Santaguida, R., and Tesi, G.: Effect of Saharan dust transport on ozone and carbon dioxide concentra-tions – The impact of African dust across the Mediterranean, Envir. Sci. Technol. Lib. Kluwer Academic Publ., 313–322, 1996.
20
Bonasoni, P., Stohl, A., Cristofanelli, P., Calzolari, F., Colombo, T., and Evangelisti, F.: Back-ground ozone variations at Mt. Cimone, Atmos. Environ. 34, 5183–5189, 2000.
Cachier, H., Bremond M. P., and Buat-M ´enard, P.: Determination of atmospheric soot carbon with a simple thermal method, Tellus 41B, 379–390, 1989.
Carson, P. G., Johnston, M. V., and Wexler, A. S.: Real time monitoring of the surface and total 25
composition of atmospheric particles, Aeros. Sci. and Technol., 26, 291–300, 1997.
ACPD
3, 4097–4127, 2003Size-segregated aerosol mass closure
and chemical composition
J.-P. Putaud et al.
Title Page
Abstract Introduction
Conclusions References
Tables Figures
◭ ◮
◭ ◮
Back Close
Full Screen / Esc
Print Version
Interactive Discussion
©EGU 2003
Fuzzi, S., Decesari, S., Facchini, M.C., Matta, E., Mircea, M., and Tagliavini, E.: A symplified model of the water soluble organc component of atmospheric aerosol, Geophys. Res. Lett. 20, 4079–4082, 2001.
Ge, Z., Wexler, A. S., and Johnston, M. V.: Laser desorption/ionization of single ultrafine multi-component aerosols, Environ. Sci. and Technol., 32, 3218–3223, 1998.
5
Gray, H. A., Cass, R. G., Huntzicker, J. J., Heyrdahl, E. K., and Rau, J. A.: Characteristics of atmospheric organic and elemental carbon particle concentrations in Los Angeles, Environ. Sci. Technol. 20, 580–589, 1986.
IPCC, Climate Change 2001: The scientific basis. Contribution of Working Group I to the third assessment report of the Intergovernmental Panel on Climate Change [Houghton, J.T., Y. 10
Ding, D.J. Griggs, M. Noguer, P.J. van der Linden, X. Dai, K. Maskell, and C.A. Johnson (eds.)]. Cambridge University Press, Cambridge, United Kingdom and New York, NY, USA, 881 pp, 2001.
Keuken, M. P., Schoonebeeek, C. A. M., van Wensveen-Louter, A., and Slanina, J.: Simulta-neous sampling of NH3, HNO3, HCl, SO2, and H2O2 in ambient air by wet annular denuder 15
system, Atmos. Environ. 22, 2541–2548, 1988.
Khlystov, A., Wyers G. P., and Slanina, J.: The steam jet aerosol collector, Atmos. Environ. 29, 2229–2234, 1995.
Loo, B. W. and Cork, C. P.: Development of a high efficiency virtual impactor, Aerosol Sci. Technol.9,167–176, 1988.
20
Murphy, D. M., Thomson, D. S., and Mahoney, M. J.: In situ measurement of organics, me-teoritic material and other elements in aerosol at 5 to 19 km, Science, 282, 1664–1669, 1998.
Putaud, J. P., Van Dingenen, R., Mangoni, M., Virkkula, A., Raes, F., Maring, H., Prospero, J. M., Swietlicki, E., Berg, O. H., Hillamo, R., and M ¨akel ¨a, T.: Chemical mass closure and 25
assessment of the origin of the submicron aerosol in the marine boundary layer and the free troposphere at Tenerife during ACE-2, Tellus 52B, 141–168, 2000.
Schwikowski, M., Seibert, P., Baltensberger, U., and G ¨aggeler, H. W.: A study of an outstanding Saharan dust event at the high-alpine site Jungfraujoch, Switzerland, Atmos. Environ. 29, 1829–1842, 1995.
30
ACPD
3, 4097–4127, 2003Size-segregated aerosol mass closure
and chemical composition
J.-P. Putaud et al.
Title Page
Abstract Introduction
Conclusions References
Tables Figures
◭ ◮
◭ ◮
Back Close
Full Screen / Esc
Print Version
Interactive Discussion
©EGU 2003
ACPD
3, 4097–4127, 2003Size-segregated aerosol mass closure
and chemical composition
J.-P. Putaud et al.
Title Page Abstract Introduction Conclusions References Tables Figures ◭ ◮ ◭ ◮ Back Close
Full Screen / Esc
Print Version
Interactive Discussion
©EGU 2003
Table 1.Evolution of the mean relative uncertainties S(xi)/xi(%) in sub-µm aerosol component and mass concentrations at MTC when various sources of errors are successively taken into account out of the desert dust advection period. Also indicated are the overall uncertiainty in these parameters for the desert dust advection period and main sources of errors
' ()* (+, +* -+! (-+! ." "& /! %# 0
$ 1 1 1 1 1 23 3 1 4 , 1 5
$6%$ 12 45 2 5* 5 3 4 * 27
$6%$
6
51 4 2 7 43 *
$6%$
66
12 7 4, 51 4 , 2 7 2 75 *
+ % $ $ % $ $ % $ $ $ % $ % $ % $ % $ 89 $6%$ 66
*3 * 5 ** 5 5 3 45 *
ACPD
3, 4097–4127, 2003Size-segregated aerosol mass closure
and chemical composition
J.-P. Putaud et al.
Title Page Abstract Introduction Conclusions References Tables Figures ◭ ◮ ◭ ◮ Back Close
Full Screen / Esc
Print Version
Interactive Discussion
©EGU 2003
Table 2.Same as Table 1 for the super-µm aerosol
' ()* (+, +* -+! (-+! ." "& /! %# 0
$ 1 1 7 2 53 3 5 7 , * 53
$6%$ ,* ,3 5 1* , 53 ,, 55 1 11
$6%$
6
1* ,5 ,, , 2 55
$6%$
66
,2 ,3 , 7 11 ,5 5 ,* , 1 25 55
+ % $ % $ % $ % $ % $ $ $6 % % $ % $ % $ 89
4 5* 7 , , 51 7 4 2 *3 *
ACPD
3, 4097–4127, 2003Size-segregated aerosol mass closure
and chemical composition
J.-P. Putaud et al.
Title Page
Abstract Introduction
Conclusions References
Tables Figures
◭ ◮
◭ ◮
Back Close
Full Screen / Esc
Print Version
Interactive Discussion
©EGU 2003
Table 3. Magnitude of the relative differences and uncertainties in the relative difference be-tween mCA, and mGM, in the sub- and super-µm aerosol fractions at MTC
Sub-µm Super-µm Relative differenceδ(mCA, mC
GM
betweenmCAandmGM (%) 17 37
Relative uncertaintyδ(mCA, mC
GMof the difference
ACPD
3, 4097–4127, 2003Size-segregated aerosol mass closure
and chemical composition
J.-P. Putaud et al.
Title Page
Abstract Introduction
Conclusions References
Tables Figures
◭ ◮
◭ ◮
Back Close
Full Screen / Esc
Print Version
Interactive Discussion
©EGU 2003
Table 4. Average composition, standard deviation and error of the mean (all in %) for the sub-µm aerosol fraction in air masses from various origins
!"# !$
% &$ '&$( !'&$( )* +,
'- ./ 0 . /./ 1. %. 1./ 2.% 0.3 .
.% %.1 .3 4.1 2.3 1. 0. .2/ 0%.4
!'- / .2 0/. 04. . . %.2 .1 .1 0%
. %.% 0/. 3. 1.1 %.1 0.% . 0
-- / .4 2.4 0.3 . . 3 2.1 1. .3
.3 .2 .4 /./ /.% 03 .2 0% 0/
( .2 0%. . %2. . 0 .3 .0 2.0
. /.2 %./ 0%. 4.3 00 . .0 %
56 0.2 4.0 0. 1. 02 1. .% % 00
.2 .3 .0 ./ 3. .3 ./ 2.4 00
ACPD
3, 4097–4127, 2003Size-segregated aerosol mass closure
and chemical composition
J.-P. Putaud et al.
Title Page
Abstract Introduction
Conclusions References
Tables Figures
◭ ◮
◭ ◮
Back Close
Full Screen / Esc
Print Version
Interactive Discussion
©EGU 2003
Table 5.Same as Table 4 (all in %) for the super-µm aerosol fraction
!"#
!$%
&$
'&$( !'&$( )* +,
'- % ./ . 00 %.4 0 0 . 2. %
0.2 .3 .1 .1 .% .0 ./ . /.1
!'- % 2.4 %. /.% 0 0/ .% /.2 %
./ 0.1 /.2 0. 0. 0. 0. %. 1.%
-- / .3 0.4 1.0 2. 3. .4 4.%
.4 0.3 %.2 1.% %. 0 0.0 ./ 0
( 0 /.0 0.1 02 ./ 2.3 .4 03 3
56 .4 .% 2.% 0./ 2./ 1. 0.0 1% .0
0.% . %. .% . %.2 . 2.0 2.4
ACPD
3, 4097–4127, 2003Size-segregated aerosol mass closure
and chemical composition
J.-P. Putaud et al.
Title Page
Abstract Introduction
Conclusions References
Tables Figures
◭ ◮
◭ ◮
Back Close
Full Screen / Esc
Print Version
Interactive Discussion
©EGU 2003
ACPD
3, 4097–4127, 2003Size-segregated aerosol mass closure
and chemical composition
J.-P. Putaud et al.
Title Page
Abstract Introduction
Conclusions References
Tables Figures
◭ ◮
◭ ◮
Back Close
Full Screen / Esc
Print Version
Interactive Discussion
©EGU 2003
!"#$
%
&'
(
)
*
+
,
!"
#
$
(-./*+,0/&(* -./*+,(+,1/02
ACPD
3, 4097–4127, 2003Size-segregated aerosol mass closure
and chemical composition
J.-P. Putaud et al.
Title Page
Abstract Introduction
Conclusions References
Tables Figures
◭ ◮
◭ ◮
Back Close
Full Screen / Esc
Print Version
Interactive Discussion
©EGU 2003
-34"5!
6
,(
/
"
5
!
ACPD
3, 4097–4127, 2003Size-segregated aerosol mass closure
and chemical composition
J.-P. Putaud et al.
Title Page
Abstract Introduction
Conclusions References
Tables Figures
◭ ◮
◭ ◮
Back Close
Full Screen / Esc
Print Version
Interactive Discussion
©EGU 2003
+17!()
+
17
!
+17!() +17!() +17!()
7
+7!()
+
7!
+7!() +7!() +7!() 1
ACPD
3, 4097–4127, 2003Size-segregated aerosol mass closure
and chemical composition
J.-P. Putaud et al.
Title Page
Abstract Introduction
Conclusions References
Tables Figures
◭ ◮
◭ ◮
Back Close
Full Screen / Esc
Print Version
Interactive Discussion
©EGU 2003
-*89!"#$
4
!"
#
$
+17!
489
$
4
-$
89!"#$
4
!"
#
$
1+7! 489
$
ACPD
3, 4097–4127, 2003Size-segregated aerosol mass closure
and chemical composition
J.-P. Putaud et al.
Title Page
Abstract Introduction
Conclusions References
Tables Figures
◭ ◮
◭ ◮
Back Close
Full Screen / Esc
Print Version
Interactive Discussion
©EGU 2003
7 7 7 7 7
/,&6)00/(*&6*&0,0//"0!
!"
#
$
+2
*+, : ;<-9 <-9 7-; ;% 0),
*,&0
7 7 7 7 7
/,&6)00/(*&6*&0,0//"0!
!"
#
$
+2
*+, : ;<-9 <-9 7-; ;% 0),
1 &".,
ACPD
3, 4097–4127, 2003Size-segregated aerosol mass closure
and chemical composition
J.-P. Putaud et al.
Title Page
Abstract Introduction
Conclusions References
Tables Figures
◭ ◮
◭ ◮
Back Close
Full Screen / Esc
Print Version
Interactive Discussion
©EGU 2003
<7=+/ ;<7=+/ =7=+/ 90* +,>)+0
!"
#
$
+2(?
*+, : ; < -; ;% 0),
+17&6/(
<7=+/ ;<7=+/ =7=+/ 90* +,>)+0
!"
#
$
+2(?
*+, : ; < -; ;% 0),
1 +0/7&6/(