Klaudia Burka
Tomasz Bold
Iwona Grabowska-Bold
COMPUTATIONAL CHALLENGES
IN THE MEASUREMENT
OF HEAVY-ION COLLISION
EVENT CHARACTERISTICS
WITH THE ATLAS EXPERIMENT
AT THE LHC
Abstract Heavy-ion collisions at extreme energies are expected to recreate conditions present in the early universe, producing a state of matter called the Quark Gluon Plasma (QGP). This state is characterized by very low viscosity resem-bling the properties of a perfect fluid. In such a medium, density fluctuations can easily propagate. In experimental practice, the size of these fluctuations is estimated by measuring the angular correlation of the particles produced. The aim of this paper is to present results of the measurements of the az-imuthal anisotropy of charged particles produced in heavy-ion collisions with the ATLAS detector using the LHC Grid infrastructure for bulk processing of the data and resources available at the Tier-2 computing center for the final analysis stage.
Keywords high energy physics, ATLAS experiment, heavy-ion collisions, Grid computing, statistical methods
Citation Computer Science 16 (1) 2015: 39–54
1. Introduction
The Large Hadron Collider (LHC) [6, 12] is the largest and most powerful particle accelerator built thus far. It is situated at the European Organization for Nuclear Research (CERN). LHC experiments have been collecting data since the fall of 2009. Most of the experimental time at the LHC is dedicated to proton-proton physics at a center-of-mass energy of 7 TeV for data collected in 2011 (and 8 TeV in 2012). However, part of the collision time is also devoted to heavy-ion (HI) physics, when lead ions are collided. There are four main experiments collecting collision data at the LHC. One of them is ATLAS [2]. For a recent review of ATLAS results, see [10, 19]. In the domain of HI physics, the research program of the experiment aims to elucidate the properties of the QGP [28].
The ATLAS electronic readout consists of several million channels. With a colli-sion frequency of 20 MHz in 2011/12, the raw-data rate out of the detector surpassed 0.5 PB/s. The physics processes of interest are less frequent, and the initial rate is reduced to interesting collisions only by the three-staged trigger system. The first level is built with custom electronics implementing a hard-real-time system capable of taking the decision within 2.5 µs while reducing the rate of accepted events to about 100 kHz. Further, rate reduction is achieved with an additional two levels of the trigger system. It is implemented as a farm of 15k cores of commodity computers and reduces the rate of accepted events to about ∼400 Hz performing finer filtering of the incoming data [3]. The data rate to disk reaches about 700 MB/s. The raw data is promptly reconstructed at Tier-0 located at CERN, and derived formats are distributed to Grid sites for analysis.
detectors, this flow phenomenon can be studied in more detail. Experimentally, the flow manifests itself as a significant anisotropy of the particle momenta in a plane perpendicular to beam direction. Azimuthal flow is commonly characterized by co-efficients, vn, of the Fourier expansion of the particle azimuthal angle distributions
[30]. The most extensively-studied coefficient is the second harmonic, v2, which pre-dominantly originates from the elliptical shape of the collision zone in non-central HI collisions. The v2 in central collisions and higher harmonics are sensitive to the initial spatial fluctuations of interacting nuclei, and their non-vanishing values up to v6 are observed.
In this paper, the measurements of the second harmonic (v2) of the Fourier decomposition of the charged particles in lead-lead (Pb+Pb) collisions with the AT-LAS detector at the LHC are presented. There are a number of techniques that are used for flow measurements; however, the simplest yet most robust are favored. The study is focused on validating a superior newer technique as comparison to previously-established measurements [9, 4].
2. Grid computing for ATLAS experiment
The ATLAS detector [2] provides nearly full solid-angle coverage around the interac-tion point (IP) with tracking detectors, calorimeters and muon chambers, which are well suited for measurements of correlations over a large pseudorapidity range.
In ATLAS, at least one collision takes place every 50 ns; i.e., with a frequency of 20 MHz (Run I). The trigger output rate has increased over the years to∼400 Hz in 2012, giving more than 5.5×10⁹
recorded physics collisions. In 2010, experiments at the LHC produced their nominal 15 PB of data per year. Since then, they have increased to 23 PB in 2011 and 27 PB in 2012. About 10% of that volume is used by the Pb+Pb and p+Pb data set.
Due to the large amount of data, the ATLAS computing model embraces the Grid paradigm as well as a high degree of decentralization and sharing of computing resources. The required amount of computing resources is vital to the operation of ATLAS in a way that was not the case for previous CERN-based experiments.
The primary event processing occurs at CERN in a Tier-0 facility shared among LHC experiments. It has a capacity of about 68 000 cores, which is about a third of the LHC computing Grid total capacity of approximately 235 000 cores. Tier-0 is linked with the Tier-1 centers (which are typically regional research institutes), and each is connected with a series of Tier-2 computer centers (mostly situated in universities). The bandwidth used by LHC experiments is impressive: 1.5–2 GB/s flow continuously from CERN to the Tier-1 centers, and the worldwide flow of LHC-related data is 7.5–10 GB/s.
CPU-intensive parts. Data from both the MC and detector simulations are then reconstructed by the same reconstruction programs.
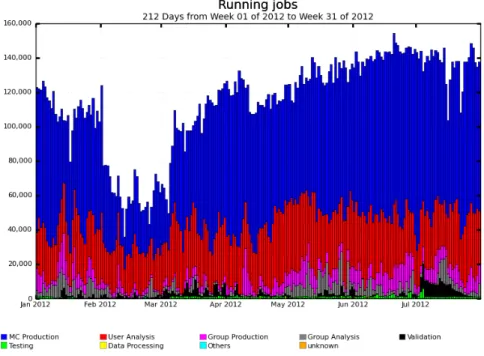
The final stage is the analysis itself. Figure 2 shows the number of completed tasks in the Grid per day in the ATLAS experiment in 2012. The tasks are broken up into various categories, with MC production and user analyses being the top consumers. A smaller fraction of jobs are needed for specific MC group productions as well as analyses performed by a group rather than a single analyzer. A fraction of the time is also used for validation of new MC simulations and Grid infrastructure testing.
Reconstruction
Analysis MC simulation
Detector data
Figure 1.Schematic view of the main LHC data processing stages. The shaded box represents the detector data for which virtually no processing is needed, while hollow boxes represent
a stage of processing on the Grid.
2.1. Grid computing in Poland
In Poland, the ATLAS experiment is supported by two computing centers: Academic Computing CenterCyfronetAGH in Krakow, and Supercomputing and Networking
Center in Poznan. Both are members of the Polish Tier-2 organization. Within this support, ATLAS software is provided and computational resources are granted.
Among Polish sites,Cyfronet is the largest, with a dedicated support for
AT-LAS users. One of the Cyfronet supercomputers isZeus which has 25468 cores,
a computational power of 374 TFLOPS, 60 TB of RAM, and disk storage with a ca-pacity of 2.3 PB. As of this writing (2014), this is currently the most powerful com-puter cluster in Poland. For more information, see [1]. Zeus can perform∼8 million
computing tasks per year. This can considerably reduce the computation time and allow for analysis of large-scale scientific problems. The Zeus cluster has been used
to obtain the results presented in this paper.
3. The HI collisions
Several stages in HI collisions can be distinguished. At the initial stage (before the actual collision), two nuclei are brought to collision at a speed close to the speed of light, which results in the Lorentz contraction of the nuclei along the direction of flight. Since the nuclei’s transversal dimensions are not affected, collisions with var-ious degrees of overlap can occur. The degree of overlap can be described by means of the impact parameter, defined as the distance between the centers of the two col-liding nuclei. Collisions with an impact parameter near zero are called central, while collisions with an impact parameter approaching 2 times the radius of the nuclei are called peripheral. In peripheral collisions, only a small fraction of nucleons participate in the collisions. The nucleons outside the overlap region (called spectators) travel almost intact along the beam direction.
In the early stages of the collision, hard scatterings take place. A large amount of energy is deposited in a small region of space and in a short duration of time. Matter in the collision zone has very high energy density and temperature, which could be sufficient to reach the phase-transition condition. The huge pressure gradient inside the interaction region leads to a rapid expansion of the system. The QGP cools down, and the quarks and gluons combine back into hadrons (this process is thus called hadronization). The particles produced are then measured by the detector.
4. Elliptic flow
y
z
x
Px Pz Py
Nucleus of a lead atom
Nucleus of a lead atom
Reac tion
Plan e
b
Figure 3.Sketch of the HI non-central collision and expansion of the resulting fireball. An or-ange almond-shaped region denotes the collision zone (left) and hydrodynamically expanded plasma (right), while the pink shapes represent spectators. The reaction plane is represented as a mesh. The coordinate system is chosen so that the impact parameter is in thexdirection
of the system andzis along the initial direction of the nucleons.
Customarily, the produced particle distribution measured with respect to the reaction plane is expanded in a Fourier series [29, 16]:
2π N
dN dφ = 1 +
∞
X
n=1
2vncos[n(φ−Φn)] =
∞
X
n=−∞
vneinΦne−inφ, (1)
whereφis the azimuthal angle of a charged particle, vnis the amplitude of anisotropic
flow in the n−th harmonic, and Φn is the corresponding symmetry angle. The vn
amplitudes can be calculated as:
vn =hcos [n(φi−Φn)]i, (2)
where the angle brackets denote an average over all particles in all events. The vn
co-efficients are functions of rapidity and transverse momentum. The sine terms are negligible. The first harmonic, v1, calleddirected flow, describes the sideward motion of fragments in ultra-relativistic nuclear collisions, and it carries early information from the collision. The second harmonic, elliptic flow – v2, measures the ellipti-cal shape of the distribution of the particles’ momenta in the transverse plane. The higher-order coefficients (v3–triangular flow, v4–quadrangular flow etc.) are impor-tant, as they provide insight into the initial-state geometric fluctuations which arise from fluctuations in the initial position of the nucleons within the nuclei. The Fourier vncoefficients are measured to be non-zero up to 6-th mode, which itself is the
indica-tion of the very low shear viscosity to entropy ratio of the QGP medium [21, 24, 22]. Centrality of the HI collision is defined in ATLAS using the total transverse energy in the Forward Calorimeter (FCal) (3.2 <|η| <4.9) [9]. All collision events are divided into percentile intervals based on their FCal ΣETvalues.
y
x
ϕ
Φn
b z
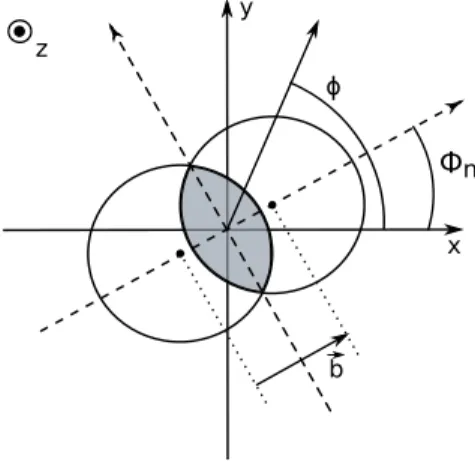
Figure 4. Transverse view of a non-central HI collision. An overlap region is marked by a shaded area. The azimuthal angle φof an example particle produced in such a collision, the impact parameterband the reaction plane angle Φnare shown. Nuclei move along the
z axis [11].
plane angle, Φn, as shown in Figure 4, is the angle between the reaction plane and
the laboratory frame. The Φn can not be directly measured, but its estimate, event
plane angle, Ψn, can be calculated from the particle azimuthal distribution for every
event. The flow coefficients can be measured by the particle azimuthal correlations with Ψn [20].
5. Event Plane and Scalar Product
Several techniques are used to measure azimuthal anisotropies. In this paper, the standard event plane method (denoted EP) and the scalar product method (de-noted SP) are compared. The event flow vector, −→Qn, is defined as −→Qn ≡
(|Qn|cos(nΨn),|Qn|sin(nΨn)) for each harmonic. For a given set of N particles
belonging to the same event, the flow vector can be written as [16]:
Qn=|Qn|einΨn≡
1
N
X
j
einφj, (3)
where the sum goes over all particles in the considered set of particles and φj is the
azimuthal angle of the particle. The Q1 describes the average angle of the particles in the event. The event plane angle is the azimuthal angle ofQn, denoted as:
Ψn=
1
narctg
Q
y
Qx
. (4)
whereQxandQyare projections of theQvector onto the laboratory frame axes. The
Qn vectors can be measured in regions of phase space (sub-events), which is exploited
The correction to the measurement has to be applied, as the number of particles is limited; therefore, statistical fluctuations cause the measured reaction plane angle Φn to differ from Ψn. The measurement is corrected as follows:
vn=
vobs n
R , (5)
where R is event plane resolution correction. The Rcoefficient is a function of cen-trality and is different for each harmonic n. To find theRexperimentally, one has to divide particles from each event into independent ”sub-events” (in this application, two sub-events are used). The Qn vectors are measured in regions of the detector,
andR can be obtained as:
R=DQAn QBn∗/|QAn||QBn|
E1/2
=
q
hcos(n[ΨA
n −ΨBn])i, (6)
where QA
n, ΨAn and QBn, ΨBn are the Q vectors and event plane angles estimated
in the reference detectors (FCals) located symmetrically in forward (side A) and backward (side B) ATLAS detector regions. Due to the oddness of the sine function, the imaginary part of the resolution is vanishing.
Then-th Fourier harmonic in the EP method is defined as follows [17]:
vEP
n =
D
QnQ
A∗
n
|QA
n|
E
R . (7)
It is obtained as a function of centrality, pseudorapidity,η, and transverse momentum,
pTand averaged over all events.
Besides the correlations between the particles induced by the genuine flow phe-nomena, there are also other sources of possible correlations. They are usually referred to as non-flow, and examples are the correlation of particles within the jets and res-onance decays. They are characterized by a shorter (in pseudorapidity) correlation range. Therefore, in order to suppress the non-flow correlations, the separation in pseudorapidity has to be assured. This is the flow vector, Qn, in the detector of
interest, here the Inner Detector (ID) [2] is correlated with the flow vector in the ref-erence, QA
n, FCal at the opposite η side of the detector, allowing the pseudorapidity
separation of 3.2 units at minimum in ATLAS experimental conditions.
It has been recently discovered that the underlying vn is not a unique function
of centrality; conversely, it fluctuates from event to event [15]. In this case, the vEP n
method is biased in the experiment-dependent fashion. It actually does not estimate the mean value of true vnbut some other quantity in betweenhvniandphvn2i. Such
a property of the observable makes comparisons between the experiments a harder task, as it requires that the resolution corrections have the same magnitudes. This, in turn, is only possible if the same detectors and phase space are used to obtain
QA
n and QBn. For this reason, an alternative method, Scalar Product (SP), has been
the measured quantity is always the p
hvn2i. Its application is very similar to the
EP, as the Q vectors have to be found in the same way as in the EP method. But they are combined in order to obtain the flow amplitude:
vSP
n =
D
QnQAn∗
E
r D
QA nQBn∗
E. (8)
The elliptic flow estimated with the SP method is expected to differ by a small percentage of the measurements obtained with the EP method. For higher harmonics, this difference is supposed to be larger due to fluctuations [17].
6. Implementation
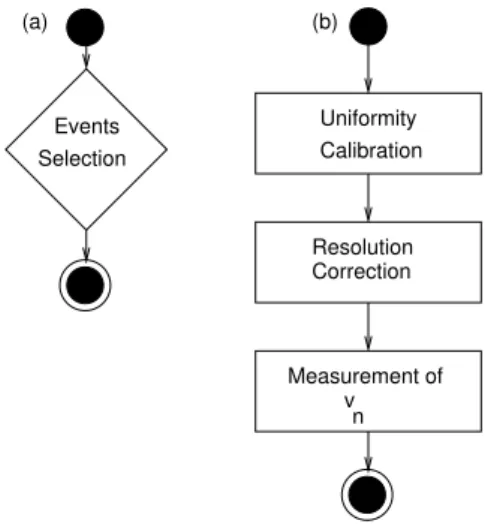
The data collected by the ATLAS experiment is divided into so-calledruns. Custom-arily, one run stands for the period in which the collisions were stable at the nominal collision energy. The analysis starts with the event selection (see Fig. 5a). The cri-teria applied in this analysis are: the confirmation of the collision and at least one reconstructed primary vertex. In the next analysis steps, additional fine-tuning of the event selection is added. This step of the analysis is performed on the Grid, as the data volume disallows for the processing at Tier-2. The task is divided into a number of jobs by the ATLAS custom job submission system [18] and executed in parallel at many Grid sites. Therefore, the output data is stored at multiple sites.
Events
Measurement of v
n
(a) (b)
Selection Calibration
Uniformity
Resolution Correction
Figure 5.Schematic view of the analysis procedure: (a) the event selection step yielding the reduced data set, (b) the steps of the analysis procedure resulting the elliptic flow
measure-ment.
the relevant information (to be described later). In order to accelerate the analysis loop, these formats are further slimmed down by removing quantities and collision events of no interest for a given analysis. After the slimming down, data volume is about 50 TB. If a final size of the data set can be reduced to a few TB, then the data can be stored in Tier-2 computing centers and processed using a local-batch system, allowing for a shorter analysis cycle. This is the case for the analy-sis presented here. A portion of ∼4 TB was analyzed frequently, while processing of the entire data set involving submission to the Grid was performed only a few times. Specifically, the analysis presented in this paper has been done on one run of Pb+Pb collisions at 2.76 TeV recorded in November 2010. The data is stored at theCyfronet computer center. In this run, about 6.5 million collision events were
recorded; however, only about 3 million pass the event selection, which amounts to aforementioned∼4 TB of data. This data set consists of 1600 files, each containing about 2·103
events.
The time needed to perform the v2 calculation step on this amount of data sequentially is about 160 h. Hence, the processing is divided into about 400 smaller jobs with only a few input files in each of them, and sent simultaneously to the queue on theZeuscluster as anarray job. This approach reduces the whole processing time
to about 2 hours, thus allowing for a significantly-faster turnaround of the analysis process.
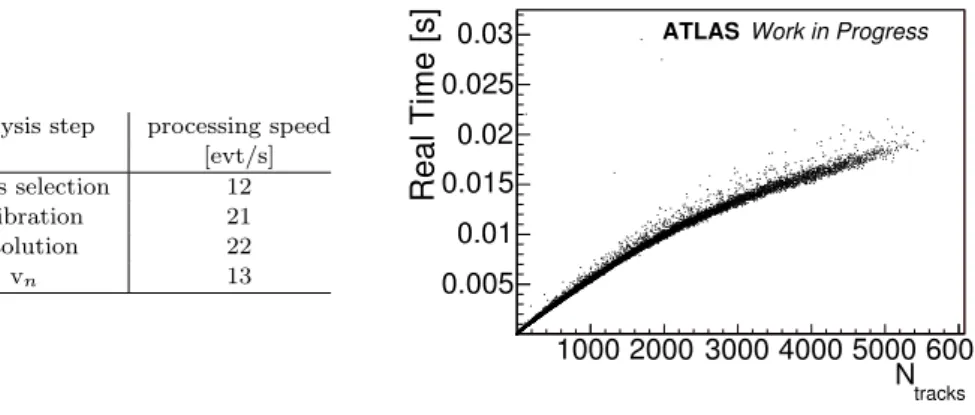
analysis step processing speed [evt/s] events selection 12
calibration 21 resolution 22
vn 13
tracks N 1000 2000 3000 4000 5000 6000
Real Time [s]
0.005 0.01 0.015 0.02 0.025
0.03 ATLAS Work in Progress
Figure 6. Event processing rate in the analysis steps (left table) and processing time per event of the last stage of the v2calculation as a function of the number of tracks (right plot).
After all selections are done, the methods of elliptic flow measurements are imple-mented as shown in Figure 5b. The first analysis step is the calculation of corrections for non-uniform detector acceptances. They are based on the assumption that there should be statistically no preferred direction of physics processes. This step is fairly simple and performed once per given data set; thus, only a small amount of process-ing time is consumed. In the next step, resolution correction is calculated. The first loop goes over the sub-events which correspond to the A and B sides of the refer-ence detector. For each event, the complex vectors,QA
n andQBn, are found and then
correlated with each other (to measure the denominator of Eqs. 7 and 8). This step is computationally more expensive; but on the other hand, it needs to be computed only once for a given event selection and then reused in the following analysis.
In the next step, the actual calculation of the v2is performed. The loops run over the tracks in the ID. For eachφangle of the track, in a given pseudorapidity range, flow vectorQnis correlated withQAn orQBn in order to estimate the numerator of Eqs. 7 and
8. Finally, the obtained v2 is averaged over the events in a given centrality interval, transverse momentum, pT, and pseudorapidity,|η|. This step is the most expensive computationally and is repeated several times in the analysis-code development and later for the estimation of systematic effects. Therefore, it dominates the overall processing time required for the analysis, as summarized in Figure 6. Processing time grows with the number of charged particle tracks analyzed per event, as also shown in Figure 6. In all stages, the throughput is partially determined by the data access that can be estimated from the throughput value of the relatively-trivial-events selection step. In this step, the computation related to the selection is minimal while the even data needs to be read in and a fraction of it written out.
7. Results
The resolution corrections for both methods were determined from the FCal in the pseudorapidity range 3.2<|η|<4.8 and are shown in Figure 7 (left). The 1% of the most central collisions (which corresponds to FCal ΣET>3.46 TeV) are excluded from the analysis due to the imprecision in the estimation of the resolution correction. For 30% of the most peripheral collisions (FCal ΣET<0.11 TeV), resolution corrections drop to very low values; for this reason, these events are also not considered.
[TeV] T E
∑
FCal 0 0.5 1 1.5 2 2.5 3 3.5 4R -3 10 -2 10 -1 10 1
EP n = 2 SP n = 2
1%
20-30%
70%
Work in Progress ATLAS
| < 4.8 η 3.2 < |
[GeV]
T
p
0 2 4 6 8 10 12
2 v 0.05 0.1 0.15 0.2 0.25 30-40% {SP} 2 v {EP} 2 v ATLAS {EP} 2 v
| < 1
η
|
Work in Progress
ATLAS
Figure 7. (left) Resolution correction as a function of FCal ΣET for EP (full points) and
SP (open dots) methods. (right) Elliptic flow measured using the EP and SP methods in centrality bin 30–40% forpT ranging from 0.5–12 GeV, and in the pseudorapidity interval
|η|<1. The v2{EP}AT LASpoints come from [9].
[GeV]
T
p
0 2 4 6 8 10 12
SP 2 / v EP 2 v 0.85 0.9 0.95 1 1.05 1.1 1.15 1-10%
Work in Progress
ATLAS |<1 η | [GeV] T p
0 2 4 6 8 10 12
SP 2 / v EP 2 v 0.85 0.9 0.95 1 1.05 1.1 1.15 10-20% [GeV] T p
0 2 4 6 8 10 12
SP 2 / v EP 2 v 0.85 0.9 0.95 1 1.05 1.1 1.15 20-30% [GeV] T p
0 2 4 6 8 10 12
SP 2
/ v
EP v2
0.85 0.9 0.95 1 1.05 1.1 1.15 30-40% [GeV] T p
0 2 4 6 8 10 12
SP 2 / v EP 2 v 0.85 0.9 0.95 1 1.05 1.1 1.15 40-50% [GeV] T p
0 2 4 6 8 10 12
SP 2 / v EP 2 v 0.85 0.9 0.95 1 1.05 1.1 1.15 50-60% [GeV] T p
0 2 4 6 8 10 12
SP 2 / v EP 2 v 0.85 0.9 0.95 1 1.05 1.1 1.15 1.2 1.25 60-70%
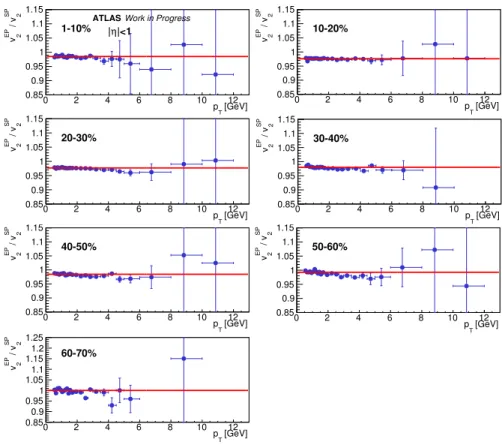
Figure 8.Ratios of elliptic flow coefficients, vEP 2 /v
SP
2 , measured with the EP and SP methods
8. Conclusions
The second Fourier harmonic, v2, has been measured with the EP and SP methods in the ATLAS experiment in Pb+Pb collisions at√sNN= 2.76 TeV using tracks of charged particles in the pseudorapidity range of |η| <1 and transverse momentum
pT from 0.5 to 12 GeV. The similar pT dependence for both methods is found in the centrality range of 1–70%. It has been demonstrated that the SP method gives systematically higher values of v2in comparison to the EP method, which is consistent with the predictions from [17].
Analysis of the enormous amount of data collected by the ATLAS experiment has only been possible due to the excellent Grid performance. However, in routine data analysis, a fast turnaround is essential. Therefore, data analysis on a fraction of the available data is performed in rapidly-available resources of Tier-2. The presented analysis is an example of such an arrangement where a significant reduction in analysis time was possible. This has been made possible thanks to the Tier-2 infrastructure available atCyfronet.
Acknowledgements
The authors would like to thank the ATLAS Collaboration for providing data for this analysis and ACK CyfronetAGH for giving us the opportunity to present our work
at the KU KDM14 conference. We would like to thank the Faculty of Physics and Applied Computer Science, AGH UST for financial support. This work was supported in part by the National Science Center grant No. DEC-2011/03/B/ST2/02631. This research was supported in part by PL-Grid Infrastructure.
References
[1] ACK Cyfronet AGH. http://www.cyfronet.krakow.pl/.
[2] ATLAS Collaboration: The ATLAS Experiment at the CERN Large Hadron Collider. JINST, vol. 3, p. S08003, 2008.
http://dx.doi.org/10.1088/1748-0221/3/08/S08003.
[3] ATLAS Collaboration: Performance of the ATLAS Trigger System in 2010. Eur. Phys. J., vol. C72, p. 1849, 2012.
http://dx.doi.org/10.1140/epjc/s10052-011-1849-1.
[4] ATLAS Collaboration: Measurement of the centrality and pseudorapidity de-pendence of the integrated elliptic flow in lead-lead collisions at √sNN = 2.76 TeV with the ATLAS detector. Eur. Phys. J., vol. C74(8), p. 2982, 2014. http://dx.doi.org/10.1140/epjc/s10052-014-2982-4.
[6] Br¨uning O. S., Collier P., Lebrun P., Meyers S., Ostojic R., Poole J., Proudlock P.: LHC Design Report. CERN, Geneva, 2004.
[7] Chaudhuri A. K.: Dissipative hydrodynamics and heavy-ion collisions. Journal of Physics G: Nuclear and Particle Physics, vol. 35(10), p. 104015, 2008. http://stacks.iop.org/0954-3899/35/i=10/a=104015.
[8] ALICE Collaboration: Elliptic flow of charged particles in Pb-Pb collisions at 2.76 TeV. Phys. Rev. Lett., vol. 105, p. 252302, 2010.
http://dx.doi.org/10.1103/PhysRevLett.105.252302.
[9] ATLAS Collaboration: Measurement of the pseudorapidity and transverse mo-mentum dependence of the elliptic flow of charged particles in lead-lead colli-sions at √sN N = 2.76 TeV with the ATLAS detector. Phys. Lett., vol. B707,
pp. 330–348, 2012. http://dx.doi.org/10.1016/j.physletb.2011.12.056. [10] ATLAS Collaboration: Observation of a new particle in the search for the
Stan-dard Model Higgs Boson with the ATLAS detector at the LHC. Phys. Lett., vol. B716, pp. 1–29, 2012. ISSN 0370-2693.
http://dx.doi.org/http://dx.doi.org/10.1016/j.physletb.2012.08.020. [11] CMS Collaboration: Measurement of the elliptic anisotropy of charged particles
produced in PbPb collisions at nucleon-nucleon center-of-mass energy = 2.76 TeV. Phys. Rev., vol. C87, p. 014902, 2013.
http://dx.doi.org/10.1103/PhysRevC.87.014902.
[12] Evans L., Bryant P.: LHC Machine. Journal of Instrumentation, vol. 3(08), p. S08001, 2008. http://stacks.iop.org/1748-0221/3/i=08/a=S08001. [13] Huovinen P., Kolb P., Heinz U. W., Ruuskanen P., Voloshin S.: Radial and elliptic
flow at RHIC: Further predictions.Phys. Lett., vol. B503, pp. 58–64, 2001.http: //dx.doi.org/10.1016/S0370-2693(01)00219-2.
[14] Kovtun P. K., Son D. T., Starinets A. O.: Viscosity in Strongly Interacting Quan-tum Field Theories from Black Hole Physics.Phys. Rev. Lett., vol. 94, p. 111601, 2005. http://dx.doi.org/10.1103/PhysRevLett.94.111601.
[15] Lunin O., Mathur S.D.: Statistical interpretation of Bekenstein entropy for systems with a stretched horizon. Phys. Rev. Lett., vol. 88, p. 211303, 2002. http://dx.doi.org/10.1103/PhysRevLett.88.211303.
[16] Luzum M.: Flow fluctuations and long-range correlations: elliptic flow and be-yond. J. Phys., vol. G38, p. 124026, 2011.
http://dx.doi.org/10.1088/0954-3899/38/12/124026.
[17] Luzum M., Ollitrault J.Y.: Eliminating experimental bias in anisotropic-flow measurements of high-energy nuclear collisions. Phys. Rev., vol. C87, p. 044907, 2013. http://dx.doi.org/10.1103/PhysRevC.87.044907.
[19] Mu˜no P. C., the Atlas Collaboration: Overview of Recent ATLAS Physics Results. Journal of Physics: Conference Series, vol. 447(1), p. 012014, 2013.
http://stacks.iop.org/1742-6596/447/i=1/a=012014.
[20] Poskanzer A. M., Voloshin S. A.: Methods for analyzing anisotropic flow in rela-tivistic nuclear collisions. Phys. Rev., vol. C58, pp. 1671–1678, 1998.
http://dx.doi.org/10.1103/PhysRevC.58.1671.
[21] Qin G. Y., Petersen H., Bass S. A., M¨uller B.: Translation of collision geometry fluctuations into momentum anisotropies in relativistic heavy-ion collisions.Phys. Rev. C, vol. 82, p. 064903, 2010.
http://dx.doi.org/10.1103/PhysRevC.82.064903.
[22] Qiu Z., Heinz U. W.: Event-by-event shape and flow fluctuations of relativistic heavy-ion collision fireballs. Phys. Rev., vol. C84, p. 024911, 2011.
http://dx.doi.org/10.1103/PhysRevC.84.024911.
[23] Romatschke P.: New Developments in Relativistic Viscous Hydrodynamics. Int. J. Mod. Phys., vol. E19, pp. 1–53, 2010.
http://dx.doi.org/10.1142/S0218301310014613.
[24] Schenke B., Jeon S., Gale C.: Anisotropic flow in√s= 2.76 TeV Pb+Pb collisions at the LHC. Phys. Lett., vol. B702, pp. 59–63, 2011.
http://dx.doi.org/10.1016/j.physletb.2011.06.065.
[25] Snellings R.: Anisotropic flow from RHIC to the LHC. Eur. Phys. J., vol. C49, pp. 87–90, 2007. http://dx.doi.org/10.1140/epjc/s10052-006-0107-4. [26] Song H.: Hydrodynamic Modeling and the QGP Shear Viscosity. Eur. Phys. J.,
vol. A48, p. 163, 2012. http://dx.doi.org/10.1140/epja/i2012-12163-9. [27] STAR Collaboration: Elliptic flow from two and four particle correlations in
Au+Au collisions at √sN N = 130 GeV. Phys. Rev., vol. C66, p. 034904, 2002.
http://dx.doi.org/10.1103/PhysRevC.66.034904.
[28] Steinberg P.: What have we learned about the Quark-Gluon Plasma with the ATLAS detector at the LHC? Nucl. Phys., vol. A, 2014.
[29] Voloshin S., Zhang Y.: Flow study in relativistic nuclear collisions by Fourier expansion of azimuthal particle distributions. Zeitschrift f¨ur Physik C Particles and Fields, vol. 70(4), pp. 665–671, 1996. ISSN 0170-9739.
http://dx.doi.org/10.1007/s002880050141.
Affiliations
Klaudia Burka
AGH University of Science and Technology, Krakow, Poland,[email protected],
http://www.agh.edu.pl
Tomasz Bold
AGH University of Science and Technology, Krakow, Poland,[email protected],
http://www.agh.edu.pl
Iwona Grabowska-Bold
AGH University of Science and Technology, Krakow, Poland,[email protected],
http://www.agh.edu.pl