___________________________
Corresponding author:Domagoj Šimi , Agricultural Institute Osijek, Južno predgra e 17,
HR-31103 Osijek, Croatia; Phone: ++385 31 515 521, e-mail: domagoj.simic@poljinos.hr
UDC 575.633.15 DOI: 10.2298/GENSR1402343J
Original scientific paper
ARRAY-BASED GENOTYPING AND GENETIC DISSIMILARITY ANALYSIS OF A SET OF MAIZE INBRED LINES BELONGING
TO DIFFERENT HETEROTIC GROUPS
Antun JAMBROVI 1, Maja MAZUR1, Zvonko RADAN2, Zvonimir ZDUNI 1, Tatjana
LEDEN AN1, Andrija BRKI 1, Josip BRKI 1, Ivan BRKI 1, and Domagoj ŠIMI 1
1 Agricultural Institute Osijek, Osijek, Croatia
2 Fermopromet d.o.o., Novi Bezdan, Baranjsko Petrovo Selo, Croatia
Jambrovi A., M. Mazur, Z. Radan, Z. Zduni , T. Leden an, A. Brki , J. Brki , I. Brki , and D. Šimi (2014): Array-based genotyping and genetic dissimilarity analysis of a set of maize inbred lines belonging to different heterotic groups -Genetika, Vol 46, No. 2, 343-352.
Here we describe the results of the detailed array-based genotyping obtained by using the Illumina MaizeSNP50 BeadChip of eleven inbred lines belonging to different heterotic groups relevant for maize breeding in Southeast Europe - European Corn Belt. The objectives of this study were to assess the utility of the MaizeSNP50 BeadChip platform by determining its descriptive power and to assess genetic dissimilarity of the inbred lines. The distribution of the SNPs was found not completely uniform among chromosomes, but average call rate was very high (97.9%) and number of polymorphic loci was 33200 out of 50074 SNPs with known mapping position indicating descriptive power of the MaizeSNP50 BeadChip. The dendrogram obtained from UPGMA cluster analysis as well as principal component analysis (PCA) confirmed pedigree information, undoubtedly distinguishing lines according to their background in two population varieties of Reid Yellow Dent and Lancaster Sure Crop. Dissimilarity analysis showed that all of the inbred lines could be distinguished from each other. Whereas cluster analysis did not definitely differentiate Mo17 and Ohio inbred lines, PCA revealed clear genetic differences between them.
The studied inbred lines were confirmed to be genetically diverse, representing a large proportion of the genetic variation occurring in two maize heterotic groups.
Key words:dissimilarity, inbred lines, maize, single nucleotide
INTRODUCTION
The identification of large numbers of molecular markers in human and the simultaneous development of high-throughput technologies allow the genotyping of many thousands to millions of such markers using highly miniaturized genotype calling arrays (also called chips). In crop plants, single nucleotide polymorphisms (SNPs) are increasingly becoming the molecular marker of choice in genetic analyses due to rapid development of the high-throughput methods for their detection and consequently, SNPs are now being used to design genotyping arrays containing thousands of markers spread over the entire genome to analyze large numbers of samples (GANAL et al., 2009).
In maize, the recent completion of the genome reference sequence (SCHNABLE et al.,
2009) allowing the physical mapping of SNPs and other variations to the maize chromosomes permit the development and testing of highly informative, easy to use and robust genotyping platforms for this species. One of them is a large scale SNP genotyping array (GANAL et al.,
2011) developed by Illumina, Inc. (San Diego, CA, USA) under the name of MaizeSNP50 Bead-Chip. This is the first high-density 50 K SNP array based on SNP markers selected to be preferentially located in genes and evenly distributed across the genome (MARTIN, 2010). It has been tested with a large set of maize germplasm, including North American and European inbred lines, parent/hybrid combinations, and distantly related teosinte materials. This platform presents an average of greater than 25 markers per megabase (Mb) providing ample SNP density for robust whole-genome genotyping studies used in maize breeding programs for constructions of genetic maps, linkage disequilibrium–based association mapping, studies of genetic diversity, cultivar identification, phylogenetic analysis and characterization of genetic resources. Array-based genotyping is more advantageous compared to other high-density genetic mapping technologies such as genotyping by sequencing because the data are highly reproducible and they can be easily stored in and retrieved from databases since the same markers are always employed (GANALet al., 2012).
Several studies have reported genetic diversity and relatedness of maize inbred lines of Southeast Europe - European Corn Belt at molecular level (BRKI et al., 2003; BAUER et al.,
2007; JAMBROVI et al., 2008; MLADENOVI DRINI et al., 2010), but none was used a large scale genotyping array. Like in U.S. Corn Belt, the majority of maize breeding material in Southeast Europe traces back to the maize race of Corn Belt Dent, although there was a wide range of maize genetic sources described and used in greater Pannonian plain (LENGet al., 1962, HADI; 2006; JARI et al., 2010). Here we describe the results of the detailed genotyping, obtained by using the Illumina MaizeSNP50 BeadChip of eleven inbred lines developed at the Agricultural Institute Osijek, Croatia. The objectives of this study were to assess the utility of the MaizeSNP50 BeadChip platform by determining its descriptive power and to assess genetic dissimilarity of the inbred lines belonging to different heterotic groups relevant for maize breeding in Southeast Europe - European Corn Belt.
MATERIALS AND METHODS
Plant materials
Croatia. As part of a greater genotyping investigation, we analyzed a total of eleven maize inbred lines consisting of two groups according to pedigree data. The grouping was made according to families within the two populations of Reid Yellow Dent and Lancaster Sure Crop. According to the MBS GENETICS HANDBOOK (1990), an inbred belongs to a family (or subfamily) if that
(sub)family contributes a significant portion to the inbred’s derivation. The most important Lancaster families are Mo17 and Oh43 (Ohio), named after well-known public inbreds. Thus in our study, Group 1 comprised six inbred lines including the original Mo17 and the lines OS-2695-CO, OS-27488, Os-942, Os-27-48 and Os-946-106 (Ohio family). Group 2 comprised seven inbred lines including original the B73 belonging to Iowa Stiff Stalk Synthetic (BSSS family) and the six lines OS-MA, OS-2340-8, Os-MMA, OS-817, Os-346, and OS-24-28-A belonging to Iodent family, a strain of Reid Yellow Dent. MIKEL and DUDLEY, (2006)described a
detailed evolution of North American dents utilizing pedigree information for a greater understanding of relations among maize germplasm, whereas VAN HEERWAARDEN et al., (2012)
reported exhaustively on the genomic evolution of North American maize. With the exception of the two best known public inbred lines Mo17 and B73, all other lines in this study were derived and developed at Agricultural Institute Osijek, Croatia.
High-throughput SNP genotyping and quality check
For each inbred line, DNA was extracted by a standard cetyltrimethyl ammonium bromide (CTAB) protocol for genotyping. DNA samples were processed on the MaizeSNP50 BeadChip (Illumina, Inc. San Diego, CA, USA) at TraitGenetics GmbH (Gatersleben, Germany. Two independent genomic DNA stocks of the reference B73 inbred line as well as DNA stock of the Mo17 were included by TraitGenetics GmbH as genotype reference controls in the experiment. Allele calling was performed with the GenomeStudio Genotyping Module v1.0 (Illumina) software through full automatic processing of raw data using the clustering algorithm and provided SNP genotype calls as the cluster file as table in MS Excel format. In addition to the definition of the genotype clusters based on the distribution on the two-dimensional plane of the genotyping software, further quality check was performed analyzing the consistency of the genotype calls determined in technical (same DNA analyzed twice) duplicates (two samples each from B73, Mo17 and randomly chosen OS-MMA line) In summary, the allele calls were highly reproducible with no or negligible inconsistencies observed between samples with respect to genotype calls in technical replicates. SNP mapping positions refer to their chromosome coordinates on the reference B73 maize genome assembly (RefGen_v1) as provided by TraitGenetics GmbH along with genotype calls. All SNPs with unknown mapping position or mapping to the unknown chromosome samples were discarded resulting in total of 50074 SNP markers. After quality filtering, of the total of 56110 markers contained on the chip, 33200 polymorphic SNPs were genotyped successfully with less than 10% missing data for use in subsequent analysis.
Dissimilarity and PCA analyses
monomorphic sites and imputing missing values, principal component analysis (PCA) based on Manhattan distance was performed in order to further investigate relationships among the inbred lines. Dissimilarity, cluster and principal component analyses were performed by TASSEL software version 3 (BRADBURY et al. 2007).
RESULTS AND DISCUSSION
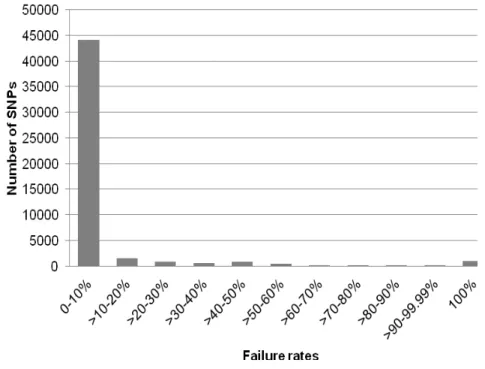
The cluster file of SNP genotype calls was used to score all maize samples and the quality of the genotyping data was assessed with respect to the failure rate on a marker by marker basis (Figure 1). The 50074 markers with known mapping position had an average failure rate less than 3.0% which corresponds to data presented by GANAL et al., (2011). Specifically,
44144 (88.16%) markers had a failure rate less than 10% producing the correct genotype, whereas 1589 (3.17%) markers had a failure rate less than 20%, followed by 1004 (2.01%) markers having 100% failure rate (Figure 1). Altogether, whole genome distribution of number of SNPs with their corresponding failure rates for the 50074 markers analyzed in the set of 13 maize inbred lines indicate very high call rate representing powerful high-resolution genotyping solution.
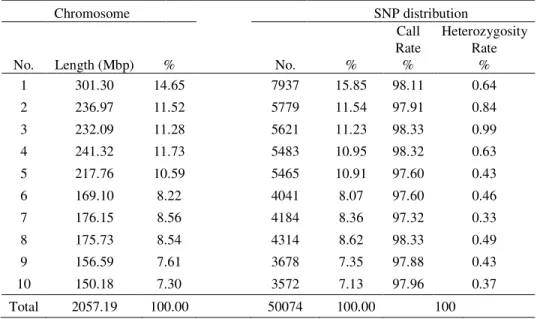
The descriptive power of the MaizeSNP50 BeadChip with respect to our genetic material was assessed by determining the genomic distribution of the 50074 SNPs among and within the maize chromosomes (Table 1). The distribution of the SNPs was found not completely uniform among chromosomes due to a considerable higher- (Chromosome 1) and lower- (Chromosome 4) than-expected number of SNPs. The same pattern was also observed by PEA et al., (2013). Nevertheless, call rates were uniform among chromosomes (97.32%- 98.33%), while heterozygosity rates varied from 0.33 to 0.99%, or 0.56% in average.
Table 1. SNPs genomic distribution among chromosomes
Chromosome SNP distribution
No. Length (Mbp) % No. %
Call Rate %
Heterozygosity Rate
%
1 301.30 14.65 7937 15.85 98.11 0.64
2 236.97 11.52 5779 11.54 97.91 0.84
3 232.09 11.28 5621 11.23 98.33 0.99
4 241.32 11.73 5483 10.95 98.32 0.63
5 217.76 10.59 5465 10.91 97.60 0.43
6 169.10 8.22 4041 8.07 97.60 0.46
7 176.15 8.56 4184 8.36 97.32 0.33
8 175.73 8.54 4314 8.62 98.33 0.49
9 156.59 7.61 3678 7.35 97.88 0.43
10 150.18 7.30 3572 7.13 97.96 0.37
Total 2057.19 100.00 50074 100.00 100
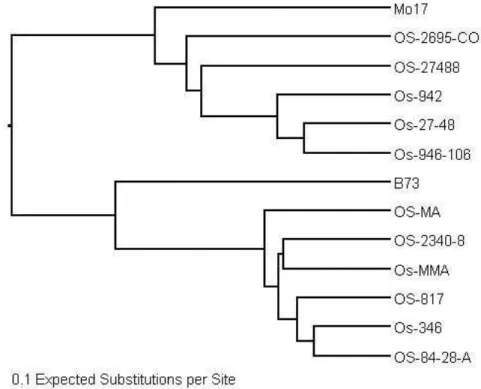
UPGMA dendrogram ordered the inbreds in two broad groups (Figure 2). As expected, one group consisted of inbreds from Lancaster inbred lines (Mo17 and Ohio lines), and the other included all Reid Yellow Dent (B73 and Iodent lines). The first main cluster revealed that Mo17 was not positioned apart from all other Ohio lines clustering together with them. On the other hand, the second main cluster consisted of lines Reid Yellow Dent indicated that the B73 line is considerable distinct from Iodent lines. The lines Os-27-48 and Os-946-106 in the first cluster, and the lines Os-346 and OS-84-28-A in the second cluster are respectively the closest related lines in the study.
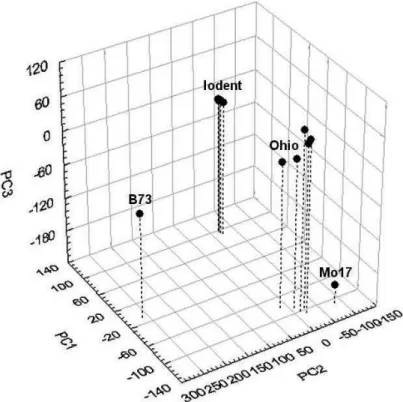
PC2 differentiated the B73 and the other inbred lines (Figure 2). Principal component 3 (15.2%) differentiated the Mo17 and the other 12 inbred lines (Figure 2). Whereas cluster analysis did not definitely differentiate Mo17 and Ohio inbred lines, PCA revealed clear genetic difference between them.
Figure 2. Dendrogram of unweighted pair group method with arithmetic means cluster analysis of 13 maize inbred lines using a dissimilarity matrix generated with TASSEL software (Bradbury et al., 2007). Scale bar is equal to 0.1 expected substitutions per site
An important question is whether maize SNPs in commercial arrays are associated with ascertainment bias leading to an underestimation of polymorphism within germplasm which was not included in the original process of SNP identification. Previous studies of diversity among maize inbreds indicated that marker ascertainment bias of SNPs on the MaizeSNP50 Beadchip tended to inflate the difference between B73 and Mo17 (GANAL et al., 2011; VAN HEERWAARDEN et al., 2012). FRASCAROLI et al., (2013) found that ascertainment bias was greater among
subpopulation. Future studies should be done to determine if ascertainment bias had impact on the grouping of inbreds into subpopulations of Southeast Europe including local landraces.
Figure 3. Principal components (PCs) analysis of 13 maize inbreds genotyped with 33200 polymorphic SNP markers.
Another question is whether array-based genotyping may provide an opportunity to explore the application of high-throughput marker technology in distinctness, uniformity and stability (DUS) testing of new maize varieties employing UPOV approaches, such as calibration of threshold levels for molecular characteristics against the minimum distance in traditional characteristics (GUNJA A et al., 2008). JONES et al., (2013) evaluated the use of an array-based
CONCLUSIONS
The distribution of the SNPs was found not completely uniform among chromosomes, but average call rate was very high (97.9%) and number of polymorphic loci was 33200 out of 50074 SNPs with known mapping position indicating descriptive power of the MaizeSNP50 BeadChip. The dendrogram obtained from UPGMA cluster analysis as well as principal component analysis confirmed pedigree information, undoubtedly distinguishing lines according to their background in two population varieties of Reid Yellow Dent and Lancaster Sure Crop when array-based genotyping was applied. Dissimilarity analysis showed that all of the inbred lines could be distinguished from each other and classified the lines into expected two main groups. The inbred lines of Osijek Agricultural Institute were confirmed to be genetically diverse, representing a large proportion of the genetic variation occurring in two maize inbred families. Thus, future prospects seem to be promising for further success in finding new superior elite lines through breeding programs.
Received December 17th 2013
Accepted April 05th, 2014
REFERENCES
BAUER, I., S. MLADENOVI DRINI , G. DRINI , D. IGNJATOVI MICI (2007): Assessing temporal changes in genetic
diversity of maize hybrids using RAPD markers. Cereal Res. Commun. 35 (4): 1563-1571.
BRADBURY, P.J., Z. ZHANG, D.E. KROON, T.M. CASSTEVENS, Y. RAMDOSS, and E.S. BUCKLER (2007): TASSEL: Software for association mapping of complex traits in diverse samples. Bioinformatics 23: 2633-2635.
BRKI , I., D. ŠIMI , A. JAMBROVI , Z. ZDUNI , T. LEDEN AN (2003): Genetic diversity among and within maize inbreds as revealed by 100 SSR markers. Sjemenarstvo 20 (1/2): 5-14.
FRASCAROLI, E., T. SCHRAG, A. MELCHINGER (2013): Genetic diversity analysis of elite European maize (Zea mays L.) inbred lines using AFLP, SSR, and SNP markers reveals ascertainment bias for a subset of SNPs. Theor. Appl. Genet. 126: 133–141.
GANAL, M.W., T. ALTMANN, M.S. RÖDER (2009): SNP identification in crop plants. Curr. Opin. Plant Biol. 12: 211–217.
GANAL, M.W., G. DURSTEWITZ, A. POLLEY, A. BERARD, E.S. BUCKLER, A. CHARCOSSET, J.D. CLARKE, E.M GRANER, M.
HANSEN, J. JOETS, M.C.LE PASLIER, M.D. MCMULLEN, P. MONTALENT, M. ROSE, C.C. SCHON, Q. SUN, H. WALTER,
O.C. MARTIN, M. FALQUE (2011): A large maize (Zea mays L.) SNP genotyping array: development and germplasm genotyping, and genetic mapping to compare with the B73 reference genome. PLoS One 6: e28334.
GANAL, M.W., A. POLLEY, E-M. GRANER, J. PLIESKE, R. WIESEKE, H. LUERSSEN and G. DURSTEWITZ (2012): Large SNP arrays for genotyping in crop plants. J. Biosci. 37: 821–828.
GUNJA A J., I. BUHINI EK, M. JUKI , H. ŠAR EVI , A. VRAGOLOVI , Z. KOZI , A. JAMBROVI , I. PEJI (2008): Discriminating maize inbred lines using molecular and DUS data. Euphytica 161: 165–172.
HADI, G. (2006): Genetic basis of maize production in Eastern Central Europe between 1610 and 2005. Review. Cereal Res. Commun. 34 (4): 1307-1314.
JAMBROVI , A., D. ŠIMI , T. LEDEN AN, Z. ZDUNI , I. BRKI (2008) Genetic diversity among maize (Zea mays, L.) inbred lines in Eastern Croatia. Period. Biol. 110 (3): 251-255.
JONES, H., C. NORRIS, D. SMITH, J. COCKRAM, D. LEE, D.M. O'SULLIVAN, I. MACKAY (2013): Evaluation of the use of high-density SNP genotyping to implement UPOV Model 2 for DUS testing in barley. Theor. Appl. Genet. 126: 901–911.
LENG, E., A.TAV AR, V. TRIFUNOVI (1962): Maize of Southeastern Europe and its potential in breeding programs elsewhere. Euphytica 11: 263–272
MARTIN, G. (2010): The maize infinium 60K array – design, first data and potential 410 applications, in: Abstr. Plant Animal Genome Conf, XVIII, San Diego, CA, 9–13 411 January, Available at: http://www.intl-pag.org/18/18i-illumina.html 412 (verified 08.12.12).
MBS GENETICS BOOK (1990): Martin Brayton Seed Co., Ames, Iowa.
MIKEL M.A., J. W. DUDLEY (2006): Evolution of North American dent corn from public to proprietary germplasm. Crop Sci. 46: 1193–1205.
MLADENOVI DRINI , S., Z. PAJI, U. ERI , J. SRDI , M. FILIPOVI (2010): Genetic divergence estimated by RAPD markers and its relationship with hybrid performance in popcorn. Cereal Res. Commun. 38 (2): 184-192.
PEA, G., H.H. AUNG, E. FRASCAROLI, P. LANDI, M.E. PÈ (2013): Extensive genomic characterization of a set of near-isogenic lines for heterotic QTL in maize (Zea mays L.) BMC Genomics 14:61; http://www.biomedcentral.com/1471-2164/14/61.
SCHNABLE, P.S., D. WARE, R.S. FULTON RS, STEIN JC, WEI F, PASTERNAK S, LIANG C, ZHANG J, FULTON L, GRAVES TA, MINX P, REILY AD, COURTNEY L, KRUCHOWSKI SS, TOMLINSON C, STRONG C, DELEHAUNTY K, FRONICK C, COURTNEY B, ROCK SM, BELTER E, DU F, KIM K, ABBOTT RM, COTTON M, LEVY A, MARCHETTO P, OCHOA K, JACKSON SM,
GILLAM B, et al. (2009): The B73 maize genome: complexity, diversity, and dynamics. Science 326:1112– 1115.
GENOTIPIZACIJA POMO U IPA I ANALIZA RAZLI ITOSTI INBRED LINIJA KUKURUZA KOJE PRIPADAJU RAZLI ITIM HETEROTI KIM GRUPAMA
Antun JAMBROVI 1, Maja MAZUR1, Zvonko RADAN2, Zvonimir ZDUNI 1, Tatjana
LEDEN AN1, Andrija BRKI 1, Josip BRKI 1, Ivan BRKI 1, and Domagoj ŠIMI 1
1
Poljoprivrednil institut Osijek, Osijek, Hrvatska
2 Fermopromet d.o.o., Novi Bezdan, Baranjsko Petrovo Selo, Hrvatska
Izvod
Opisani su rezultati detaljne genotipizacije pomo u ipa Illumina MaizeSNP50 BeadChip na jedanaest inbred linija koje pripadaju razli itim heteroti kim grupama relevantnih za oplemenjivanje kukuruza u Jugoisto noj Europi, europskom Corn-Beltu. Ciljevi ovoga rada bili su ocijeniti upotrebljivost MaizeSNP50 BeadChip platforme odre ivanjem njezine deskriptivne snage i procijeniti nakon toga genetsku razli itost inbred linija. Distribucija SNPova nije bila u potpunosti uniformna po kromosomima, ali stopa uspješnosti odziva markera (call rate) bila je vrlo visoka (97.9%), a broj polimorfnih lokusa bila je 33200 od ukupno 50074 SNPova kojima je poznata pozicija na genetskoj mapi što ukazuje na deskriptivnu snagu MaizeSNP50 BeadChip platforme. Dendrogram dobiven UPGMA klaster analizom, kao i analiza glavnih komponenata (PCA) nedvojbeno su razlu ile linije prema njihovom pedigreu u dvije grupe Reid Yellow Dent and Lancaster Sure Crop. Analiza razli itosti je pokazala da se inbred linije razlikuju jedna od druge. Dok klaster analiza nije jasno izdiferencirala Mo17 od Ohio linija, PCA je otkrila jasnu genetsku razliku izme u njih.
Primljeno 17. XII. 2013.