INTRODUCTION
In 2005, the Ocular Response Analyzer (ORA; Reichert Technolo-gies, Depew, New York) was launched as the first commercial device claiming to provide in vivo measurements of corneal biomechanics(1). It utilizes a dynamic bi-directional applanation process in which two applanation pressure measurements are recorded: the first, while the cornea is moving inward (P1); and the second, while the cornea returns(2).
The primary output measurements, derived from the air puff re corded pressure during the first and second applanations, are
Goldmann-correlated intraocular pressure (IOPg), defined as the ave rage between P1 and P2; corneal hysteresis (CH), defined as the difference between P1 and P2; corneal resistance factor (CRF), which includes a constant factor designed to optimize the correlation with central corneal thickness (CCT); and corneal compensated intrao-cular pressure (IOPcc), which includes a constant based on CRF for cor relation with CCT(2).
Further information about the corneal response is provided by infrared waveform signal analysis, which corresponds to the defor-mation movement of the cornea caused by the air puff(3). These novel
ORA waveform-derived biomechanical parameters to distinguish normal
from keratoconic eyes
Parâmetros biomecânicos derivados da forma da curva do ORA para discriminar
olhos normais de ceratocones
AllAn luz1,2,3, Bruno MAchAdo Fontes1,3, BernArdo lopes3, IsAAc rAMos3, pAulo schor1, renAto AMBrósIo Jr.1,3,4
Submitted for publication: April 9, 2012 Accepted for publication: January 31, 2013
Study carried out at Instituto de Olhos Renato Ambrosio - Rio de Janeiro, Brazil.
1 Department for Ophthalmology of the Universidade Federal de São Paulo, São Paulo, Brazil. 2 Hospital de Olhos de Sergipe, Aracaju, Brazil.
3 Rio de Janeiro Corneal Tomography and Biomechanics Study Group.
4 Instituto de Olhos Renato Ambrósio, Visare Personal Laser and Refracta-RIO, Rio de Janeiro, Brazil.
Funding: No specific financial support was available for this study.
Disclosure of potential conflicts of interest: A.Luz, None; B.M.Fontes, None; B.Lopes, None; I.Ramos, None; P.Schor, None, R.Ambrósio Jr, is a consult of OCULUS Optikgeräte GmbH.
Correspondence address: Allan Luz. Rua Campo do Brito, 995 - Aracaju (SE) - 49020-380 - Brazil - E-mail: [email protected]
The ethics committee of the Universidade Federal de São Paulo, Brazil (protocol 1210/10).
ABSTRACT
Purpose: To evaluate the ability of the Ocular Response Analyzer (ORA; Reichert Ophthalmic Instruments, Buffalo, NY) to distinguish between normal and kera-toconic eyes, by comparing pressure and waveform signal-derived parameters. Methods: This retrospective comparative case series study included 112 patients with normal corneas and 41 patients with bilateral keratoconic eyes. One eye from each subject was randomly selected for analysis. Keratoconus diagnosis was based on clinical examinations, including Placido disk-based corneal topography and rotating Scheimpflug corneal tomography. Data from the ORA best waveform score (WS) measurements were extracted using ORA software. Corneal hysteresis (CH), corneal resistance factor (CRF), Goldman-correlated intraocular pressure (IOPg), cornea-compensated intraocular pressure (IOPcc), and 37 parameters derived from the waveform signal were analyzed. Differences in the distributions among the groups were assessed using the Mann-Whitney test. Receiver operating charac-teristic (ROC) curves were calculated.
Results: Statistically significant differences between keratoconic and normal eyes were found in all parameters (p<0.05) except IOPcc and W1. The area under the ROC curve (AUROC) was greater than 0.85 for 11 parameters, including CH (0.852) and CRF (0.895). The parameters related to the area under the waveform peak during the second and first applanations (p2area and p1area) had the best performances, with AUROCs of 0.939 and 0.929, respectively. The AUROCs for CRF, p2area, and p1area were significantly greater than that for CH.
Conclusion: There are significant differences in biomechanical metrics between normal and keratoconic eyes. Compared with the pressure-derived parameters, corneal hysteresis and corneal resistance factor, novel waveform-derived ORA pa rameters provide better identification of keratoconus.
Keywords: Cornea; Keratoconus; Corneal diseases; Refractive surgical procedures; Software; Biomechanics
RESUMO
Objetivo: Avaliar a capacidade do Ocular Response Analyzer (ORA; Reichert Oph-thalmic Instruments, Buffalo, NY) em discriminar olhos com ceratocone de olhos normais e comparar parâmetros derivados da pressão dos parâmetros derivados da forma da curva.
Métodos: Estudo comparativo retrospectivo série de casos que incluiu 112 pacientes com olhos normais e 41 pacientes com ceratocone bilateral. Um olho de cada indiví-duo foi randomicamente selecionado para análise. O diagnóstico de ceratocone foi baseado em exame clínico, incluindo topografia de Plácido e tomografia Scheimpflug. Informação do melhor waveform score foi extraída do software do ORA. Histerese corneana (CH), fator de resistência corneana (CRF), pressão intraocular correlaciona-da com Goldman (IOPg), pressão intraocular compensacorrelaciona-da pela córnea (IOPcc) e 37 novos parâmetros derivados da forma da curva do sinal do ORA foram analisados. Diferenças nas distribuições dos grupos foram avaliadas pelo teste Mann-Whitney. Curvas ROC foram calculadas.
Resultados: Diferenças estatisticamente significantes foram encontradas entre os olhos normais e ceratocones em todos os parâmetros (p<0,05) salvo IOPcc e W1. A área sob a curva ROC (AUROC) foi maior que 0.85 em 11 parâmetros, incluindo CH (0,852) a CRF (0,895). Os parâmetros relacionados com a área sob o pico da forma de onda durante a segunda e primeira aplanação (p2area e p1area) obtiveram as melhores performances, com AUROCs de 0,939 e 0,929, respectivamente. Os valores de AUROCs do fator de resistência corneana, p2area e p1area foram significativamente maiores que os valores de histerese corneana. Conclusão: Existem diferenças significantes nas medidas biomecânicas entre olhos normais e com ceratocone. Comparados com os parâmetros derivados da pressão, histerese corneana e fator de resistência corneana, os parâmetros derivados da forma da curva proporcionaram melhor identificação dos ceratocones.
parameters based on a complex analysis of the waveform signal were thought to improve sensitivity and specificity for distinguishing nor-mal and keratoconic corneas(2-5).
Kerautret et al., reported a case that demonstrated the impor-tance of ORA waveform signal analysis in the evaluation of LASIK-in duced ectasia compared with a stable post-LASIK cornea with a similar CH value(6).
Parameters from the waveform signal have been studied for sta ging the severity of keratoconus(7). In addition, changes after myo pic LASIK and the estimated elasticity coefficient of the cornea were evaluated using waveform signal parameters(8,9). Although CH and CRF were found to be unchanged after corneal crosslinking (CXL)(10,11), waveform-derived parameters were significantly chan-ged after CXL(3,12).
In a previous study(13), our group reported lower values for kerato-conic eyes with normal central corneal thickness. Many other studies by different investigators have also found lower values for keratoco-nus(14-16), by testing only the traditional ocular biomechanical metrics pressure-derived parameters CH and CRF.
This study was conducted to evaluate pressure-derived para-meters (CH, CRF, IOPg, and IOPcc) and 37 novel parapara-meters derived from the waveform signal of the ORA with regard to their ability to distinguish normal from keratoconic eyes.
METHODS
The study constituted a comparative case series. The retrospecti-ve study involretrospecti-ved 112 patients with normal corneas and 41 patients with bilateral keratoconus; one eye from each subject was randomly selected. The research followed the tenets of the Declaration of Helsinki and was approved by the ethics committee of the Federal University of São Paulo, Brazil (protocol 1210/10).
Patients examined at the Instituto de Olhos Renato Ambrósio (Rio de Janeiro, Brazil) were retrospectively enrolled. Patients were selected from a database of patients with normal corneas who were candidates for refractive surgery and from a database of cases diag-nosed as having keratoconus in both eyes.
All eyes were examined by a fellowshiptrained cornea and re -fractive surgeon (R.A.). Along with a comprehensive ocular exami-nation, all eyes were examined by Placido disk-based corneal topo-graphy (Atlas Corneal Topotopo-graphy System; Humphrey, San Leandro, CA) and rotating Scheimpflug corneal tomography (Pentacam HR; Oculus, Wetzlar, Germany). The diagnosis of keratoconus was made based on clinical data, including Placido disk-based axial topography corneal curvature maps(17); criteria used in the Collaborative Longi-tudinal Evaluation of Keratoconus study(18); and Pentacam corneal tomography(5). Keratoconus cases with a history of corneal surgery or with extensive corneal scarring were excluded from the study.
The patients underwent clinical evaluation and testing with the ORA during the same visit. All measurements were obtained between 8 AM and 6 PM. At least two consecutive measurements were per-formed, and the best waveform score (WS) from each patient was included in the analysis.
The ORA determines corneal biomechanical properties by using an applied force displacement relationship, as described previous-ly(1,14-16). Briefly, a precisely metered air pulse is delivered to the eye, causing the cornea to move inward, past applanation, and into slight concavity. Milliseconds after the initial applanation, the air pump generating the air pulse is shut off, and the pressure applied to the eye decreases in an inverse-time, symmetrical fashion. As the pres-sure decreases, the cornea passes through a second applanated state while returning from concavity to its normal convex curvature. Energy absorption during rapid corneal deformation delays the occurrence of the inward and outward applanation signal peaks, resulting in a difference between the applanation pressures. The difference bet-ween these inward and outward motion applanation pressures is
the CH, which indicates viscous damping in the cornea and reflects the capacity of corneal tissue to absorb and dissipate energy. CRF is a measure of the cumulative effects of both the viscous and elastic resistance encountered by the air jet while deforming the corneal surface; it is an indicator of the overall resistance of the cornea. The CRF was derived empirically to maximize its correlation with the central corneal thickness(19). It can be considered as weighted by the elastic resistance, because of its stronger correlation with the central corneal thickness than with CH. Although CH and CRF are related, they can differ significantly in some cases, and each provides distinct information about the cornea.
Using the new ORA software (version 2.04), the 37 new parame-ters described in table 1 were calculated based on the waveform of the ORA signal. Statistical analyses were performed using BioEstat 5.0 (Instituto Mamirauá, Amazonas, Brazil) and Med-Calc 11.1 (MedCalc Software, Mariakerke, Belgium). The nonparametric Mann-Whitney U test (Wilcoxon rank sum test) was used to assess variable distributions between the keratoconic and normal cornea groups.
Receiver operating characteristic (ROC) curves and the areas under the ROC curves (AUROCs) were calculated for all parameters to de-termine the test’s overall predictive accuracy. The standard error of the AUROC was assessed with the DeLong method(20). The binomial exact method was used to calculate the confidence interval (CI) for the AUROC. Nonparametric pairwise comparisons were performed to determine the significance of differences between AUROCs, using the Hanley-McNeil method for calculating the standard error(21). Va-lues of P<0.05 indicated statistical significance.
RESULTS
Single eyes randomly selected from the 112 patients with normal unoperated eyes and 41 patients with bilateral keratoconus were enrolled. In the normal and keratoconic groups, the average patient ages were 39.0 ± 17.9 years (range: 12.0 to 78.1 years) and 30.2 ± 10.8 years (range: 16.1 to 63 years), respectively, and the male/female percentages were 40.1/59.9 and 63.3/36.4, respectively.
The SimK1 and SimK2 simulated keratometry values and the ma-ximal keratometry value in the keratoconic group were 47.52 ± 5.53 diopters (D) (range: 39.90 to 69.40 D), 49.75 ± 7.12 D (range: 41.80 to 72.80), and 55.59 ± 7.63 D (range: 45.38 to 83.19 D), respectively.
Significant differences were found between normal and kerato-conic eyes for all parameters (Mann-Whitney U test, P<0.05) with the
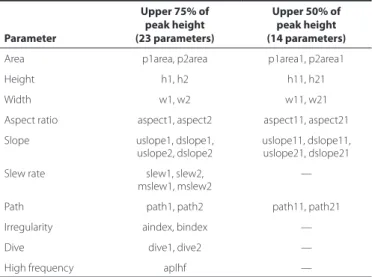
Table 1. Designation of the parameters
Parameter
Upper 75% of peak height (23 parameters)
Upper 50% of peak height (14 parameters)
Area p1area, p2area p1area1, p2area1
Height h1, h2 h11, h21
Width w1, w2 w11, w21
Aspect ratio aspect1, aspect2 aspect11, aspect21
Slope uslope1, dslope1,
uslope2, dslope2
uslope11, dslope11, uslope21, dslope21
Slew rate slew1, slew2,
mslew1, mslew2
—
Path path1, path2 path11, path21
Irregularity aindex, bindex —
Dive dive1, dive2 —
High frequency aplhf —
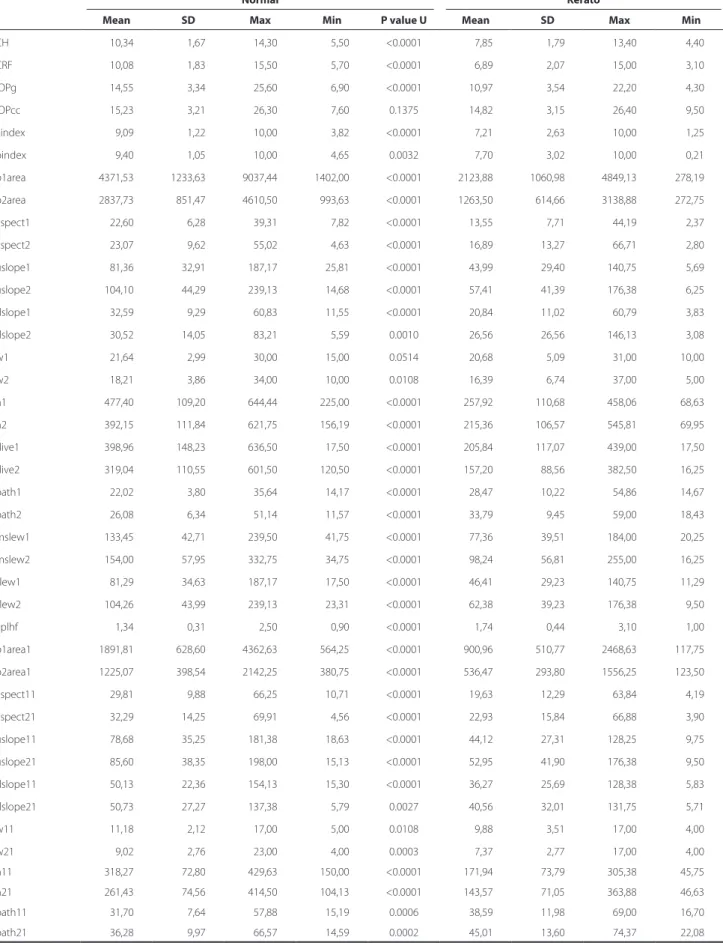
Table 2. ORA parameters measured in normal and keratoconus eyes
Normal Kerato
Mean SD Max Min P value U Mean SD Max Min
CH 10,34 1,67 14,30 5,50 <0.0001 7,85 1,79 13,40 4,40
CRF 10,08 1,83 15,50 5,70 <0.0001 6,89 2,07 15,00 3,10
IOPg 14,55 3,34 25,60 6,90 <0.0001 10,97 3,54 22,20 4,30
IOPcc 15,23 3,21 26,30 7,60 0.1375 14,82 3,15 26,40 9,50
aindex 9,09 1,22 10,00 3,82 <0.0001 7,21 2,63 10,00 1,25
bindex 9,40 1,05 10,00 4,65 0.0032 7,70 3,02 10,00 0,21
p1area 4371,53 1233,63 9037,44 1402,00 <0.0001 2123,88 1060,98 4849,13 278,19
p2area 2837,73 851,47 4610,50 993,63 <0.0001 1263,50 614,66 3138,88 272,75
aspect1 22,60 6,28 39,31 7,82 <0.0001 13,55 7,71 44,19 2,37
aspect2 23,07 9,62 55,02 4,63 <0.0001 16,89 13,27 66,71 2,80
uslope1 81,36 32,91 187,17 25,81 <0.0001 43,99 29,40 140,75 5,69
uslope2 104,10 44,29 239,13 14,68 <0.0001 57,41 41,39 176,38 6,25
dslope1 32,59 9,29 60,83 11,55 <0.0001 20,84 11,02 60,79 3,83
dslope2 30,52 14,05 83,21 5,59 0.0010 26,56 26,56 146,13 3,08
w1 21,64 2,99 30,00 15,00 0.0514 20,68 5,09 31,00 10,00
w2 18,21 3,86 34,00 10,00 0.0108 16,39 6,74 37,00 5,00
h1 477,40 109,20 644,44 225,00 <0.0001 257,92 110,68 458,06 68,63
h2 392,15 111,84 621,75 156,19 <0.0001 215,36 106,57 545,81 69,95
dive1 398,96 148,23 636,50 17,50 <0.0001 205,84 117,07 439,00 17,50
dive2 319,04 110,55 601,50 120,50 <0.0001 157,20 88,56 382,50 16,25
path1 22,02 3,80 35,64 14,17 <0.0001 28,47 10,22 54,86 14,67
path2 26,08 6,34 51,14 11,57 <0.0001 33,79 9,45 59,00 18,43
mslew1 133,45 42,71 239,50 41,75 <0.0001 77,36 39,51 184,00 20,25
mslew2 154,00 57,95 332,75 34,75 <0.0001 98,24 56,81 255,00 16,25
slew1 81,29 34,63 187,17 17,50 <0.0001 46,41 29,23 140,75 11,29
slew2 104,26 43,99 239,13 23,31 <0.0001 62,38 39,23 176,38 9,50
aplhf 1,34 0,31 2,50 0,90 <0.0001 1,74 0,44 3,10 1,00
p1area1 1891,81 628,60 4362,63 564,25 <0.0001 900,96 510,77 2468,63 117,75
p2area1 1225,07 398,54 2142,25 380,75 <0.0001 536,47 293,80 1556,25 123,50
aspect11 29,81 9,88 66,25 10,71 <0.0001 19,63 12,29 63,84 4,19
aspect21 32,29 14,25 69,91 4,56 <0.0001 22,93 15,84 66,88 3,90
uslope11 78,68 35,25 181,38 18,63 <0.0001 44,12 27,31 128,25 9,75
uslope21 85,60 38,35 198,00 15,13 <0.0001 52,95 41,90 176,38 9,50
dslope11 50,13 22,36 154,13 15,30 <0.0001 36,27 25,69 128,38 5,83
dslope21 50,73 27,27 137,38 5,79 0.0027 40,56 32,01 131,75 5,71
w11 11,18 2,12 17,00 5,00 0.0108 9,88 3,51 17,00 4,00
w21 9,02 2,76 23,00 4,00 0.0003 7,37 2,77 17,00 4,00
h11 318,27 72,80 429,63 150,00 <0.0001 171,94 73,79 305,38 45,75
h21 261,43 74,56 414,50 104,13 <0.0001 143,57 71,05 363,88 46,63
path11 31,70 7,64 57,88 15,19 0.0006 38,59 11,98 69,00 16,70
path21 36,28 9,97 66,57 14,59 0.0002 45,01 13,60 74,37 22,08
Demonstration of the overlapped values P2area
Figure 1. Distribution of normal and keratoconus eyes for P2area.
Demonstration of the overlapped values CH
Figure 2. Distribution of normal and keratoconus eyes for CH.
Demonstration of the overlapped values CRF
Figure 3. Distribution of normal and keratoconus eyes for CRF.
exception of IOPcc (P=0.1375) and W1 (P=0.0514) (Table 2). Corneal hysteresis was 7.85 ± 1.79 mmHg (range: 13.40 to 4.40 mmHg) in the keratoconus group and 10.34 ± 1.67 mmHg (range: 14.30 to 5.50) in the control group (P<0.0001). The corneal resistance factor was 6.89 ± 2.07 mmHg (range: 15.0 to 3.10) in the keratoconus group and 10.08 ± 1.83 mmHg (range: 15.50 to 5.70) in the control group (P<0.0001). The p2area was 1263.50 ± 614.66 (range to 3138.88 to 272.75) in the keratoconus group and 2837.73 ± 851.47 (range: 4610.50 to 993.63) in the control group (P<0.0001). The p1area was 2123.88 ± 1060.98 (range: 4849.13 to 278.19) in the keratoconus group and 4371.53 ± 1233.63 (range: 9037.44 to 1402.00 (P<0.0001). The data are summari-zed in table 2. Box-plot distributions of p2area, CH and CRF are shown in figures 1, 2 and 3, respectively.
The AUROC was greater than 0.85 for 11 parameters, including CH (0.852) and CRF (0.895). The parameters related to the area of the waveform during the second and first applanations had the best performances, with AUROCs of 0.939 and 0.929 for p2area and p1area,
respectively (Table 3). The AUROCs for p2area, p1area, and CRF were significantly greater than the AUROC for CH. Table 4 summarizes the pairwise comparisons of ROC curves for the 11 parameters with AUROCs >0.85.
DISCUSSION
The identification of keratoconus and related conditions when screening refractive candidates is of particularly high clinical impor-tance because failure to identify these cases is considered to be the main cause of ectasia after LASIK(5,22,23). This study analyzed 37 novel waveform signal parameters using the ORA 2.04 software and de-monstrated that the classic CH and CRF pressure parameters might not be used to distinguish normal eyes from those with keratoconus, as significant overlap is present.
The keratoconic cornea has a conical curvature with three charac-teristic features: thinning of the corneal stroma with folding artifacts, breaks in the Bowman’s layer due to a weak collagen fiber network and deposition of iron in the basal layers of the corneal epithelium. Additional structural changes may also be observed depending on the severity of the disease(24). A decrease in the number of collagen lamellae concomitant with an increase in the ground substance (proteoglycans) is frequently observed in the stroma(25). Loss of colla-gen fibrils in the stroma has been linked to proteolytic enzymes or decreased levels of proteinase inhibitors such as corneal α1 inhibitor and α2 macroglobulin(26).
Keratoconic eyes have low tensile strength, thinning, and pro-trusion(27). Lower resistance to deformation is attributable not only to thinning but also to the presence of more fragile corneal stromal collagen fibrils in keratoconic eyes than in normal eyes(13). Thus, redu-ced central corneal thickness is only part of the screening process for keratoconus identification. Previous studies(22,28) have demonstrated that biomechanical pressure metrics are significantly lower in kera-toconus corneas than in normal corneas.
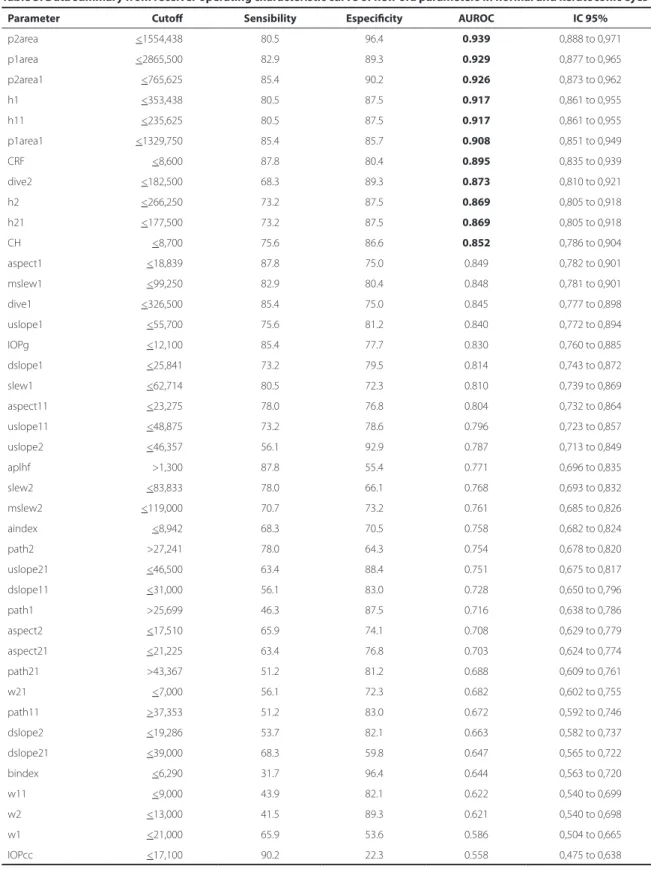
Table 3. Data summary from receiver operating characteristic curve of new ora parameters in normal and keratoconic eyes
Parameter Cutof Sensibility Especiicity AUROC IC 95%
p2area <1554,438 80.5 96.4 0.939 0,888 to 0,971
p1area <2865,500 82.9 89.3 0.929 0,877 to 0,965
p2area1 <765,625 85.4 90.2 0.926 0,873 to 0,962
h1 <353,438 80.5 87.5 0.917 0,861 to 0,955
h11 <235,625 80.5 87.5 0.917 0,861 to 0,955
p1area1 <1329,750 85.4 85.7 0.908 0,851 to 0,949
CRF <8,600 87.8 80.4 0.895 0,835 to 0,939
dive2 <182,500 68.3 89.3 0.873 0,810 to 0,921
h2 <266,250 73.2 87.5 0.869 0,805 to 0,918
h21 <177,500 73.2 87.5 0.869 0,805 to 0,918
CH <8,700 75.6 86.6 0.852 0,786 to 0,904
aspect1 <18,839 87.8 75.0 0.849 0,782 to 0,901
mslew1 <99,250 82.9 80.4 0.848 0,781 to 0,901
dive1 <326,500 85.4 75.0 0.845 0,777 to 0,898
uslope1 <55,700 75.6 81.2 0.840 0,772 to 0,894
IOPg <12,100 85.4 77.7 0.830 0,760 to 0,885
dslope1 <25,841 73.2 79.5 0.814 0,743 to 0,872
slew1 <62,714 80.5 72.3 0.810 0,739 to 0,869
aspect11 <23,275 78.0 76.8 0.804 0,732 to 0,864
uslope11 <48,875 73.2 78.6 0.796 0,723 to 0,857
uslope2 <46,357 56.1 92.9 0.787 0,713 to 0,849
aplhf >1,300 87.8 55.4 0.771 0,696 to 0,835
slew2 <83,833 78.0 66.1 0.768 0,693 to 0,832
mslew2 <119,000 70.7 73.2 0.761 0,685 to 0,826
aindex <8,942 68.3 70.5 0.758 0,682 to 0,824
path2 >27,241 78.0 64.3 0.754 0,678 to 0,820
uslope21 <46,500 63.4 88.4 0.751 0,675 to 0,817
dslope11 <31,000 56.1 83.0 0.728 0,650 to 0,796
path1 >25,699 46.3 87.5 0.716 0,638 to 0,786
aspect2 <17,510 65.9 74.1 0.708 0,629 to 0,779
aspect21 <21,225 63.4 76.8 0.703 0,624 to 0,774
path21 >43,367 51.2 81.2 0.688 0,609 to 0,761
w21 <7,000 56.1 72.3 0.682 0,602 to 0,755
path11 >37,353 51.2 83.0 0.672 0,592 to 0,746
dslope2 <19,286 53.7 82.1 0.663 0,582 to 0,737
dslope21 <39,000 68.3 59.8 0.647 0,565 to 0,722
bindex <6,290 31.7 96.4 0.644 0,563 to 0,720
w11 <9,000 43.9 82.1 0.622 0,540 to 0,699
w2 <13,000 41.5 89.3 0.621 0,540 to 0,698
w1 <21,000 65.9 53.6 0.586 0,504 to 0,665
IOPcc <17,100 90.2 22.3 0.558 0,475 to 0,638
The AUROC was greater than 0.85 for 11 parameters. The parameters related to the area of the waveform during the second and first applanations had the best performances.
healthy corneas. The AUROCs for p2area and p1area were signifi-cantly higher than those for CH and CRF (Table 4). Both p1area and p2area are proportional to the time required to change from the
Table 4. Pairwise comparison of ROC curves
P1area P2area1 H1 H11 P1area1 CRF Dive2 H2 H21 CH
P2area 0,6914 0,0519 0,4371 0,4371 0,2582 0,1872 0,0340 0,0054 0,0054 0,0181
P1area 0,9011 0,4848 0,4848 0,0228 0,3552 0,0337 0,0142 0,0142 0,0641
P2area1 0,7379 0,7379 0,5084 0,3308 0,0941 0,0250 0,0250 0,0407
H1 1,0000 0,7181 0,5500 0,1158 0,0898 0,0898 0,1388
H11 0,7181 0,5500 0,1158 0,0898 0,0898 0,1388
P1area1 0,7423 0,2463 0,1434 0,1434 0,1984
CRF 0,6450 0,5357 0,5357 0,0161
Dive2 0,8382 0,8382 0,6797
H2 1,0000 0,7185
H21 0,7185
The AUROCs for p2area, p1area, and CRF were significantly greater than the AUROC for CH.
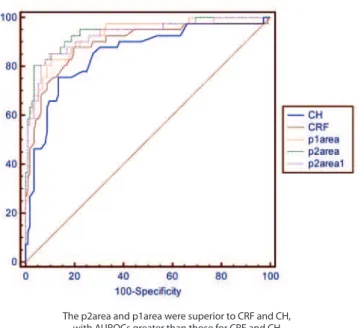
The p2area and p1area were superior to CRF and CH, with AUROCs greater than those for CRF and CH
Figure 4. Combined receiver operating curves for CH, CRF, P2area, P1area and P2area1.
The pressure parameters CRF and CH were significant different, as groups, between keratoconus and normal eyes in the present study, with CRF being superior to CH. The importance of CRF compared with CH is consistent with previous findings suggesting that CRF best correlates with optical aberrations in keratoconic eyes(29). However, in the present study, p2area and p1area were superior to CRF and CH, with AUROCs greater than those for CRF and CH (Table 3 and Figure 4). Yet, biomechanical data should not be used as the solo criteria in the diagnosis or screening of keratoconus since corneal curvature (given by Placido disk or corneal tomography elevation technologies) study remains the gold standard.
Further studies are necessary to integrate the parameters derived from the waveform signal with artificial intelligence techniques for detecting corneal curvature characteristics of keratoconus. These sen -sitive techniques will be useful for detecting milder forms of ectasia when assessing the risk for ectasia after LASIK.
The English in this document has been checked by at least two professional editors, both native speakers of English. For a certificate, please see:
http://www.textcheck.com/certificate/0eVwb2
REFERENCES
1. Luce DA. Determining in vivo biomechanical properties of the cornea with an ocular response analyzer. J Cataract Refract Surg. 2005;31(1):156-62.
2. Reinstein DZ, Gobbe M, Archer TJ. Ocular biomechanics: measurement parameters and terminology. J Refract Surg. 2011;27(6):396-7.
3. Spoerl E, Terai N, Scholz F, Raiskup F, Pillunat LE. Detection of biomechanical changes after corneal cross-linking using Ocular Response Analyzer software. J Refract Surg. 2011;27(6):452-7.
4. Mikielewicz M, Kotliar K, Barraquer RI, Michael R. Air-pulse corneal applanation signal curve parameters for the characterization of keratoconus. Br J Ophthalmol. 2011; 95(6):793-8. Comment in: Br J Ophthalmol. 2011;95(6):759-60.
5. Ambrósio R Jr, Nogueira LP, Caldas DL, Fontes BM, Luz A, Cazal JO, et al. Evaluation of corneal shape and biomechanics before LASIK. Int Ophthalmol Clin. 2011;51(2):11-38. 6. Kerautret J, Colin J, Touboul D, Roberts C. Biomechanical characteristics of the ectatic
córnea. J Cataract Refract Surg. 2008;34(3):510-3.
7. Fry KL, Luce D, Hersh PS. Integrated ocular response analyzer waveform score as a biomechanical index of keratoconus disease severity. In: Association for Research and Vision in Ophthalmology, 2008; Ft Lauderdale, FL. April 27-May 1.
8. Qazi MA, Sanderson JP, Mahmoud AM, Yoon EY, Roberts CJ, Pepose JS. Postoperative changes in intraocular pressure and corneal biomechanical metrics laser in situ ke-ratomileusis versus laser-assisted subepithelial keratectomy. J Cataract Refract Surg. 2009;35(10):1774-88.
9. Avetisov SE, Novikov IA, Bubnova IA, Antonov AA, Siplivyi VI. Determination of corneal elasticity coefficient using the ORA database. J Refract Surg. 2010;26(7):520-4. 10. Sedaghat M, Naderi M, Zarei-Ghanavati M. Biomechanical parameters of the cornea
after collagen crosslinking measured by waveform analysis. J Cataract Refract Surg. 2010t;36(10):1728-31.
11. Goldich Y, Barkana Y, Morad Y, Hartstein M, Avni I, Zadok D. Can we measure corneal biomechanical changes after collagen cross-linking in eyes with keratoconus?--a pilot study. Cornea. 2009;28(5):498-502.
12. Vinciguerra P, Albè E, Mahmoud AM, Trazza S, Hafezi F, Roberts CJ. Intra- and posto-perative variation in ocular response analyzer parameters in keratoconic eyes after corneal cross-linking. J Refract Surg. 2010;26(9):669-76.
13. Fontes BM, Ambrósio R Jr, Velarde GC, Nosé W. Ocular response analyzer measure-ments in keratoconus with normal central corneal thickness compared with matched normal control eyes. J Refract Surg. 2011;27(3):209-15.
14. Ortiz D, Piñero D, Shabayek MH, Arnalich-Montiel F, Alió JL. Corneal biomechanical properties in normal, post-laser in situ keratomileusis, and keratoconic eyes. J Cata-ract RefCata-ract Surg. 2007;33(8):1371-5. Comment in: J CataCata-ract RefCata-ract Surg. 2008;34(5): 715; author reply 715-6.
15. Shah S, Laiquzzaman M. Comparison of corneal biomechanics in pre and postre -fractive surgery and keratoconic eyes by Ocular Response Analyser. Cont Lens An terior Eye. 2009;32(3):129-32; quiz 151.
16. Shah S, Laiquzzaman M, Bhojwani R, Mantry S, Cunliffe I. Assessment of the biome-chanical properties of the cornea with the ocular response analyzer in normal and keratoconic eyes. Invest Ophthalmol Vis Sci [Internet]. 2007 [cited 2012 Jun 21]; 48(7): 3026-31.Available from: http://www.iovs.org/content/48/7/3026.long
17. Rabinowitz YS. Keratoconus. Surv Ophthalmol. 1998;42(4):297-319.
18. Zadnik K, Barr JT, Edrington TB, Everett DF, Jameson M, McMahon TT, et al. Baseline findings in the Collaborative Longitudinal Evaluation of Keratoconus (CLEK) Study. Invest Ophthalmol Vis Sci [Internet]. 1998 [cited 2011 Jan 2]39(13):2537-46. Available from: http://www.iovs.org/content/39/13/2537.long
2006[ci-ted 2012 Jan 21];47:E-Abstract 2266. Available from: http://abstracts.iovs.org//cgi/ content/abstract/47/5/2266?sid=31a0ac4a-7f88-44e0-bcb8-ab9067e023aa 20. DeLong ER, DeLong DM, Clarke-Pearson DL. Comparing the areas under two or
more correlated receiver operating characteristic curves: a nonparametric approach. Biometrics. 1988;44(3):837-45.
21. McNeil BJ, Hanley JA. Statistical approaches to the analysis of receiver operating cha rac teristic (ROC) curves. Med Decis Making. 1984;4(2):137-50.
22. Fontes BM, Ambrósio R Jr, Jardim D, Velarde GC, Nose W. Corneal biomechanical metrics and anterior segment parameters in mild keratoconus. Ophthalmology. 2010; 117(4):673-9.
23. Ambrósio R Jr, Caiado AL, Guerra FP, Louzada R, Roy AS, Luz A, et al. Novel pachymetric parameters based on corneal tomography for diagnosing keratoconus. Refract Surg. 2011;27(10):753-8.
24. Krachmer JH, Feder RS, Belin MW. Keratoconus and related noninflammatory corneal thinning disorders. Surv Ophthalmol. 1984;28(4):293-322.
25. Sawaguchi S, Yue B, Chang I, Sugar J, Robin J. Proteoglycan molecules in keratoconus corneas. Invest Ophthalmol Vis Sci [Internet]. 1991[cited 2011 Jun 21];32(6):1846-53. Available from: http://www.iovs.org/content/32/6/1846.long
26. Mackiewicz Z, Maatta M, Stenman M, Konttinen L, Tervo T, Konttinen YT. Collage-nolytic proteinases in keratoconus. Cornea. 2006;25(5):603-10. Erratum In: Cornea. 2006; 25(6):760.
27. Reeves SW, Ellwein LB, Kim T, Constantine R, Lee PP. Keratoconus in the Medicare population. Cornea. 2009;28(1):40-2.
28. Saad A, Lteif Y, Azan E, Gatinel D. Biomechanical properties of keratoconus suspect eyes. Invest Ophthalmol Vis Sci [Internet]. 2010[cited 2012 Mar 21];51(6):2912-6. Available from: http://www.iovs.org/content/51/6/2912.long
29. Piñero DP, Alio JL, Barraquer RI, Michael R, Jiménez R. Corneal biomechanics, refraction, and corneal aberrometry in keratoconus: an integrated study. Invest Oph thalmol Vis Sci [Internet]. 2010[cited 2012 Nov 21];51(4):1948-55. Available from: http://www.iovs.org/content/51/4/1948.long