AMTD
7, 1457–1493, 2014Retrieval of tropospheric column-averaged CH4mole fraction
Z. Wang et al.
Title Page
Abstract Introduction
Conclusions References
Tables Figures
◭ ◮
◭ ◮
Back Close
Full Screen / Esc
Printer-friendly Version
Interactive Discussion
Discussion
P
a
per
|
D
iscussion
P
a
per
|
Discussion
P
a
per
|
Discuss
ion
P
a
per
|
Atmos. Meas. Tech. Discuss., 7, 1457–1493, 2014 www.atmos-meas-tech-discuss.net/7/1457/2014/ doi:10.5194/amtd-7-1457-2014
© Author(s) 2014. CC Attribution 3.0 License.
Atmospheric Measurement
Techniques
Open Access
Discussions
This discussion paper is/has been under review for the journal Atmospheric Measurement Techniques (AMT). Please refer to the corresponding final paper in AMT if available.
Retrieval of tropospheric
column-averaged CH
4
mole fraction by
solar absorption FTIR-spectrometry using
N
2
O as a proxy
Z. Wang1, N. M. Deutscher1,2, T. Warneke1, J. Notholt1, B. Dils3, D. W. T. Griffith2, M. Schmidt4, M. Ramonet4, and C. Gerbig5
1
Institute of Environmental Physics, University of Bremen, Germany
2
School of Chemistry, University of Wollongong, Wollongong, Australia
3
Belgian Institute for Space Aeronomy, Brussels, Belgium
4
Laboratoire des Sciences du Climat et de l’Environnement (LSCE), Gif-Sur-Yvette, France
5
Max-Plank-Institute für Biogeochemie, Jena, Germany
Received: 30 December 2013 – Accepted: 31 January 2014 – Published: 13 February 2014
Correspondence to: Z. Wang ([email protected])
AMTD
7, 1457–1493, 2014Retrieval of tropospheric column-averaged CH4mole fraction
Z. Wang et al.
Title Page
Abstract Introduction
Conclusions References
Tables Figures
◭ ◮
◭ ◮
Back Close
Full Screen / Esc
Printer-friendly Version
Interactive Discussion
Discussion
P
a
per
|
D
iscussion
P
a
per
|
Discussion
P
a
per
|
Discuss
ion
P
a
per
|
Abstract
Tropospheric column-averaged CH4 mole fractions were derived from ground-based absorption columns measurements. The method used stratospheric N2O columns to correct for the stratospheric contribution to the CH4total column. The method was ap-plied to four TCCON sites covering locations from the Northern Arctic to the tropics. It
5
performs well for all sites. The derived tropospheric CH4concentrations were compared with profiles measured by aircraft at three sites. The results indicate an inter-site con-sistency within 6 ppb (∼0.3 %). With aircraft profiles up to 3 km, the seasonal behavior of the derived tropospheric CH4concentration was also checked. It reveals a difference of 20 ppb around. The mean relative uncertainty of the four sites is 0.23 %. Comparing
10
with the method using HF the proposed method shows a smaller relative uncertainty and less H2O dependence.
1 Introduction
Methane (CH4) is the second most important anthropogenic greenhouse gas in the atmosphere (Montzka et al., 2011). The main sources of CH4 to the atmosphere are
15
natural wetlands, anthropogenic activities (livestock production; rice cultivation; produc-tion, storage, transmission, and distribution of fossil fuels; waste waters and landfills) and biomass burning. The destruction by OH in the troposphere is the dominant at-mospheric sink of CH4. Both anthropogenic and natural emissions of CH4 are likely to increase in the twenty-first century as global population increases and climate warms.
20
The atmospheric mole fraction of methane has increased from about 700 ppb to the current atmospheric background of about 1800 ppb since 1770. Despite this dramatic increase, the observed global annual mean atmospheric abundance was nearly con-stant from 1999 to 2006, before it began to increase again in 2007 (Rigby et al., 2008; Dlugokencky et al., 2009). This behaviour is a subject of open scientific discussion
25
AMTD
7, 1457–1493, 2014Retrieval of tropospheric column-averaged CH4mole fraction
Z. Wang et al.
Title Page
Abstract Introduction
Conclusions References
Tables Figures
◭ ◮
◭ ◮
Back Close
Full Screen / Esc
Printer-friendly Version
Interactive Discussion
Discussion
P
a
per
|
D
iscussion
P
a
per
|
Discussion
P
a
per
|
Discuss
ion
P
a
per
|
Atmospheric CH4 concentrations measurements can be linked quantitatively to re-gional sources and sinks by inverse modeling. Improving both the quality and quantity of measurements is a way to better constrain source and sinks, since it is an under-constrained problem. The Total Carbon Column Observation Network (TCCON) was founded to remotely measure column abundances of CO2, CH4, CO, N2O and other
5
molecules that absorb in the near infrared (NIR) (Wunch et al., 2011). The Network for the Detection of Atmospheric Composition Change (NDACC) ground-based solar absorption spectrometry in mid infrared (MIR) spectral regions can provide total col-umn measurement for many gases (Sussmann et al., 2013). Such colcol-umn data are essential for the validation of greenhouse gas measurements from satellites and as
10
input or independent validation for inverse model studies. The column-averaged dry-air mole fraction (DMF) of CH4(known asXCH4) can be determined by ratioing to the re-trieved column of the reference gas O2, whose atmospheric abundance is well known. The tropospheric column-averaged mole fraction of CH4 can be derived using meth-ods based on: (i) a posteriori correction using a proxy for variations in the stratospheric
15
contribution to the total column, such as the HF total column as an estimator for the stratospheric CH4contribution (Washenfelder et al., 2003; Warneke et al., 2006); and (ii) direct determination of the tropospheric mole fraction of CH4via retrieval of CH4 pro-files (Sepúlveda et al., 2012). Currently the second method is only applied to NDACC high-resolution MIR solar absorption spectra, not to the NIR TCCON spectra. The first
20
method is based on the fact that HF is solely present in the stratosphere and a linear relationship exists between the DMFs of the CH4 and HF with respect to changes in tropopause height. The stratospheric column of the CH4can therefore be inferred from the total column of the HF via this linear relationship, and then subtracted from the total column of the CH4 to yield the tropospheric CH4 column. Variations in the CH4
25
AMTD
7, 1457–1493, 2014Retrieval of tropospheric column-averaged CH4mole fraction
Z. Wang et al.
Title Page
Abstract Introduction
Conclusions References
Tables Figures
◭ ◮
◭ ◮
Back Close
Full Screen / Esc
Printer-friendly Version
Interactive Discussion
Discussion
P
a
per
|
D
iscussion
P
a
per
|
Discussion
P
a
per
|
Discuss
ion
P
a
per
|
In stratosphere, a compact correlation exists between species of sufficiently long lifetime (Plumb et al., 1992). Species whose local lifetimes are longer than quasi-horizontal transport time scales share surfaces of constant mixing ratio, and a scat-ter plot of the mixing ratio of one vs. that of the other collapses to a compact curve. These correlations have been demonstrated by datasets from both chemical transport
5
model and in situ measurements, such as observations taken from an aircraft platform (Avallone et al., 1997), ATMOS observations (Michelson et al., 1998) and balloon ob-servations (Herman et al., 1998). This is true in the case of CH4and N2O in the strato-sphere. Hence, using N2O to infer the stratospheric contribution of the total column of the CH4is an alternative approach, which is however complicated by the fact that N2O
10
is also present in the troposphere. In this work, we describe a method to derive the tropospheric column-averaged DMF of CH4in which the stratospheric N2O column is used to estimate the stratospheric column of the CH4. We apply the method to TCCON spectra at four sites, one tropical, two extra-tropical and one polar, and compare it with the results derived with the method using HF. In the following Sect. 2 introduce
mea-15
surements site and data. Section 3 describes the method, while Sect. 4 presents the results and discussion. In Sect. 5 we give an uncertainty analysis and summarize the merits of our proposed method in Sect. 6.
2 Measurements site and data analysis
2.1 FTIR data
20
Here we use solar absorption Fourier-Transform (FT) measurements at four TC-CON stations Ny-Ålesund (78.9◦N, 11.9◦E) at Spitsbergen (Palm et al., 2010),
Orléans (47.97◦N, 2.113◦E) in France, Bialystok (53.23◦N, 23.025◦E) in Poland
(Messerschmidt et al., 2010, 2012), and Darwin (12.424◦S, 130.892◦E) in Australia
(Deutscher et al., 2010). The observations in the near infrared cover the spectral range
AMTD
7, 1457–1493, 2014Retrieval of tropospheric column-averaged CH4mole fraction
Z. Wang et al.
Title Page
Abstract Introduction
Conclusions References
Tables Figures
◭ ◮
◭ ◮
Back Close
Full Screen / Esc
Printer-friendly Version
Interactive Discussion
Discussion
P
a
per
|
D
iscussion
P
a
per
|
Discussion
P
a
per
|
Discuss
ion
P
a
per
|
between 4000 cm−1 and 10 000 cm−1 and were carried out with a CaF2 beamsplitter and a room-temperature InGaAs photodiode.
The spectra were analyzed using the non-linear least-squares spectral fitting algo-rithm code GFIT, developed at NASA/JPL (Toon et al., 1992). Atmospheric absorption coefficients are calculated line-by-line for each gas in a chosen spectral window, and 5
for each retrieval level using the assumed temperature, pressure and a priori DMF pro-file in the forward model. All these absorption coefficients together produce the atmo-spheric transmittance spectrum. The temperature, pressure and water vapor profiles are obtained from National Centers for Environmental Prediction (NCEP) reanalysis data provided by the NOAA/ESRL Physical Sciences Division (Kalnay et al., 1996),
10
and interpolated in time and space from six hourly data to local solar noon and site lati-tude/longitude. The simulated spectrum is compared with the measured spectrum and DMF profiles are iteratively scaled to minimize the least-squares differences between the calculated and measured spectra. The measured spectra are solar radiation added by absorption feature of atmospheric gases. The spectral regions used in this study
15
are the TCCON-standard regions given in Wunch et al. (2010).
2.2 In situ measurements
To validate the tropospheric CH4 derived from FTIR measurements, in situ data from several sources are used. At Ny-Ålesund (78.9◦N, 11.9◦E) in situ CH
4data are
avail-able from NOAA surface flask measurements (Dlugokencky et al., 2012) measured at
20
Zeppelin mountain. Its elevation is 474 m a.s.l. There are low aircraft flight data available at Orléans, which have been taken two times every month since 1998 and up to 3 km, corresponding to 700 hPa in pressure coordinate. Over Bialystok there is regular pro-filing with semi-monthly to monthly observations using flask sampling at multiple levels up to 3 km for CO2, CH4, N2O and other tracers since 2002. These measurements are
25
AMTD
7, 1457–1493, 2014Retrieval of tropospheric column-averaged CH4mole fraction
Z. Wang et al.
Title Page
Abstract Introduction
Conclusions References
Tables Figures
◭ ◮
◭ ◮
Back Close
Full Screen / Esc
Printer-friendly Version
Interactive Discussion
Discussion
P
a
per
|
D
iscussion
P
a
per
|
Discussion
P
a
per
|
Discuss
ion
P
a
per
|
tropospheric column-averaged CH4 abundances obtained are used to check the sea-sonal behavior of the FTIR tropospheric column-averaged CH4mole fraction.
In addition, data from the HIPPO and IMECC aircraft campaigns are used to calibrate the derived tropospheric column-averaged CH4 mole fractions. The HIAPER Pole-to-Pole Observations (HIPPO) of Carbon Cycle and Greenhouse Gases Study measures
5
cross sections of atmospheric concentrations approximately pole-to-pole, from the sur-face to the tropopause (Wofsy et al., 2011). A comprehensive suite of atmospheric trace gases pertinent to understanding the Carbon Cycle were measured. The mea-surements are taken using the High-performance instrumented Airborne Platform for Environmental Research (HIAPER). In this work, the measurements near the TCCON
10
site at Darwin are used. The IMECC project aimed to build the infrastructure for a co-ordinated, calibrated, integrated and accessible dataset for characterizing the carbon balance of the European. The aircraft campaign conducted within the IMECC project was organized by the Max Planck Institute for Biogeochemistry. Learjet 35 aircraft was equipped with a cavity ringdown spectroscopy instrument (Picarro Inc.) for CO2 and
15
CH4mixing ratio measurements and with a vacuum UV fluorescence analyzer for mix-ing ratio measurements of CO. Profiles were taken from 300 m to 12 000 m over the European TCCON stations including Bialystok and Orléans during September and Oc-tober in 2009 (Geibel et al., 2012).
3 Method
20
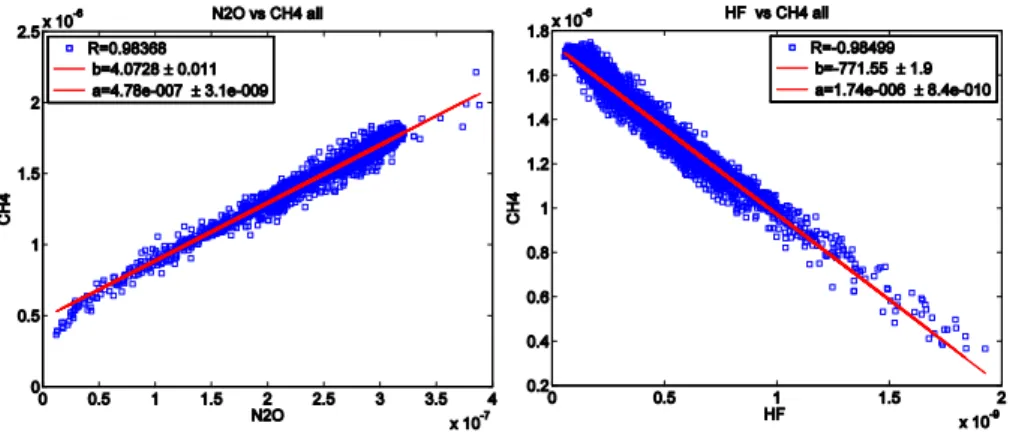
For both HF and N2O, assuming there is a linear relationship between their strato-spheric mole fractions,x, and that of the CH4in the stratosphere, then
xCH4(z)=a+b·x
y(z) (1)
where, y represents HF or N2O. Figure 1 presents the correlation of the strato-spheric mole fractions of HF (left) and N2O (right) with CH4 based on retrievals from
AMTD
7, 1457–1493, 2014Retrieval of tropospheric column-averaged CH4mole fraction
Z. Wang et al.
Title Page
Abstract Introduction
Conclusions References
Tables Figures
◭ ◮
◭ ◮
Back Close
Full Screen / Esc
Printer-friendly Version
Interactive Discussion
Discussion
P
a
per
|
D
iscussion
P
a
per
|
Discussion
P
a
per
|
Discuss
ion
P
a
per
|
the ACE-FTS satellite (Bernath et al., 2005). For the derivation of a and b, the re-trieved stratospheric profiles of HF, N2O and CH4 are separated into several 20◦
wide latitude bands. In case of HF, the latitudinal variation of the slope b ranges from 740∼870 ppb ppb−1, and from 3.6 to 4.4 ppb ppb−1 for N2O. Between 2004 and
2010 no discernable time-dependency could be detected. For the four TCCON sites:
5
Spitsbergen, Bialystok, Orléans and Darwin their corresponding slopesbfor their cor-responding latitude bands are 4.34, 4.39, 4.39 and 3.53 respectively for N2O, and −749.05,−751.21,−751.21 and−876.03 for HF.
Here, we employ two strategies to retrieve the tropospheric column-averaged CH4 mole fraction. Each one is described below: one strategy explicitly uses tropopause
10
pressure to correct for the contribution of stratospheric CH4and the other one relies on the variation of HF or N2O to implicitly derive the tropopause height.
3.1 Strategy explicitly using tropopause pressure
Multiplying both sides of Eq. (1) with air density and integrating it over the stratosphere yields,
15
VCstratCH 4
=a·VCstrat
air +b·VC strat
y (2)
where VC denotes the vertical column. The stratospheric column ofy can be obtained by subtracting the tropospheric column from the total column, so Eq. (2) can be rewrit-ten as follows:
VCstratCH 4
=a·VCstrat
air +b
VCy−VCtropy
(3)
20
The tropospheric column-averaged mole fraction of the CH4is then calculated as:
XCHtrop 4
= VCCH
4−VC
strat CH4
VCtropair
AMTD
7, 1457–1493, 2014Retrieval of tropospheric column-averaged CH4mole fraction
Z. Wang et al.
Title Page
Abstract Introduction
Conclusions References
Tables Figures
◭ ◮
◭ ◮
Back Close
Full Screen / Esc
Printer-friendly Version
Interactive Discussion
Discussion
P
a
per
|
D
iscussion
P
a
per
|
Discussion
P
a
per
|
Discuss
ion
P
a
per
|
In Eq. (3) the tropospheric column of HF is zero. The mole fraction of N2O is almost con-stant with respect to altitude in the troposphere. In addition, the seasonal and long-term variation of the N2O mole fraction is quite small, and therefore highly predictable. So the tropospheric column of N2O can then be calculated as the product of its mole fraction and the dry air column in the troposphere. The mole fraction of N2O in the troposphere
5
can be obtained from in situ measurements or a model simulation. The distribution of N2O is fairly uniform with relatively small variability (3–5 ppb) (Kort et al., 2011). In this paper a simple linear model is applied, an N2O growth rate of 0.75 ppb yr−1 is assumed from a background concentration of 315 ppb at the start of the year 2000 (http://www.esrl.noaa.gov/gmd/hats/combined/N2O.html). The dry air columns in the
10
stratosphere and troposphere are derived as follows: firstly using the surface pressure and the tropopause pressure to calculate these dry air columns,
VCtropair = Ps−Pt mdryair ·g(p)
−VCH2O· mH2O
mdryair
(5)
VCstratair = Pt mdryair ·g(p)
(6)
15
where,PsandPtare surface pressure and tropopause pressure, respectively,mdryair and mH2Oare the molecular mass of dry air and H2O, respectively, andg(p) is the absorber weighted gravitational acceleration. Equation (6) also makes use of the fact that the stratosphere is extremely dry. The surface pressure is obtained from in situ measure-ments while the tropopause pressure is derived from the NCEP temperature profile. In
20
AMTD
7, 1457–1493, 2014Retrieval of tropospheric column-averaged CH4mole fraction
Z. Wang et al.
Title Page
Abstract Introduction
Conclusions References
Tables Figures
◭ ◮
◭ ◮
Back Close
Full Screen / Esc
Printer-friendly Version
Interactive Discussion
Discussion
P
a
per
|
D
iscussion
P
a
per
|
Discussion
P
a
per
|
Discuss
ion
P
a
per
|
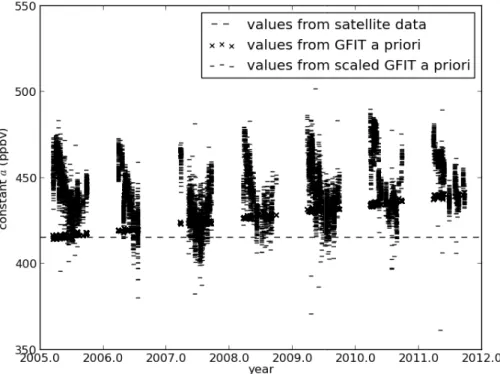
b. Since we can assume that the N2O mole fraction is a constant known quite well and
the HF mole fraction is zero throughout the troposphere, we can calculate the constant aif we know the CH4mole fraction at tropopause. This is done iteratively, starting from the constanta derived from satellite measurements and then using Eqs. (3) and (4) to calculate the tropospheric column-averaged CH4 mole fraction. Since we need to
5
know the CH4 mole fraction at the tropopause the relative distribution profile of CH4 mole fraction in the troposphere is needed. Here the GFIT a priori profile is assumed. Then this profile of CH4is scaled so that the tropospheric column-averaged CH4mole fraction calculated from the scaled a priori profile is equal to that derived using Eqs. (3) and (4). Then the mole fraction value of the scaled a priori CH4 profile at tropopause
10
is used to calculate the new value of the constant a. This process is repeated until that the change in the constantais overlooked. Figure 2 gives a comparison between constantaderived from the original and scaled GFIT a priori and the satellite data at Spitsbergen.
According to the results of Eqs. (5) and (6), the relative fractions of tropospheric and
15
stratospheric dry air column can be determined. The total dry air column inferred from the O2column is then separated into tropospheric and stratospheric parts according to these fractions. The dry air columns in the stratosphere and troposphere derived from O2 column are used in Eqs. (3) and (4). Although surface pressure can be measured with better precision than the O2 column, using O2 column takes into account factors
20
that affect CH
4, N2O, HF and O2column retrievals in a common way – pointing/tracking,
any light path variations etc. In the calculation above, the water vapor is assumed to be located completely in the troposphere. We also tested the assumption that the retrieved water vapor profile is vertically distributed as described in the a priori (that is, according to the NCEP profile). The two methods produce a difference of less than 0.5 ppb in the 25
AMTD
7, 1457–1493, 2014Retrieval of tropospheric column-averaged CH4mole fraction
Z. Wang et al.
Title Page
Abstract Introduction
Conclusions References
Tables Figures
◭ ◮
◭ ◮
Back Close
Full Screen / Esc
Printer-friendly Version
Interactive Discussion
Discussion
P
a
per
|
D
iscussion
P
a
per
|
Discussion
P
a
per
|
Discuss
ion
P
a
per
|
3.2 Strategy implicitly using tropopause pressure
In the case of the HF, when approaching the tropopause, the HF mole fraction ap-proaches zero and so the constanta in Eq. (1) represents CH4 mole fraction around the tropopause. Washenfelder et al. (2003) consider a as the tropospheric column-averaged CH4 mole fraction, and use O2to infer the dry air column. Under these
con-5
ditions, inserting Eq. (3) into Eq. (4) yields the equation used by them,
XCHtrop 4
=a=0.2095(VCCH4−b·VCHF)
VCO2 (7)
This method can be used for N2O as well. Since in the troposphere, the N2O mole frac-tion is almost constant and its value can be quite well predicted, we then subtract the tropospheric N2O mole fraction from its mole fraction profile in the whole atmosphere.
10
Such a derived “species” will also be present completely in the stratosphere and Eq. (1) also holds as long as the constanta is replaced by a value equal to aplus the tropo-spheric N2O mole fraction multiplied by the slopeb, and consider this quantity as the tropospheric column-averaged CH4mole fraction. We obtain the following equation,
XCHtrop 4
=
VCCH4−b
VCy−XytropVCO2/0.2095
VCO2/0.2095 (8)
15
Xytropis replaced byXNtrop
2O for N2O or set to zero for HF. Compared with the strategy in Sect. 3.1, this approach does not use the tropopause pressure to correct for the strato-spheric contribution of CH4 column. The tropopause pressure used here is derived from the NCEP temperature profile and is therefore the thermal tropopause and not necessarily the same as the chemical tropopause. Variation of the location of thermal
20
AMTD
7, 1457–1493, 2014Retrieval of tropospheric column-averaged CH4mole fraction
Z. Wang et al.
Title Page
Abstract Introduction
Conclusions References
Tables Figures
◭ ◮
◭ ◮
Back Close
Full Screen / Esc
Printer-friendly Version
Interactive Discussion
Discussion
P
a
per
|
D
iscussion
P
a
per
|
Discussion
P
a
per
|
Discuss
ion
P
a
per
|
chemical tropopause. So the implicit strategy is free from the influence of inaccuracy in tropopause pressure.
3.3 Accounting for the averaging kernel effect
Due to the effect of the averaging kernel the straightforward equations above (Eqs. 4 and 8) need to be modified. The total column retrieved by GFIT is a weighted
sum-5
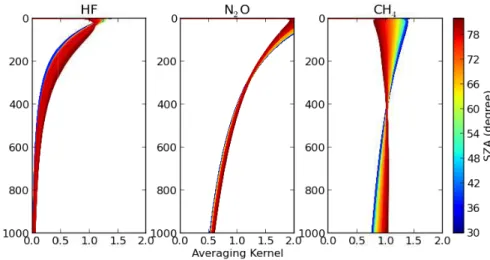
mation of partial columns at different altitudes. The weights are represented by the averaging kernel and a pressure weighting function that usually differs from one. The partial column reflected in the retrieved total column will be very different from its orig-inal value. Figure 3 presents the averaging kernels of HF, N2O and CH4 for Bialystok from all spectra during 2010. The averaging kernel mainly depends on the solar zenith
10
angle. In the case of N2O, the averaging kernel has a large weight in stratosphere and small weight in troposphere, so variations in the stratospheric column of N2O will be amplified in the retrieved total column compared to the true atmospheric variability, and tropospheric variations will be dampened. For CH4, the averaging kernel is close to unity at all altitudes, so the effect of the averaging kernel is small. From Rodgers 15
(2000) and Wunch et al. (2010) the mole fraction profile retrieved by a profile-scaling retrieval, such as that performed by GFIT, is:
xr=x
a+A(xt−xa) (9)
where, thexr,xt andxaare the retrieved, true and a priori mole fraction profile, respec-tively.Ais the averaging kernel. Integrating Eq. (10) and rearranging yields:
20
Ps
Z
0
xrdp
mg =
Ps
Z
0
(I−A)xa dp
mg+
Ps
Z
0
Axtstrat+xtrop
t
dp
mg (10)
where,mis the molecular mass of moist air (i.e.m=1−x
H2O
mairdry+x
AMTD
7, 1457–1493, 2014Retrieval of tropospheric column-averaged CH4mole fraction
Z. Wang et al.
Title Page
Abstract Introduction
Conclusions References
Tables Figures
◭ ◮
◭ ◮
Back Close
Full Screen / Esc
Printer-friendly Version
Interactive Discussion
Discussion
P
a
per
|
D
iscussion
P
a
per
|
Discussion
P
a
per
|
Discuss
ion
P
a
per
|
fraction profile is separated into stratospheric and tropospheric components. Because GFIT performs a profile scaling retrieval and produces the column averaging kernel vector (Connor, 2009) instead of a full averaging kernel matrix, when using a column averaging kernel Eq. (10) can be rewritten as:
Ps
Z
0
xrdp
mg =
Ps
Z
0
(1−a(p))xa dp
mg+
Ps
Z
Pt
a(p)xt dp
mg+
Pt
Z
0
a(p)xtdp
mg (11)
5
wherea(p) is the column averaging kernel vector, which is a function of pressure (al-titude). It can be seen from the equation above that there are three terms contributing to the retrieved total column: the a priori profile, and the tropospheric and stratospheric columns. We then define the following relationships:
α=
RPs
Pt xtd
p mg
RPs
Pt a(p)xtd
p mg
(12)
10
β=
RPt
0xtd
p mg
RPt 0a(p)xt
dp mg
(13)
γ=
Ps
Z
0
(1−a(p))xa dp
mg (14)
αis the ratio of the true tropospheric column to that reflected in the retrieved column,β has a same meaning for the stratosphere, andγ is the a priori part of the retrieved
col-15
AMTD
7, 1457–1493, 2014Retrieval of tropospheric column-averaged CH4mole fraction
Z. Wang et al.
Title Page
Abstract Introduction
Conclusions References
Tables Figures
◭ ◮
◭ ◮
Back Close
Full Screen / Esc
Printer-friendly Version
Interactive Discussion
Discussion
P
a
per
|
D
iscussion
P
a
per
|
Discussion
P
a
per
|
Discuss
ion
P
a
per
|
to give:
VCstratCH 4
=a·VCstrat
air +b·βy(VCy−VCtropy ·α−1y −γy) (15)
XCHtrop 4
=
αCH4VCCH
4−VC
strat CH4·β
−1
CH4−γCH4
VCtropair
(16)
In Eq. (15), multiplying VCtropy by the inverse of αy takes retrieval sensitivity of y in
5
the tropospheric part into account. Subtracting VCtropy ·αy−1 and γy from the retrieved total column VCy yields the stratospheric column of y reflected in its retrieved total column. Then multiplying byβyremoves retrieval sensitivity in the stratospheric column of y. In Eq. (16), multiplying VCstratCH
4 by the inverse of βCH4 takes retrieval sensitivity of CH4 to the stratospheric part into account. Subsequently subtracting VCstratCH
4·β
−1 CH4
10
and γCH4 from the retrieved total column gives the tropospheric column reflected in the retrieved column, and multiplying it with αCH4 removes retrieval sensitivity in the
tropospheric column of CH4. These coefficientsα andβdepend on the shape of true mole fraction profile, which is unknown. So the a priori profile is used to calculate the approximate value of these coefficients. The effectiveness of removing or taking 15
retrieval sensitivity into account in the manipulation above will depend on the difference between the shapes of the true and a priori mole fraction profiles. This could introduce additional error.
The error introduced by using Eqs. (3) and (4) is the smoothing error in the total column, and that using the Eqs. (15) and (16) is the error of the coefficientsαandβ. It 20
can be explained as follows, in Eq. (3) the total column ofy can be expressed as:
VCy = Ps
Z
0
xyt dp
mg+
Ps
Z
0
1−ay(p)
xya−xty
dp
AMTD
7, 1457–1493, 2014Retrieval of tropospheric column-averaged CH4mole fraction
Z. Wang et al.
Title Page Abstract Introduction Conclusions References Tables Figures ◭ ◮ ◭ ◮ Back Close
Full Screen / Esc
Printer-friendly Version Interactive Discussion Discussion P a per | D iscussion P a per | Discussion P a per | Discuss ion P a per |
The second term on the right of Eq. (17) is the smoothing error. Inserting Eq. (17) into Eq. (3) yields:
VCstratCH 4
=a·VCstrat
air +b Ps Z 0
xty dp
mg+
Ps
Z
0
1−ay(p)
xya−xyt
dp
mg−VC
trop
y
(18)
Without accounting for the error in the tropospheric column ofy, the term in brackets on the right of Eq. (18) is just the true stratospheric column of y plus the smoothing
5
error. For Eq. (15), where the equation accounts for the averaging kernel effect, when the a priori profile is used to calculate the coefficientsα andβit can rewritten as:
VCstratCH 4
=a·VCstrat
air +b· RPt
0 x
y
ad
p mg
RPt
0ay(p)x
y a
dp mg
VCy−VC trop
y ·
RPs
Pt ay(p)x
y a
dp mg
RPs
Pt x y
a dp mg
−γy
(19)
Inserting Eq. (17) into Eq. (19) and overlooking the error in the tropospheric column of y yields:
10
VCstratCH 4
=a·VCstrat
air +b·
RPt
0x
y
t dp mg
RPt
0 ay(p)x y t dp mg +e 1 Ps Z 0
ay(p)x y t dp mg− Ps Z Pt xyt dp
mg·
RPs
Pt ay(p)x
y t
dp mg
RPs
Pt x y t dp mg +e 2 (20)
Wheree1ande2are the errors related to the coefficientsα andβ,
e1=
RPt 0x
y
a dp mg
RPt
0ay(p)x
y
ad
p mg
−
RPt 0x
y
t dp mg
RPt
0ay(p)x
AMTD
7, 1457–1493, 2014Retrieval of tropospheric column-averaged CH4mole fraction
Z. Wang et al.
Title Page Abstract Introduction Conclusions References Tables Figures ◭ ◮ ◭ ◮ Back Close
Full Screen / Esc
Printer-friendly Version Interactive Discussion Discussion P a per | D iscussion P a per | Discussion P a per | Discuss ion P a per |
e2=
RPs
Pt ay(p)x y a
dp mg
RPs
Pt x
y
a dp mg
−
RPs
Pt ay(p)x y t
dp mg
RPs
Pt x
y
t dp mg
(22)
Rearranging the terms in Eq. (20) produces,
VCstratCH 4
=a·VCstrat air +b·
Pt Z 0
xyt dp mg+
Pt
Z
0
ay(p)xtydp mg·e1−
Ps
Z
Pt xtydp
mg· RPt
0 x
y
a dp mg
RPt
0 ay(p)x
y
a dp mg
·e2
(23)
Similar to Eq. (18), the term in brackets is the true stratospheric column of y plus
5
an error term that is different from the smoothing error. The smoothing error depends on the difference between the shapes of true mole fraction profile and the a priori, and also the overall inhomogeneity of the averaging kernel in the whole atmosphere. The smoothing error increases with an increase in the inhomogeneity of the averaging kernel. However the error term in Eq. (23) depends on e1 and e2, which depend on
10
the inhomogeneity of the averaging kernel and the difference between the shapes of the true and a priori mole fraction profiles in only the stratosphere and troposphere, respectively. It can be seen more clearly using another form:
e2=
RPs
Pt
RPs
Pt
ay(p1)−ay(p2)
xya(p1)xyt(p2)dp1
mg
dp2
mg
RPs
Pt
RPs
Pt x y
a(p1)x
y
t (p2) dp1
mg
dp2
mg
(24)
In Eq. (24), the term
ay(p1)−ay(p2)
is an anti-symmetric function about linep1=p
2
15
on plane (p1,p2) and termxay(p1)xyt(p2) is a symmetric function about this line provided the true mole fraction and the a priori profiles have the same shape in the troposphere. So,e2 depends on the amplitude of the first term, which is the inhomogeneity of the averaging kernel in the troposphere, and the symmetry of the second term. Similar arguments can be applied toe1. The difference between the stratospheric and tropo-20
AMTD
7, 1457–1493, 2014Retrieval of tropospheric column-averaged CH4mole fraction
Z. Wang et al.
Title Page
Abstract Introduction
Conclusions References
Tables Figures
◭ ◮
◭ ◮
Back Close
Full Screen / Esc
Printer-friendly Version
Interactive Discussion
Discussion
P
a
per
|
D
iscussion
P
a
per
|
Discussion
P
a
per
|
Discuss
ion
P
a
per
|
this sense the effect of the averaging kernel is removed since in our calculation the at-mosphere is viewed as consisting of only two layers, the stratosphere and troposphere. In addition the equation accounting for the averaging kernel effect does not apply to HF becuase it is solely present in the stratosphere.
Similarly for the strategy implicitly using tropopause pressure, after taking the
aver-5
aging kernel effect into account we get the following equations.
XCHtrop 4
=
VCCH4−γCH4−bµy
VCy−γy−ϕy·Xytrop·VCO2/0.2095
ϕCH4·VCO2/0.2095
(25)
ϕ=
Ps
Z
0
adp
mg/
Ps
Z
0
dp
mg (26)
µ=
Pt
Z
0
aCH4xt−xtropt
dp
mg/
Pt
Z
0
axt−xtropt
dp
mg (27)
10
For calculation of the coefficients ϕandµ, the true mole fraction profiles of N
2O and
HF are replaced by the GFIT a priori profile, and in the case of N2O, the a priori profile is scaled to fit the tropospheric N2O mole fraction we assumed before.xytropis replaced byXNtrop
2O for N2O or set to zero for HF.
To compare the derived tropospheric column-averaged CH4mole fraction with in situ
15
measurements, the measured CH4 profiles need to be integrated. At the same time, the averaging kernel of the FTS measurements needs to be taken into account. For our purpose only the tropospheric profile is important, and here we are only considering the case of the strategy implicitly using tropopause pressure. After replacing the total column in the right side of Eq. (25) by the right side of Eq. (10), assuming the coefficient 20
AMTD
7, 1457–1493, 2014Retrieval of tropospheric column-averaged CH4mole fraction
Z. Wang et al.
Title Page
Abstract Introduction
Conclusions References
Tables Figures
◭ ◮
◭ ◮
Back Close
Full Screen / Esc
Printer-friendly Version
Interactive Discussion
Discussion
P
a
per
|
D
iscussion
P
a
per
|
Discussion
P
a
per
|
Discuss
ion
P
a
per
|
averaging kernel can be represented as:
XCHtrop 4
=
RPs
Pt aCH4xt
dp mg
RPs
Pt aCH4
dp mg
(28)
to integrate the aircraft data, withxt simply replaced by the in situ profile.
3.4 Taking calibration factors into account
The derivations above are based on the total columns of CH4, N2O and HF, but the total
5
columns directly retrieved from the spectra include errors arising from spectroscopy im-perfections and instrumental effects. The final TCCON products are the dry air column averaged mole fractionXCH4,XN2OandXHF, which have been corrected by airmass in-dependent and airmass in-dependent calibration factors to account for such errors. These corrections should be taken into account for this work. For the strategy explicitly using
10
tropopause pressure, after combining Eqs. (15) and (16) the final equation becomes,
XCHtrop 4
=αCH4
f
XCH4−
a(1−f)+b·βy
Xy−Xytrop·f·αy−1−
γy VCair
β−1
CH4− γCH
4 VCair
, (29)
where,f is the fraction of the tropospheric dry air column in the total dry air column, and VCair is the summation of the left hand sides of Eqs. (5) and (6). For the strategy implicitly using tropopause pressure, the Eq. (26) can be written as:
15
XCHtrop 4
= 1 ϕCH4
XCH4− γCH4
VCair−b·µy
Xy− γy
VCair−ϕy·X
trop
y
(30)
The airmass independent calibration factors are taken as those used throughout TC-CON (Wunch et al., 2010). These factors have been re-evaluated by Geibel (2012) based on European sites, but this reevaluation is not taken into account because it has not been applied to the current TCCON release.
AMTD
7, 1457–1493, 2014Retrieval of tropospheric column-averaged CH4mole fraction
Z. Wang et al.
Title Page
Abstract Introduction
Conclusions References
Tables Figures
◭ ◮
◭ ◮
Back Close
Full Screen / Esc
Printer-friendly Version
Interactive Discussion
Discussion
P
a
per
|
D
iscussion
P
a
per
|
Discussion
P
a
per
|
Discuss
ion
P
a
per
|
4 Results
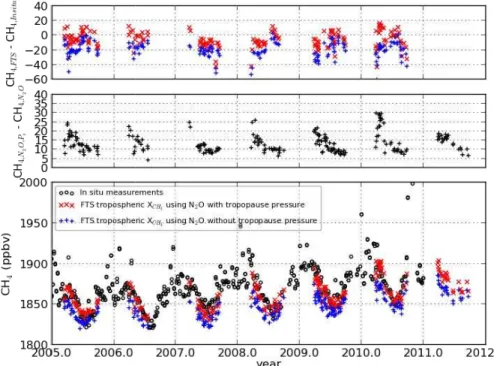
To test the method described in Sect. 3, data from four TCCON sites at Spitsber-gen, Orléans, Bialystok and Darwin are used. Figure 4 presents the comparison for the two strategies described in Sect. 3 at Spitsbergen in the case of N2O, since only at this site do the two methods produce a significant difference. The method explic-5
itly using tropopause pressure results in a larger value in comparison with in situ data in winter time. This might arise from an error in the tropopause pressure de-rived from the NCEP temperature profile. During wintertime the tropopause is lower and this method is more sensitive to such an error. The seasonal cycle amplitude in tropospheric column-averaged CH4 mole fraction resulting from the method implicitly
10
using tropopause pressure is weaker than that observed in collocated in situ data. It is not clear how the in situ data differ from tropospheric column-averaged value at this site. In the case of HF, the method explicitly using tropopause pressure also produce higher value, but the difference is only around 10 ppb around. In the iteration process of the method explicitly using tropopause pressure, the vertical distribution of CH4 in
15
the troposphere should be known to derive CH4 mole fraction at tropopause from the tropospheric column-averaged concentration. The GFIT a priori distribution is assumed here. So, for all the following results, the strategy implicitly using tropopause pressure is applied.
4.1 Comparison between the N2O and HF methods and in situ data
20
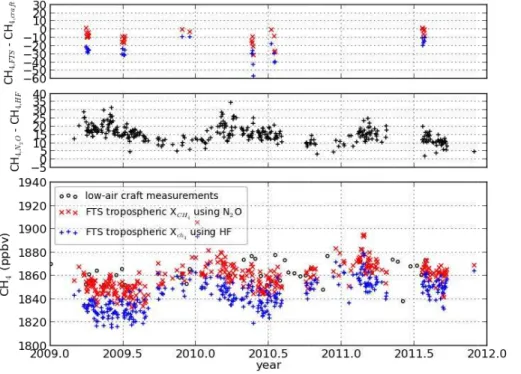
Figures 5–8 show the results for Spitsbergen, Orléans, Bialystok and Darwin. We com-pare to in situ data from NOAA at Spitsbergen, and the low aircraft data at Orléans and Bialystok. These profiles have been extended into whole troposphere as described in Sect. 2.2, and then integrated to produce a tropospheric column-averaged CH4 mole fraction. At all sites with in situ data available for comparison the results using N2O are
25
AMTD
7, 1457–1493, 2014Retrieval of tropospheric column-averaged CH4mole fraction
Z. Wang et al.
Title Page
Abstract Introduction
Conclusions References
Tables Figures
◭ ◮
◭ ◮
Back Close
Full Screen / Esc
Printer-friendly Version
Interactive Discussion
Discussion
P
a
per
|
D
iscussion
P
a
per
|
Discussion
P
a
per
|
Discuss
ion
P
a
per
|
results using N2O are about 30 ppb higher than that using HF, about 20 ppb at Bialystok and Orléans, and about−10 ppb around at Darwin. Such difference might result from the uncertainty in the HF column. The HF column used here is not calibrated through in situ profile measurements since HF is located completely in the stratosphere and there are no such measurements currently available. Inaccuracy in the spectroscopy of HF
5
will force the retrieved HF column away from the truth. Such an effect also depends on the HF total column. A stronger signal is more sensitive to a spectroscopy parameter error. This might partly explain the site dependence of the difference between the re-sults using N2O and HF since every site has its own characteristic tropopause pressure and HF column.
10
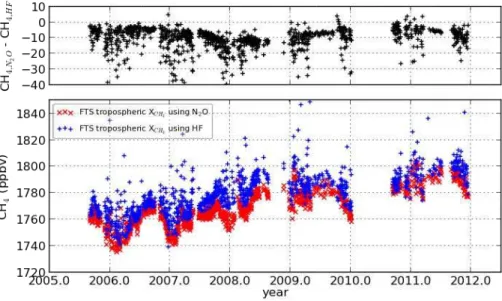
Another difference is that the results using HF have more scatter at Darwin than at the other three sites, however, results using N2O have similar scatter for all four sites. This difference also arises from HF column error. In the NIR the HF column is retrieved from a weak spectral absorption line that is located at the shoulder of a water line. Therefore, the retrieval of HF suffers from water vapor interference. Such 15
influence depends on both the water amount and its vertical distribution, and results in more scatter. In the tropics the higher amount of water vapor in atmosphere will influence HF column significantly. Another factor is that HF is completely located in the stratosphere, and since generally the tropopause height increase from high to low latitude, the column amount of HF decreases. Retrieval of HF has better precision and
20
worse accuracy for the case of larger HF column due to more significant signal and larger effect from spectroscopy error respectively, and vice versa. The performance of the HF method should be more stable but have a larger offset for high-latitude sites like Spitsbergen owing to the dry conditions and more significant signals, and be less stable and have a smaller offset for tropical sites like Darwin because of the moisture 25
conditions and relatively weaker signals.
AMTD
7, 1457–1493, 2014Retrieval of tropospheric column-averaged CH4mole fraction
Z. Wang et al.
Title Page
Abstract Introduction
Conclusions References
Tables Figures
◭ ◮
◭ ◮
Back Close
Full Screen / Esc
Printer-friendly Version
Interactive Discussion
Discussion
P
a
per
|
D
iscussion
P
a
per
|
Discussion
P
a
per
|
Discuss
ion
P
a
per
|
like biomass burning and industrial sources, depending on the strength of the sources such an assumption might not be valid. As the same tropospheric N2O mole fraction is used for all sites, the difference between different regions is also neglected. This can also cause problem for site where there are strong local N2O sources. Sensitivity test reveals that a 2 ppb perturbation in assumed tropospheric N2O mole fraction (an
5
estimation of its seasonal cycle amplitude) results in perturbation in the derived tropo-spheric column-averaged CH4 mole fraction of 4.0∼4.4 ppb at Darwin, 4.2∼5.6 ppb at Orléans and 4.5∼5.5 ppb at Spitsbergen.
4.2 Comparison with aircraft profile data
In situ profiles from the aircraft campaigns HIPPO and IMECC are used to compare
10
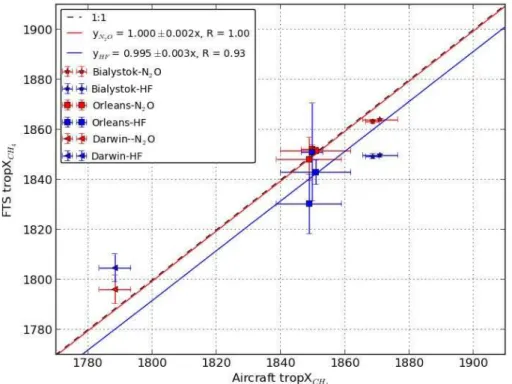
the derived tropospheric column-averaged CH4mole fraction and assess the inter-site consistency of the methods. Figure 9 shows the results. The aircraft data at Bialystok and Orléans are from the IMECC campaign, and at Darwin from the HIPPO-4 cam-paign. According to definition, the tropospheric column-averaged CH4 mole fraction is the mean abundance between the surface and the chemical tropopause. The aircraft
15
profiles do not extend high enough to identify the chemical tropopause, so instead the thermal tropopause is used. The GFIT a priori profile is used for altitudes between the highest sample and the tropopause altitude. The a priori profile has been scaled to match the aircraft profile in the sampled tropospheric part. The mole fraction at the lowest sample point is extended to the surface to complete the profile below the lowest
20
measured point during the aircraft flight.
The constructed profiles are then integrated using Eq. (28). Results from FTIR during the aircraft measurement period are averaged to give a final value. The uncertainty of FTIR data is estimated as the standard deviation of these results. The uncertainty of the tropospheric CH4 integrated from the aircraft profile is calculated as the mean of
25
AMTD
7, 1457–1493, 2014Retrieval of tropospheric column-averaged CH4mole fraction
Z. Wang et al.
Title Page
Abstract Introduction
Conclusions References
Tables Figures
◭ ◮
◭ ◮
Back Close
Full Screen / Esc
Printer-friendly Version
Interactive Discussion
Discussion
P
a
per
|
D
iscussion
P
a
per
|
Discussion
P
a
per
|
Discuss
ion
P
a
per
|
is 1.8 %. For the altitude range where the scaled GFIT a priori is used an uncertainty of 1.8 % is assumed. This represents the largest contribution to the total uncertainty. The uncertainties for the points above the aircraft ceiling are estimated from instrumental performance and variation of CH4 mole fraction along the aircraft path. In general the results using N2O more closely fall on the fitted line. The distances between scatter
5
points and fitted line are 3.5, 4.6, 2.1, 0.8, 0.2, 5.7 ppb for results derived using the N2O and 7.6, 9.0, 6.9, 0.4, 7.1, 17.2 ppb for the HF method.
5 Uncertainty analysis
The Gaussian error propagation equation is used to estimate the uncertainty in cal-culating the tropospheric column-averaged mole fraction of CH4 using Eq. (30). The
10
variation of tropospheric mole fraction of N2O during one day is small and might cause bias that varies on seasonal time scale. We concentrate on the estimation of preci-sion here. So the errors in the assumed tropospheric mole fraction of N2O were not taken into account. Besides, the errors in the coefficients accounting for the averaging kernel effect are overlooked as well since they are unknown. The errors of the slope 15
parameters (b) are estimated as 0.011 (N2O) and 1.9 (HF).
The errors of the XCH4, XN2O and XHF are taken as the uncertainties estimated in GFIT. As an alternative approach of estimating the uncertainty, we calculate the stan-dard deviation of the derived tropospheric column-averaged CH4mole fractions during a day. To ensure the calculated standard deviation is meaningful and that days with fine
20
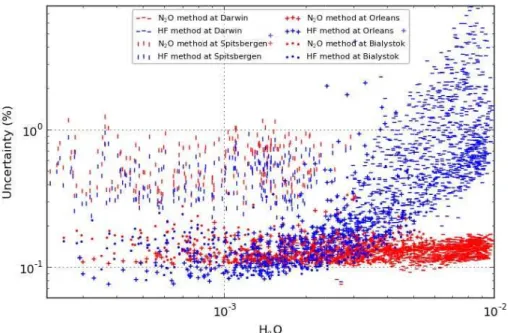
weather condition are considered, only those days with more than 50 spectra available at Spitsbergen and 100 spectra available at other sites are used. Figure 10 presents the estimated relative uncertainty for all sites using Gaussian error propagation equa-tion method and Fig. 11 presents results using the standard deviaequa-tion method. The two methods produce results with similar behavior. The mean relative standard
devi-25
AMTD
7, 1457–1493, 2014Retrieval of tropospheric column-averaged CH4mole fraction
Z. Wang et al.
Title Page
Abstract Introduction
Conclusions References
Tables Figures
◭ ◮
◭ ◮
Back Close
Full Screen / Esc
Printer-friendly Version
Interactive Discussion
Discussion
P
a
per
|
D
iscussion
P
a
per
|
Discussion
P
a
per
|
Discuss
ion
P
a
per
|
0.20 % respectively in the case of HF. So the method using HF produces larger un-certainties, especially at Darwin. Also the uncertainty of the method using HF has a stronger H2O dependence. This is because the retrieval of HF column suffers strong interference from H2O, and so does the derived tropospheric column-averaged CH4 mole fraction.
5
6 Conclusions
In this paper, we propose using N2O to correct for the stratospheric contribution to the total column of CH4in order to derive a tropospheric column-averaged CH4mole frac-tion. This method is applied to four TCCON sites data. At Spitsbergen and Orléans, the tropospheric CH4derived using N2O and HF are compared with surface flask
mea-10
surements and low aircraft profiles data, respectively. At both sites, the results using N2O agree better with in situ measurements than the HF derived results. Uncertainty analysis reveals that N2O method results in smaller uncertainty than HF at all sites. The mean relative standard deviations are 0.23 % and 0.52 % for the methods using N2O and HF, respectively. Especially, at Darwin the HF method produces much larger
un-15
certainty (0.93 % compared with 0.15 % of N2O method), which clearly indicates a de-pendence on H2O that is absent for the N2O method. This N2O method has also been compared with aircraft profiles at three sites, and the result reveals that N2O method has better inter-site consistency. The sensitivity of the derived tropospheric CH4to the assumed tropospheric N2O mole fraction is 4∼5 ppb per 2 ppb. Further work can be
20
done to represent N2O mole fraction in troposphere more realistically.
Acknowledgements. This work was funded by the EU-project InGOS. Furthermore the authors acknowledge the EU-projects ICOS-INWIRE for support of the measurements, the EU-project IMECC for the aircraft data at Orleans and Bialystok, additional funding for IMECC aircraft data by the Max Plank Society, and the sponsors of the HIPPO project: the National Science 25
AMTD
7, 1457–1493, 2014Retrieval of tropospheric column-averaged CH4mole fraction
Z. Wang et al.
Title Page
Abstract Introduction
Conclusions References
Tables Figures
◭ ◮
◭ ◮
Back Close
Full Screen / Esc
Printer-friendly Version
Interactive Discussion
Discussion
P
a
per
|
D
iscussion
P
a
per
|
Discussion
P
a
per
|
Discuss
ion
P
a
per
|
Center for atmospheric Research and Steven C. Wofsy for providing aircraft data at Darwin. We thank NOAA, Earth System Research Laboratory, Global Monitoring Division for providing surface CH4 flask data.
References
Avallone, L. M. and Prather, M. J.: Tracer-tracer correlations: three-dimensional model simula-5
tions and comparisons to observations, J. Geophys. Res., 102, 19233–19246, 1997. Bernath, P. F., McElroy, C. T., Abrams, M. C., Boone, C. D., Butler, M., Camy-Peyret, C.,
Car-leer, M., Clerbaux, C., Coheur, P.-F., Colin, R., DeCola, P., DeMazière, M., Drunnond, J. R., Dufour, D., Evans, W. F. J., Fast, H., Fussen, D., Gilber, K., Jennings, D. E., Llewellyn, E. J., Lowe, R. P., Mahieu, E., McConnell, J. C., McHugh, M., McLeod, S. D., Michaud, R., Mid-10
winter, C., Nassar, R., Nichitiu, F., Nowlan, C., Rinsland, C. P., Rochon, Y. ., Rolands, N., Sememiuk, K., Simom, P., Skelton, R., Sloan, J. J., Soucy, M.-A., Strong, K., Tremblay, P., Turnbull, D., Walker, K. A., Walkty, I., Wardle, D. A., Wehrle, V., Zander, R., and Zou, J.: Atmo-spheric Chemistry Experiment (ACE): mission overview, Geophys. Res. Lett., 32, L15S01, doi:10.1029/2005GL022386, 2005.
15
Bousquet, P., Ringeval, B., Pison, I., Dlugokencky, E. J., Brunke, E.-G., Carouge, C., Cheval-lier, F., Fortems-Cheiney, A., Frankenberg, C., Hauglustaine, D. A., Krummel, P. B., Langen-felds, R. L., Ramonet, M., Schmidt, M., Steele, L. P., Szopa, S., Yver, C., Viovy, N., and Ciais, P.: Source attribution of the changes in atmospheric methane for 2006–2008, Atmos. Chem. Phys., 11, 3689–3700, doi:10.5194/acp-11-3689-2011, 2011.
20
Connor, B.: Column averaging kernel definition, for TCCON community available at: https:// tccon-wiki.caltech.edu/Software/GGG/Averaging_Kernels (last access: 12 February 2013), 2009.
Deutscher, N. M., Griffith, D. W. T., Bryant, G. W., Wennberg, P. O., Toon, G. C., Washen-felder, R. A., Keppel-Aleks, G., Wunch, D., Yavin, Y., Allen, N. T., Blavier, J.-F., Jiménez, R., 25
Daube, B. C., Bright, A. V., Matross, D. M., Wofsy, S. C., and Park, S.: Total column CO2
measurements at Darwin, Australia – site description and calibration against in situ aircraft profiles, Atmos. Meas. Tech., 3, 947–958, doi:10.5194/amt-3-947-2010, 2010.
AMTD
7, 1457–1493, 2014Retrieval of tropospheric column-averaged CH4mole fraction
Z. Wang et al.
Title Page
Abstract Introduction
Conclusions References
Tables Figures
◭ ◮
◭ ◮
Back Close
Full Screen / Esc
Printer-friendly Version
Interactive Discussion
Discussion
P
a
per
|
D
iscussion
P
a
per
|
Discussion
P
a
per
|
Discuss
ion
P
a
per
|
constraints on recent increases in the atmospheric CH4 burden, Geophys. Res. Lett., 36,
L18803, doi:10.1029/2009GL039780, 2009.
Dlugokencky, E. J., Lang, P. M., Crotwell, A. M., Masarie, K. A., and Crotwell, M. J.: Atmospheric Methane Dry Air Mole Fractions from the NOAA ESRL Carbon Cycle Cooperative Global Air Sampling Network, 1983–2012, Version: 2013-08-28, available at: ftp://aftp.cmdl.noaa.gov/ 5
data/trace_gases/ch4/flask/surface/ (last access: 12 February 2013), 2013.
Geibel, M. C., Messerschmidt, J., Gerbig, C., Blumenstock, T., Chen, H., Hase, F., Kolle, O., Lavrič, J. V., Notholt, J., Palm, M., Rettinger, M., Schmidt, M., Sussmann, R., Warneke, T., and Feist, D. G.: Calibration of column-averaged CH4over European TCCON FTS sites with airborne in-situ measurements, Atmos. Chem. Phys., 12, 8763–8775, doi:10.5194/acp-12-10
8763-2012, 2012.
Herman, R. L., Scott, D. C., Webster, C. R., May, R. D., Moyer, E. J., Salawitch, R. J., Yung, Y. L., Toon, G. C., Sen, B., Margitan, J. J., Rosenlof, K. H., Michelson, H. A., and Elkins, J. W.: Trop-ical entrainment timescales inferred from stratospheric N2O and CH4observations, Geophys.
Res. Lett., 25, 2781–2784, 1998. 15
Kort, E. A., Patra, P. K., Ishijima, K., Daube, B. C., Jiménez, R., Elkins, J., Hurst, D., Moore, F. L., Sweeney, C., and Wofsy, S. C.: Tropospheric distribution and variability of N2O: evidence
for strong tropical emissions, Geophys. Res. Lett., 38, L15806, doi:10.1029/2011GL047612, 2011.
Kalnay, K., Kanamitsu, M., Kistler, R., Collins, W., Deaven, D., Candin, L., Iredell, M., Saha, 20
S., White, G., Woollen, J., Zhu, Y., Leetmaa, A., Reynolds, R., Chelliah, M., Ebisuzaki, W., Higgins, W., Janowiak, J., Mo, K. C., Ropelewski, C., Wang, J., Jenne, R., and Joseph, D.: The NCEP/NCAR 40-year reanalysis project, B. Am. Meteorol. Soc., 77, 437–470, 1996. Messerschmidt, J., Macatangay, R., Notholt, J., Petri, C., Warneke, T., and Weinzierl, C.: Side
by side measurements of CO2by ground-based Fourier transform spectrometry (FTS), Tellus
25
B, 62, 749–758, 2010.
Messerschmidt, J., Chen, H., Deutscher, N. M., Gerbig, C., Grupe, P., Katrynski, K., Koch, F.-T., Lavrič, J. V., Notholt, J., Rödenbeck, C., Ruhe, W., Warneke, T., and Weinzierl, C.: Automated ground-based remote sensing measurements of greenhouse gases at the Białystok site in comparison with collocated in situ measurements and model data, Atmos. Chem. Phys., 12, 30
6741–6755, doi:10.5194/acp-12-6741-2012, 2012.
Montzka, S. A., Dlugokencky, E. J., and Butler, J. H.: Non-CO2greenhouse gases and climate
AMTD
7, 1457–1493, 2014Retrieval of tropospheric column-averaged CH4mole fraction
Z. Wang et al.
Title Page
Abstract Introduction
Conclusions References
Tables Figures
◭ ◮
◭ ◮
Back Close
Full Screen / Esc
Printer-friendly Version
Interactive Discussion
Discussion
P
a
per
|
D
iscussion
P
a
per
|
Discussion
P
a
per
|
Discuss
ion
P
a
per
|
Michelson, H. A., Manney, G. L., Gunson, M. R., Rinsland, C. P., and Zander, R.: Correlations of stratospheric abundances of CH4and N2O derived from ATMOS measurements, Geophys.
Res. Lett., 25, 2777–2780, 1998.
Pałm, M., Melsheimer, C., Noël, S., Heise, S., Notholt, J., Burrows, J., and Schrems, O.: Inte-grated water vapor above Ny Ålesund, Spitsbergen: a multi-sensor intercomparison, Atmos. 5
Chem. Phys., 10, 1215–1226, doi:10.5194/acp-10-1215-2010, 2010.
Pison, I., Ringeval, B., Bousquet, P., Prigent, C., and Papa, F.: Stable atmospheric methane in the 2000s: key-role of emissions from natural wetlands, Atmos. Chem. Phys., 13, 11609– 11623, doi:10.5194/acp-13-11609-2013, 2013.
Plumb, R. A. and Ko, M. K. W.: Interrelationships between mixing ratios of long lived strato-10
spheric constituents, J. Geophys. Res.-Atmos., 97, 10145–10156, 1992.
Rigby, M., Prinn, R. G., Fraser, P. J., Simmonds, P. G., Langenfelds, R. L., Huang, J., Cun-nold, D. M., Steele, L. P., Krummel, P. B., Weiss, R. F., O’Doherty, S., Salameh, P. K., Wang, H. J., Harth, C. M., Muehle, J., and Porter, L. W.: Renewed growth of atmospheric methane, Geophys. Res. Lett., 35, L22805, doi:10.1029/2008GL036037, 2008.
15
Rodgers, C. D.: Inverse Methods for Atmospheric Sounding: Theory and Praxis, ISBN 981-02-2740-X, World Scientific Publishing Co., Singapore, 2000.
Sepúlveda, E., Schneider, M., Hase, F., García, O. E., Gomez-Pelaez, A., Dohe, S., Blumen-stock, T., and Guerra, J. C.: Long-term validation of tropospheric column-averaged CH4mole
fractions obtained by mid-infrared ground-based FTIR spectrometry, Atmos. Meas. Tech., 5, 20
1425–1441, doi:10.5194/amt-5-1425-2012, 2012.
Sussmann, R., Ostler, A., Forster, F., Rettinger, M., Deutscher, N. M., Griffith, D. W. T., Han-nigan, J. W., Jones, N., and Patra, P. K.: First intercalibration of column-averaged methane from the Total Carbon Column Observing Network and the Network for the Detection of At-mospheric Composition Change, Atmos. Meas. Tech., 6, 397–418, doi:10.5194/amt-6-397-25
2013, 2013.
Warneke, T., Meirink, J. F., Bergamaschi, P., Grooß, J.-U., Notholt, J., Toon, G. C., Ve-lazco, V., Goede, A. P. H., and Schrems, O.: Seasonal and latitudinal variation of atmospheric methane: a ground-based and ship-borne solar IR spectroscopic study, Geophys. Res. Lett., 33, L14812, doi:10.1029/2006GL025874, 2006.
30
AMTD
7, 1457–1493, 2014Retrieval of tropospheric column-averaged CH4mole fraction
Z. Wang et al.
Title Page
Abstract Introduction
Conclusions References
Tables Figures
◭ ◮
◭ ◮
Back Close
Full Screen / Esc
Printer-friendly Version
Interactive Discussion
Discussion
P
a
per
|
D
iscussion
P
a
per
|
Discussion
P
a
per
|
Discuss
ion
P
a
per
|
Wofsy, S. C., HIPPO Science Team, and Cooperating Modellers and Satellite Teams: HI-APER Pole-to-Pole Observations (HIPPO): fine-grained, global-scale measurements of climatically important atmospheric gases and aerosols, P. R. Soc. A, 369, 2073–2086, doi:10.1098/rsta.2010.0313, 2011.
Wunch, D., Toon, G. C., Wennberg, P. O., Wofsy, S. C., Stephens, B. B., Fischer, M. L., 5
Uchino, O., Abshire, J. B., Bernath, P., Biraud, S. C., Blavier, J.-F. L., Boone, C., Bow-man, K. P., Browell, E. V., Campos, T., Connor, B. J., Daube, B. C., Deutscher, N. M., Diao, M., Elkins, J. W., Gerbig, C., Gottlieb, E., Griffith, D. W. T., Hurst, D. F., Jiménez, R., Keppel-Aleks, G., Kort, E. A., Macatangay, R., Machida, T., Matsueda, H., Moore, F., Morino, I., Park, S., Robinson, J., Roehl, C. M., Sawa, Y., Sherlock, V., Sweeney, C., Tanaka, T., and 10
Zondlo, M. A.: Calibration of the Total Carbon Column Observing Network using aircraft pro-file data, Atmos. Meas. Tech., 3, 1351–1362, doi:10.5194/amt-3-1351-2010, 2010.
Wunch, D., Toon, G. C., Blavier, J.-F. L., Washenfelder, R. A., Notholt, J., Connor, B. J., Grif-fith, D. W. T., Sherlock, V., and Wennberg, P. O.: The total carbon column observing network, Philos. T. R. Soc. A, 369, 2087–2112, doi:10.1098/rsta.2010.0240, 2011.