Francisco Mateus Faria de Almeida Varasquim1, Manoel Cléber de Sampaio Alves2 , Marcos Tadeu Tiburcio Gonçalves3, Luis Fernando Frezzatti Santiago4, Alexandre Jorge Duarte de Souza3
(received: January 13, 2010; accepted: December 22, 2011)
ABSTRACT: The sanding process is important to the quality of wood products. Sanding reduces imperfections in wood surfaces and it is important to the final product and application of paints or varnishes. There are few studies about sanding in the literature and finding out the relationship between the input parameters (i.e., species of wood, grit size, abrasive) on the output parameters (i.e., roughness, force, pressure) will help to improve this process. This study analyzed the influence of input parameters as belt speed (cutting speed), grit size and pressure on the output parameters as surface roughness, cutting force (sanding force) and power consumption on cross-grain sanding of Eucalyptus grandis wood. The tests were performed with 3 types of grit sizes (80, 100 and 120 grit), 3 belt speeds (10, 11 and 12 m/s) and 2 pressures (219.89 and 283.44 g/cm²). The surface roughness was analyzed based on roughness average (Ra). Sanding efforts were analyzed by cutting force and power consumption. It was found that the 100 grit size provided the lowest cutting force. It was observed that the belt speed, pressure and grit size influenced the surface roughness, cutting force and power consumption. The best surface finishes were obtained in tests with higher pressure.
Key words: Roughness, cutting force, power consumption.
INFLUÊNCIA DA VELOCIDADE DE CORTE, GRANULOMETRIA DA LIXA E PRESSÃO NO LIXAMENTO DE Eucalyptus grandis
RESUMO: O processo de lixamento é de grande relevância para a qualidade final de produtos de madeira. É no lixamento que se deixa a superfície da madeira com menos imperfeições, sendo importante tanto para o produto final como para a aplicação de tintas ou vernizes. Atualmente, ainda há poucos estudos sobre as variáveis do lixamento. Por essa razão, a operação de lixamento acaba sendo realizada de forma empírica. Para melhorias no processo, deve-se conhecer as relações entre suas variáveis com a qualidade e esforços de corte. Com esse intuito, realizou-se a análise da influência da velocidade de corte (velocidade da lixa), da granulometria das lixas e da pressão no processo de lixamento do Eucalyptus grandis com corte perpendicular às fibras. Os ensaios foram realizados usando 3 granulometrias de lixa (80, 100 e 120), 3 velocidades de corte (10, 11 e 12 m/s) e 2 pressões (219,89 e 283,44 g/cm²). Verificou-se a qualidade superficial por meio da medição da rugosidade (Ra) e foram analisados os esforços de corte por meio da força de corte e da potência consumida. A lixa que proporcionou menor esforço de lixamento foi a de granulometria 100. Há uma influência da velocidade de corte, pressão e granulometria na qualidade superficial e nos esforços de lixamento. Os melhores acabamentos superficiais foram obtidos quando foram lixados com maiores pressões sobre a lixa.
Palavras-chave: Rugosidade, força de corte, potência consumida.
1Wood Industrial Engineer, M.Sc. Candidate in Science and Technology of Materials – Departamento de Engenharia Mecânica – Faculdade de
Ciências de Bauru – Universidade Estadual Paulista/UNESP – Av. Eng. Luiz Edmundo Carrijo Coube, s/nº, Vargem Limpa – Cx. P. 473 – 17033-360 – Bauru, SP, Brasil – [email protected]
2Mechanical Engineer, Professor D.Sc. in Science and Technology of Materials – Universidade Estadual Paulista/UNESP - Itapeva – Rua Geraldo
Alckmin, 519 – 18409-010 – Itapeva, SP, Brasil – [email protected]
3Mechanical Engineer, Professor D. Sc. in Mechanical Engineering – Universidade Estadual Paulista/UNESP - Itapeva – Rua Geraldo Alckmin, 519 –
18409-010 – Itapeva, SP, Brasil – [email protected], [email protected]
4Wood Industrial Engineer, M.Sc. Candidate in Materials (Lignocellulosic`s Materials) – Departamento de Engenharia Mecânica – Faculdade de
Engenharia de Guaratinguetá – Universidade Estadual Paulista/UNESP – Av. Dr. Ariberto Pereira da Cunha, 333 – Guaratinguetá, SP, Brasil – [email protected]
1 INTRODUCTION
The world today is facing the challenge of sustainability, leading to a considerable increase in the use of products from more easily renewable resources. In the search for renewability, the forest products industry has invested in the quality and production of reforested wood.
It´s extremely important to discover the workability features of this type of raw material. Since wood is a material whose properties vary from a species to another and according to several other factors, it is crucial to know how the material will behave during its machining and finishing (GONÇALVES, 2000).
Therefore, it is essential to know and align this process to the desired characteristics of the final product. According to Saloni (2007), different influencing variables must be considered when sanding wood, such as the wood moisture content, species, sanding direction, belt speed, wood density, grit size among others.
The surface roughness is the most important parameter after sanding especially to show the quality of wood surface. An adequate roughness will result in the desired final standards and an improvement of the surface to receive products such as sealants, paints and varnishes.
According to Saloni (2007), several variables should be controlled, such as sanding direction, belt speed and pressure, as well as the product moisture content and cleaning after the sanding operation. Precautions regarding these variables aim not only to improve the quality of sanding, but also to extend the service life of the sanding belt (RATNASINGAM et al., 1999).
After the sanding process, the resulting product is expected to present good surface quality to facilitate the subsequent processes. A good finish implies low roughness parameter values (AGOSTINHO et al., 1977).
The sanding process can be divided into two classes. The first class involves the processes that are carried out to prepare the wood and reduce its initial surface roughness. The second class involves the sanding processes that prepare the wood for the subsequent application of finishing materials (KOCH, 1964).
Due to the variation of the physical and chemical properties among wood species, it is necessary to know the adequate sanding parameters as pressure, belt speed, grit size, abrasive type. According to Bianchi et al. (1999), it is also very important to know the speed and forces that act in the process. For this author, the cutting forces in abrasive processes influence the geometric quality, surface finish, tool life and execution time of the sanding process. It is important to know the cutting forces to use equipments with adequate power and structures.
Saloni et al. (2005), using different pressures, wood species, abrasive types and belt speed, observed that the material removal rate can change with variation of pressure, abrasive type, grit size and belt speed and that power consumption increased linearly with increasing pressure. In most cases a higher belt speed produced a better surface finish.
According to Gonçalves (2000), the cutting performance of tools in wood machining processes can be indicated by the required energy consumption.
Javorek et al. (2006) found that pressure had a significant effect on power consumption and cutting force in sanding process. The authors noticed the influence of pressure, cutting direction and belt speed on the cutting force and power consumption. Porankiewicz et al. (2010) showed that the service life of the sandpaper depends on the pressure. The variations of particle size influence the service life of the sandpaper, as well.
According to Magoss and Sitkei (2001), the surface quality depends on several factors that can be found in the wood properties and in the machining process. The wood properties include the species, density, moisture content and the physicochemical properties. The physicochemical properties include the specific number and distribution of fibers and conduits, from the physical standpoint, and the content of cellulose, lignin and extractives, from the chemical standpoint.
According to Kilic et al. (2006), the surface quality from the machining process of wood is affected by the interaction between the workpiece characteristics, machine parameters and tool factors.
Varanda et al. (2010) studied the influence of belt speed and grit sizes on the surface quality of Eucalyptus grandis wood, and concluded that higher belt speeds consume more power to different sandpapers analyzed. These authors also concluded that smaller abrasive grains produced better surface finishes.
Ratnasingam et al. (2002) concluded from studies with Rubberwood (Hevea brasiliensis) sanding that the reduction of particle size contributes to enhance the quality of surface finish.
The type of processing also exerts a strong influence on roughness. In machining by orthogonal cutting, the most important factors are belt speed and knife sharpness, but the knife cutting angle, the angle between the cutting edge and the grain orientation (oblique angle) and the amplitude of vibration of the machine also affect the surface roughness (MAGOSS; SITKEI, 2001).
In machining by peripheral milling, the cutting speed and sharpness of the tool can determine the roughness of the workpieces. In sanding, roughness is influenced by the belt speed, feed speed, grit size and wear of the abrasive. In all these processes, roughness can be influenced by wood defects such as pores, incrustations, cracks and others (RATNASINGAM; SCHOLZ, 2004).
According to Gurau et al. (2005), sanded wood surface have different irregularities caused by machining and wood anatomy.
During the abrasive machining process, the abrasive grains wear and their tips begin to lose their cutting edges. The loss of sharpness causes cutting efforts increases leading to deformations on the material surface. With the increment of forces and deformations, there is higher attrition between the top of the abrasive grain and the material surface, generating higher temperatures in the process (ALVES, 2005).
The purpose of this study was to devise a new way to analyze results by means of a data acquisition system to study the relationships between belt speed, pressure, cutting force, power consumption, grit size and surface quality based on roughness measurements. Sanding process is influenced by these important variables that are rarely studied.
In this study, it was analyzed the influence of the belt speed, grit size and pressure applied in the plan sanding process perpendicular the grain of Eucalyptus grandis wood. The tests were performed with 3 grit sizes, 3 belt speeds and 2 pressures.
2 MATERIAL AND METHODS
A data acquisition center, shown in Figure 1, was used to read and record the relevant data in the sanding process. The data acquisition system comprises a swinging support base to ensure perpendicularity in the tests, an adapted load cell, and a flat sanding machine.
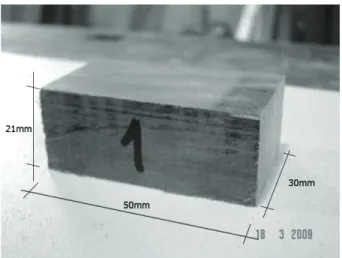
Sixty workpieces (Figure 2), with dimensions of 50 mm x 30mm x 21mm, were prepared from 3 bars with an initial length of 1400 mm and a rectangular 50 mm x 40mm section. These bars were first machined with a rough wood milling machine to ensure all their faces had the same dimensions. Then they were cut into segments using a circular saw with cutting guide, thus ensuring that all test specimens had the same size.
Figure 1 – Data acquisition center.
Figura 1 – Central de aquisição de dados.
Figure 2 – Workpiece.
Figura 2 – Corpo de prova.
Computer
Control panel
Sanding machine
For the purpose of capture all the signals, a bench was set up with a Siemens 110-220 VAC/24 VDC power supply, a TCA 500-2MV/V load cell transducer, and a Weg™ μline frequency converter with 380V input and 3A output to control the speed of the sanding machine motor. These components were connected by means of an 8-input/ output terminal.
During the sanding process, the motor power was measured with a WARD™ series 90501 TRX-I/U current transducer with about 0.5% of uncertainty. This transducer captures the variation of the motor current and releases a proportional signal between 0 and 5 VDC (Volts Direct Current).
Prior to the tests, the workpieces were acclimatized to ensure uniform moisture content. The tests were performed with moisture content stabilized at 8%. The testing procedure consisted of turning on the data acquisition program, then the frequency converter, then the motor, and waiting for the motor power curve to normalize; whereupon the workpieces were inserted and machined for one minute.
Three repetitions were made in each test condition to avoid any possible anomaly. The tests were performed with 3 grit sizes (80, 100 and 120 grit), 3 belt speeds (10, 11 and 12 m/s) and 2 pressures (219.89 and 283.44 g/cm²). All the sanding belts were composed of aluminum oxide grains.
The surface quality was evaluated using a Taylor Hobson Surtronic 25 surface roughness tester with a sampling length of 4 mm; 0.8mm cut-off and 2CR filter. It was evaluated the roughness average (Ra).
3 RESULTS AND DISCUSSION
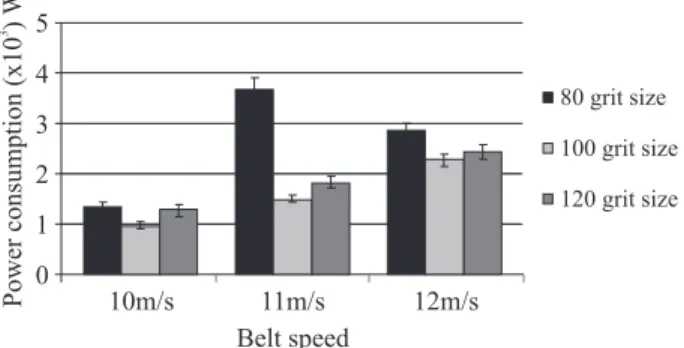
Figures 3 and 4 show the cutting force and power consumption, for sanding tests with 219.89 g/cm² pressure. As it can be seen, the lowest cutting force was obtained with the 100 grit size, and the 80 and 120 grit sizes showed small difference between them. The belt speed that provided smaller cutting forces was 10m/s. It requires higher variations of speed among tests for presenting better results in speed comparisons. An analysis of the graphs indicates that the lowest cutting force was obtained at the highest speed, while the highest cutting forces occurred at the lowest belt speed.
Through the analysis of variance and Tukey test, it was noted that the cutting force, using pressure of 219.89 g/cm2, presented: a) Significant difference between the belt speeds of 10 m/s and 12 m/s (F3.016 = 12.58, p <0.05) for
the three grit sizes used (80, 100 and 120), b) Significant difference between 80-100 and 80-120 grit sizes (F3.016 = 65.51, p <0.05) for the three belt speeds used (10, 11 and 12 m/s).
The power consumption, using pressure of 219.89 g/cm2, presented: a) Significant difference between all belt speeds (10, 11 and 12 m/s) for the three grit sizes (80, 100 and 120) (F3.016 = 680.88, p <0.05); b) Significant difference between the 80, 100 and 120 grit sizes for the three belt speeds used (F3.016 = 386.42, p <0.05), except for 80 and 120 grit sizes in the belt speed of 10m/s.
An analysis of the Figures 5 and 6 reveals the influence of higher pressure during the sanding process (283.44 g/cm2 pressure). It was noted that the tests with higher pressure (Figures 5 and 6) follow the same configuration as the tests without loads, i.e., the lowest sanding force is still that of grit size 100 and the cutting forces of the other two grit sizes seem almost similar. Power consumption also increased due to increase in belt speed.
The cutting force, using 283.44 g/cm2 pressure presented: a) Significant difference between the belt speeds of 10 m/s and 12 m/s (F3.016 = 16.03, p <0.05) for the 80 and 120 grit sizes; b) Significant difference between the 80-100 and 80-120 grit sizes (F3.016 = 34.23, p <0.05) for the three belt speeds used (10, 11 and 12 m/s). The power consumption, using 283.44 g/cm2 pressure presented: a) Significant difference between all belt speeds (10, 11 and 12 m/s) for the three grit sizes used (80, 100 and 120) (F3.016 = 705.48, p <0.05), b) Significant difference between the 80, 100 and 120 grit sizes for the three belt speeds used. (F3.016 = 303.49, p <0.05).
Figure 3 – Variation of cutting force as a function of the grit size with 219.89 g/cm2 pressure for the three different belt speeds tested.
Figura 3 – Variação da força de corte em função da
granulometria da lixa com pressão específica de 219,89 g/cm2 para as três .velocidades de corte testadas.
Figure 4 – Variation of power consumption as a function of the grit size with 219.89 g/cm2 pressure for the three different belt speeds tested.
Figura 4 –Variação da potência consumida no lixamento em
função da granulometria da lixa com pressão específica de 219,89 g/cm2 para as três velocidades de corte testadas.
0 1 2 3 4
10m/s 11m/s 12m/s
Belt speed
80 grit size
100 grit size
120 grit size
Power consumption
(x10 )
W
3 5
0 1 2 3 4
10m/s 11m/s 12m/s
Belt speed
80 grit size
100 grit size
120 grit size
Analyzing the Figures 3 and 5 it was noted that the cutting force increased with higher pressure in all the test configurations. A similar analysis of the Figures 4 and 6 reveals that the power consumption increased with higher pressure, except for 80 grit size in the belt speed of 11m/s. This behavior is due to the increased friction between the workpiece and the belt with higher pressure.
Figures 7 and 8 indicate the roughness values obtained in the tests. It could be noted that the highest roughness values among all the belt speeds were obtained with the 80 grit size without additional load, while the lowest roughness values were obtained at a belt speed of 10 and 12 m/s with 100 grit size without additional load. When sanding with additional load, the best results were obtained with the 100 grit size at a belt speed of 11 m/s, and with the 120 grit size at a belt speed of 12 m/s.
It could be also noted that with the 80 and 120 grit sizes, the tests with loading yielded the lowest roughness values, and hence, better surface quality. It can be stated that the best roughness values obtained with the 80 and 120 grit sizes were hence attained by increasing the pressure.
The lowest cutting speed used (10 m/s) produced the highest roughness at different pressures and grit sizes, with the exception only for the 100 grit size using 219,89 g/cm2 pressure.
The best roughness values obtained with the 100 grit size were attained at a belt speed of 10 m/s without additional loading, and at 11 and 12 m/s with additional loading.
The roughness (Ra), using 219.89 g/cm2 pressure, presented: a) Significant difference between 80 and 100 grit sizes to belt speeds of 10 and 12 m/s; b) Significant difference between 80 and 120 grit sizes for all belt speeds; c) Significant difference between 100 and 120 grit sizes to belt speeds of 10 and 12 m/s (F3.55 = 52.13; p <0.05).
Figure 5 – Variation of cutting force as a function of the grit size with 283.44 g/cm2 pressure for the three different belt speeds tested.
Figura 5 – Variação da força de corte em função da
granulometria da lixa com pressão específica de 283.44 g/cm2 para as três velocidades de corte testadas.
Figure 6 – Variation of power consumption as a function of the grit size with 283.44 g/cm2 pressure for the three different belt speeds tested.
Figura 6 – Variação da potência consumida no lixamento em
função da granulometria da lixa, com pressão específica de 283.44 g/cm2, para as três velocidades de corte testadas.
0 1 2 3 4
10m/s 11m/s 12m/s
Belt speed
80 grit size
100 grit size
120 grit size
Cutting force - Kgf
0 1 2 3 4
10m/s 11m/s 12m/s
Belt speed
80 grit size
100 grit size
120 grit size
Power consumption
(x10 )
W
3 5
Figure 7 – Roughness average (Ra) attained in tests with 219.89 g/cm2 pressure.
Figura 7 – Rugosidade média (Ra) dos ensaios usando pressão
de 219,89 g/cm2.
Figure 8 –Roughness average (Ra) attained in tests with 283.44 g/cm2 pressure.
Figura 8 – Rugosidade média (Ra) dos ensaios com pressão de
283,44 g/cm2. 0 2 4 6 8
10m/s 11m/s 12m/s Belt speed
80 grit size
100 grit size
120 grit size
Roughness average (Ra) (µm)
10
0 2 4 6 8
10m/s 11m/s 12m/s
Belt speed
80 grit size
100 grit size
120 grit size
Roughness average (Ra)
The roughness (Ra), using 283.44 g/cm2 pressure, presented significant difference only between 80-100 and 80-120 grit sizes for all belt speeds (F3.55 = 54.69; p <0.05). The variation of pressure influenced the cutting force for the various sandpaper belts tested using belt speed of 10 m/s (F3.87 = 96.69;p <0.05), belt speed of 11 m/s (F3.87 = 165.21; p <0.05), and belt speed of 12 m/s (F3.87 = 90.84; p <0.05). It also influenced the power consumption, for the different sandpaper belts tested using belt speed of 10 m/s (F3.87 = 180.26; p <0.05), belt speed of 11 m/s (F3.87 = 29.23; p <0.05), and belt speed of 12 m/s (F3.87 = 284.14; p <0.05).
The roughness (Ra) was influenced by pressure to conditions: a) Belt speed of 10 m/s for 80 and 120 grit sizes (F3.88 = 42.88; p <0.05); b) Belt speed of 11 m/s and 100 grit size (F3.88 = 20.93; p <0.05); c) Belt speed of 12 m/s for the 80 and 120 grit sizes (F3.88 = 43.48; p <= 0.05). In the sanding process, higher pressures increase the friction between the sandpaper belt and wood, because there will be a greater normal force, requiring higher cutting force and power consumption. Higher pressures increase the abrasive penetration producing a greater material removal rate, a higher resistance to remove the chip, requiring higher cutting forces and power consumption.
Greater power consumption were obtained for higher belt speed, because power (P) is a function involving force (F) and speed (V) (P = F x V).
More abrasive particles act on the surface when sandpaper belt is used with smaller abrasive particles. Consequently, efforts are distributed in a larger number of grains and the machining groove for each grain presents smaller depth, favoring a better finish. This effect was also observed by Tiburcio (2009). This author studied the cylindrical sanding of samples from Eucalyptus grandis wood and it was noted that best finishes were achieved with sandpaper belts with smaller grit size.
The best finish achieved with 100 grit size, compared with 120 grit size, could be explained in terms of wood anatomy and density. The finish produced by 120 grit size did not decrease the effects of anatomical elements.
The increased pressure contributed, in most cases, for a better finish. This is probably the best action of abrasives that, with higher pressure, reduce the effect of wood anatomical elements.
4 CONCLUSIONS
The data acquisition system was efficient in capturing power consumption and cutting force data,
proving to be completely reliable to capture physical process variables. The methodology employed here can be used in industrial environments, for the process and quality control of manufactured parts.
Higher pressure was found to favor the surface finish, improving the finish and reducing the roughness values.
There was a visible difference in the quality of the surface finish provided by the 80 grit size and the other grits. However, the 100 and 120 grit sizes yielded similar surface finishes.
The variation in belt speed did not affect the roughness of the workpiece to any noticeable degree. This was probably due to the low variation in belt speed applied in the tests (10, 11 and 12 m/s). The sanding force increased slightly at lower belt speeds.
Regarding to the cutting force, it can be stated only that the 100 grit size yielded the lowest cutting force and that the other grits produced forces similar to each other.
Also concerning the cutting force, an increase in pressure led to an increase in forces. The grit size that showed the highest increase in sanding force was the 120 grit size.
5 ACKNOWLEDGMENTS
Special acknowledgements are due to FAPESP – Fundação de Amparo à Pesquisa do Estado de São Paulo-Brazil, for its financial support of this research.
6 REFERENCES
AGOSTINHO, O. L.; RODRIGUES, A. C. S.; LIRANI, J. Princípios de engenharia de fabricação mecânica: tolerâncias, ajustes, desvios e análise de dimensões. São Paulo: E. Blücher, 1977. 312 p.
ALVES, M. C. S. Análise da influência da velocidade de
mergulho na retificação de aços endurecidos utilizando
refrigeração otimizada. 2005. Dissertação (Mestrado) –
Universidade Estadual Paulista, Bauru, 2005.
BIANCHI, C. E.; SILVA, E. J.; LOVATO, M. C.;
FERNANDES, O. C.; VALARELLI, I. D. Características e tendências do processo de abrasão. Revista Máquinas & Metais, São Paulo, ano 35, n. 399, p. 238-249, 1999.
GURAU, L.; MANSFIELD-WILLIANS, H.; IRLE, M. Filtering the roughness of a sanded wood surface. Holz als Roh und Werkstoff, Berlin, v. 64, n. 5, p. 363-371, 2006.
JAVOREK, L.; HRIC, J.; VACEK, V. The study of chosen parameters during sanding of spruce and beech wood. Pro Ligno, Brasov, v. 2, n. 4, p. 1-11, 2006.
KILIC, M.; HIZIROGLU, S.; BURDURLU, E. Effect of machining on surface roughness of wood. Building and
Environment, Oxford, v. 41, n. 8, p. 1074-1078, 2006.
KOCH, P. Wood machining processes. New York: Ronald, 1964. 530 p.
MAGOSS, E.; SITKEI, G. Fundamental relationship of wood saurface roughness at milling operations. In: INTERNATIONAL WOOD MACHINING SEMINAR, 15., 2001, Anaheim. Proceedings… Anaheim: Wood Machining Institute, 2001. p. 437-446.
PORANKIEWICZ, B.; BANSKI, A.; WIELOCH, G. Specific resistance and specific intensity of belt sanding of wood. BioResources, Oxford, v. 5, n. 3, p. 1626-1660, 2010.
RATNASINGAM, J.; REID, H. F.; PERKINS, M. C. The abrasive sanding of Rubberwood (Hevea brasiliensis): an industrial perspective. Holz als Roh und Werkstoff, Berlin, v. 60, n. 3, p. 191-196, 2002.
RATNASINGAM, J.; REID, H. F.; PERKINS, M. C. The productivity imperatives in coated abrasives: application in furniture manufacturing. Holz als Roh und Werkstoff, Berlin, v. 57, n. 2, p. 117-120, 1999.
RATNASINGAM, J.; SCHOLZ, F. Wood sanding process: an optimization perspective. Kuala Lumpur: University Putra Malaysia, 2004. 115 p.
SALONI, D. E. Process monitoring and control system
design, evaluation and implementation of abrasive
machining processes. 2007. 197 p. Thesis (Ph.D.) - North Carolina State University, Raleigh, 2007.
SALONI, D. E.; LEMASTER, R. L.; JACKSON, S. D. Abrasive machining process characterization on material removal rate, final surface texture, and power consumption for wood. Forest Products Journal, Madison, v. 55, n. 12, p. 35-52, 2005.
TIBURCIO, U. F. O. Medição e análise do acabamento
superficial da madeira de eucalipto na usinagem de
torneamento cilíndrico e lixamento. 2009. 101 p. Tese (Doutorado em Engenharia Mecânica) - Universidade Estadual Paulista, Guaratinguetá, 2009.