Therapeutic Implications from Sensitivity
Analysis of Tumor Angiogenesis Models
Jan Poleszczuk1,2*¤, Philip Hahnfeldt1, Heiko Enderling1¤
1Center of Cancer Systems Biology, GeneSys Research Institute, Tufts University School of Medicine, Boston, Massachusetts, United States of America,2College of Inter-faculty Individual Studies in Mathematics and Natural Sciences, University of Warsaw, Warsaw, Poland
¤ Current address: Department of Integrated Mathematical Oncology, H. Lee Moffitt Cancer Center & Research Institute, Tampa, Florida, United States of America
Abstract
Anti-angiogenic cancer treatments induce tumor starvation and regression by targeting the tumor vasculature that delivers oxygen and nutrients. Mathematical models prove valuable tools to study the proof-of-concept, efficacy and underlying mechanisms of such treatment approaches. The effects of parameter value uncertainties for two models of tumor develop-ment under angiogenic signaling and anti-angiogenic treatdevelop-ment are studied. Data fitting is performed to compare predictions of both models and to obtain nominal parameter values for sensitivity analysis. Sensitivity analysis reveals that the success of different cancer treat-ments depends on tumor size and tumor intrinsic parameters. In particular, we show that tu-mors with ample vascular support can be successfully targeted with conventional cytotoxic treatments. On the other hand, tumors with curtailed vascular support are not limited by their growth rate and therefore interruption of neovascularization emerges as the most promising treatment target.
Introduction
Recruitment of blood vessels through a process called angiogenesis [1] is a hallmark of
malig-nant tumor progression [2–3]. Conventional radiotherapy or chemotherapy are designed to
in-duce gross cell kill in rapidly proliferating populations of cancer cells, with treatment side effects being expected in non-malignant active tissues. Although capable of shrinking the
tumor many orders of magnitude, complete tumor eradication is often unachievable [4].
Anti-angiogenic treatment is designed to inhibit the tumor vascular support and thus increasing ox-ygen tension and inducing tumor cell starvation. This can be achieved either by targeting the neo-vasculature directly or by interfering with pro-angiogenic factors secreted by the tumor
[5]. Anti-angiogenic treatment holds the promise of being less patient-specific as the host
vas-culature is targeted and not the constantly evolving tumor population [6]. Numerous
mathe-matical models have been developed to describe tumor growth, angiogenesis, and response to various treatments approaches at different stages. We set out to study the sensitivity of a tumor to different anti-angiogenic drug treatments at different stages of growth. We compare two
OPEN ACCESS
Citation:Poleszczuk J, Hahnfeldt P, Enderling H (2015) Therapeutic Implications from Sensitivity Analysis of Tumor Angiogenesis Models. PLoS ONE 10(3): e0120007. doi:10.1371/journal.pone.0120007
Academic Editor:Domenico Ribatti, University of Bari Medical School, ITALY
Received:October 23, 2014
Accepted:January 19, 2015
Published:March 18, 2015
Copyright:© 2015 Poleszczuk et al. This is an open access article distributed under the terms of the
Creative Commons Attribution License, which permits unrestricted use, distribution, and reproduction in any medium, provided the original author and source are credited.
Data Availability Statement:All relevant data are within the paper.
Funding:This project was supported by the Foundation for Polish Science (JP) and the National Cancer Institute under Award Number U54CA149233 (to Lynn Hlatky). The content is solely the
different anti-angiogenic agents by local and global sensitivity analysis of parameters describ-ing tumor-vasculature interactions. We utilize an established and a modified mathematical model. The local sensitivity analysis investigates the effect of small variation in a single parame-ter about its nominal/average value when all other parameparame-ters are kept fixed at the estimated values. However, biological systems contain typically substantial variations in almost all pa-rameters values; between patients and even within tumors of a single patient. Hence, it might
happen that the model parameter‘a’is locally the most influential for one patient, while for
an-other patient (with an-other set of nominal parameters values) it is parameter‘b’. In contrast, a
global sensitivity analysis reveals which parameters are the most influential in general by per-turbing all parameters simultaneously, assuming patient population heterogeneity and thus pa-rameter values uncertainty.
Materials and Methods
Hahnfeldt and colleagues proposed a mathematical model of the concept that tumor growth
and host blood vessel support is bidirectionally modulated [7]. Tumor volume (V) and effective
vascular support (K) that defines the tumor carrying capacity are time-dependent variables
de-scribed by a set of coupled ordinary differential equations (ODEs). Tumor growth is assumed to be governed by the Gompertz law:
V0 ¼
eVlog V
K
: ðC1Þ
With constant effective vascular supportK = Kmax, initial rapid tumor growth is followed by a
slowdown as the tumor volume approaches carrying capacityKmax. To account for reciprocal
interaction of the tumor with the host vasculature, carrying capacity through vascular support
can be described by a variableKmodulated by the tumorV:
K0¼
mK
zffl}|ffl{ spontaneous loss
of functional vasculature
þ bV
|{z}
vessels growth
stimulation by the tumor |fflfflfflfflfflfflfflfflfflfflfflfflfflfflfflfflfflfflfflfflfflfflfflfflfflffl{zfflfflfflfflfflfflfflfflfflfflfflfflfflfflfflfflfflfflfflfflfflfflfflfflfflffl}
dKV2=3
zfflfflffl}|fflfflffl{endogenous inhibition
of vasculature ; ðC2Þ
where -μKrepresents spontaneous loss of functional vasculature,bVrepresents vessels growth
stimulation due to factors secreted by the tumor proportionally to its size, and -dKV2/3
de-scribes endogenous inhibition of previously generated vasculature due to factors secreted by
the tumor proportionally to the tumor surface-to-volume ratio. The specific 2/3 power ofVin
the above equation was derived on the basis of the partial differential equation describing the
concentration of angiogenic stimulator/inhibitors, see [7] for further details. Model system
Equations (C1) and (C2) describe control tumor growth without treatment. In the literature
one canfind models with different forms of the stimulation and inhibition terms in Equation
(C2) [8–9], but in each case the quantitative behavior of the model remains similar.
The model proposed by Hahnfeldt and colleagues can simulate the effect of anti-angiogenic treatment, and model predictions were successfully compared with experimental data of
treat-ment with TNP-470, Angiostatin and Endostatin [7]. The equation describing the evolution of
vascular carrying capacity has originally been developed to include treatment effects:
K0¼ mKþbV dKV2=3 eKgðtÞ
zfflfflffl}|fflfflffl{
anti angiogenic treatment; ðO1Þ
whereg(t)is the time dependent concentration of an administered inhibitor. Under the usual
pharmacokinetic assumptions [10],g(t)is expressed as
gðtÞ ¼
Zt
0
cðsÞexpð clrðt sÞÞds; ðC3Þ
wherec(s)is the administration rate at timesandclris the clearance rate of the considered
in-hibitor. Let us denote model system (C1) and (O1) as‘the original model’describing the
re-sponse of a tumor to anti-angiogenic treatment. The above model, together with its
modifications, has been an object of intensive studies from the point of view of optimal
anti-an-giogenic treatment scheduling [11–12].
Poleszczuk and coworkers [13] argued that the original model, although successful in
pre-dicting the response to therapeutic agents that block the growth of new blood vessels (for ex-ample, Angiostatin), might insufficiently describe the effect of anti-angiogenic drugs that act to inhibit angiogenic stimulation. Bevacizumab, a humanized monoclonal antibody that inhibits vascular endothelial growth factor A (VEGF-A), was provided as an example of such agent
[13]. For anti-angiogenic agents like Bevacizumab the following modification of the original
equation was proposed:
K0 ¼ mKþ b
1þegðtÞanti angiogenic treatment
|fflfflfflfflfflfflfflfflfflfflfflfflfflfflfflfflfflfflfflfflfflfflfflfflfflfflfflffl{zfflfflfflfflfflfflfflfflfflfflfflfflfflfflfflfflfflfflfflfflfflfflfflfflfflfflfflffl}
V dKV2=3; ðM1Þ
where, as above,g(t)represents the concentration of the administered agent; see [13] for
deri-vation details. Note that in comparison to the original model, treatment does not induce gross
reduction of vasculature (c.f., Equation (O1)) but selectively inhibits formation of
tumor-stim-ulated neovasculature. Let us denote model system (C1) and (M1) as‘the modified model’
de-scribing the response of a tumor to anti-angiogenic treatment.
Data Fitting
Data fitting of control, original and modified models was performed to experimental data
ob-tained by Fujita and colleagues [14]. The values estimated in the original model [7] were taken
as the initial set of parameters for tumor growth without treatment, i.e., the control case. The maximal perturbation value for each parameter was assumed to be equal to 80% of its initial
value. For spontaneous death rateμ, which was neglected in the original model analysis, we
as-sumed the range of admissible values between 0 and 1 (representing 0%-100%). For treatment
associated parametersD,clrande, we only considered positive values. Data fitting was divided
into control case fitting and subsequent treatment model fitting. In both cases, trust region
method (incorporated in MATLABlsqnonlinfunction) for finding the minimal fit error values
was utilized. The trust-region-reflective algorithm uses a quadratic approximation for the min-imized function (defined by the first two terms of its Taylor approximation) in a neighborhood
(trust region) around the current point x to improve the current approximation error [15]. In
order to avoid finding only local minima we generated 1000 random initial parameter values for the optimization procedure.
Sensitivity analysis
We focused on the sensitivity of tumor volumeVand ignored the sensitivity of effective
vascu-lar supportK(asVis directly dependent onK). Local sensitivities were obtained by solving the
uniformly distributed random variable within the range of ±10% or ± 20% of the initial
param-eter value. Spearman’s partial rank correlation coefficients were calculated from 1,000 samples
generated with a Latin Hypercube Sampling (LHS) algorithm [16]. The scatter plots of
ob-tained samples revealed only monotonic relations between tumor volume and parameters. The sensitivity indices, defined as fraction of total output variance generated by the uncertainty in the respective parameter value, were calculated using the Fourier Amplitude Sensitivity Test
(FAST) method [17].
Results
Bevacizumab treatment data
The impact of Bevacizumab on head and neck squamous cell tumors grown in Female BALB/c
nu/nu nude mice was investigated experimentally [14]. Tumor-bearing mice were randomized
at mean tumor volume 50–100 mm3. Mice were treated with Bevacizumab either 2 mg/kg/day
or 4 mg/kg/day on days 1 and 4 of each week for 4 weeks. Both treatment regimes were shown
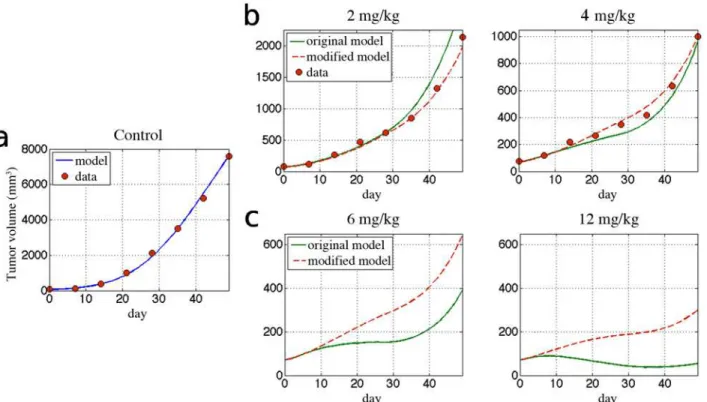
to decelerate growth but are insufficient to prevent tumor expansion (Fig. 1b).
Although Bevacizumab was not injected as bolus, for simplicity we assume thatc(s) = D(δ(s—
t1)+δ(s—t2)+. . .), whereDis the administered dose andtiare the injection days. This
assump-tion may generally lead to decrease in fit quality but should not influence the comparison be-tween considered models. Comparison of the experimental data with fitted curves demonstrates
the ability of both models to reproduce the experimental data (Fig. 1a). An excellent control fit
was obtained when solving the model (Equations (C1) and (C2)) for parametersε,μ,bandd
(Fig. 1a). In contrast to previous assumptions that spontaneous vasculature lossμis negligible [7]
we obtained the best fitting curve forμ>0, specificallyμ=0.0021 (cf.Table 1). This value,
howev-er, is relatively small and therefore its role in the model will be addressed in the next sections. A good fit for early response to low doses of Bevacizumab of 2 and 4 mg/kg/day was obtained by both the original and modified model without significant differences in tumor growth curves (Fig. 1b). At the end of the treatment (t>30 days), however, the original model fails to correctly approximate tumor growth for the 2 mg/kg/day treatment. For both doses of Bevacizumab the total fit error for the modified model was about two times smaller than for the original model
(1.78 for 2 mg/kg/day and 1.75 for 4 mg/kg/day of Bevacizumab), seeTable 1for specific values
of fit error. Large differences in treatment predictions by both models are observed for higher
doses of bevacizumab (Fig. 1c). For treatment doses of 12 mg/kg/day, the original model predicts
a more than three times larger tumor response to treatment than the modified model. Due to lack of data for such a high doses of Bevacizumab, however, we are unable to score the model predictions.
Treatment free model: sensitivity analysis
Parameter values obtained in the previous section describe average tumor growth. Each param-eter, however, has an intrinsic burden of uncertainty, which is reflected in patient-specific clini-cal disease courses of tumors of the same organ. In order to obtain the compact form of the considered models, however, many aspects of the tumor angiogenesis process have been incor-porated into single parameters, which introduces additional variation in their values.
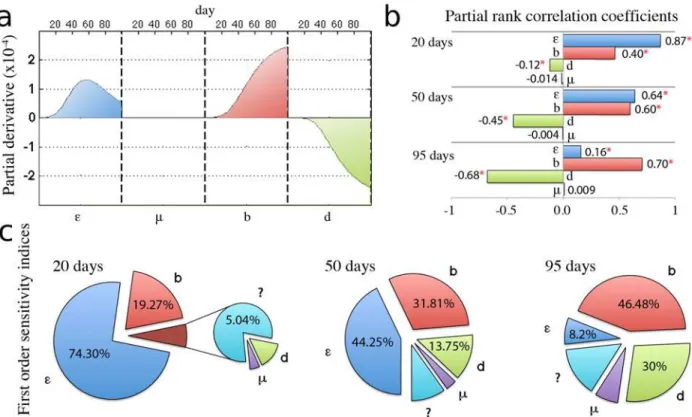
Sensitivi-ty analysis for the treatment-free model described by Equations. (C1) and (C2) demonstrates
the influence of the uncertainty in the parameters values (Fig. 2). A basic approach to
measur-ing sensitivity at a fixed time point is to calculate the partial derivatives of systems solution
with respect to the parameters [18]. That‘local’sensitivity analysis provides direct information
on the effect of small variation in a single parameter about its nominal value. Our analysis
has no significant influence on the tumor size (Fig. 2) and can therefore be neglected in the
model as predicted by Hahnfeldt and colleagues [7]. Sensitivity analysis further shows that for
early tumor growth up, i.e.t<50 days, there is no significant difference in‘local’sensitivity to
each parameter (Fig. 2a). In other words, small variation in each single model parameter has
similar impact on early tumor growth dynamics. Aftert= 50 days, however, when the tumor
Fig 1. Fitted model curves and predicted tumor response to different doses of bevacizumab.Control data derived from [14] and parameters inTable 1. (a)Control data and the fitted model curve using Equations.C1,C2.(b)Treatment data together with the solutions to original (Equations.C1,O1) and modified (Equations.C1,M1) models.(c)Response of tumor for higher doses of bevacizumab: 6 mg/kg and 12 mg/kg
doi:10.1371/journal.pone.0120007.g001
Table 1. Estimated tumor growth parameters.
Description Control Original model Modified model
e drug impact 0.0636 0.4755
clr clearance rate 0.0745 0.0799
ε growth rate 0.0741 0.0741 0.0741
μ loss of vessels 0.0021 0.0021 0.0021
b stimulation 1.3383 1.3383 1.3383
d inhibition 0.002 0.002 0.002
V0 initial V 71.2553 71.2553 71.2553
K0 initial K 71.6675 71.6675 71.6675
Fit error average % per point 6.57 2 mg/kg/day: 12.66; 4 mg/kg/day: 10.97 2 mg/kg/day: 7.1; 4 mg/kg/day: 6.26
The kinetic model (Equations. (C1) and (C2)) was appliedfirst to the untreated control tumor data, and the growth parametersε,μ,b,d, and K0(initial
value of K) were solved for by performing gradient-based optimization for 1,000 randomly chosen set of initial parameters. Using obtained parameters the data for Bevacizumab (2 or 4 mg/kg) was used to solve for the respective treatment parameterseandclrin case of the original model (Equations. (C1) and (O1)) and the modified model (Equations. (C1) and (M1)).
has reached an appreciable size, sensitivity to growth rateεbegins to decrease while sensitivity
to other model parameters continues to increases at similar rates as before. Therefore, tumor growth for larger tumors is not determined by its intrinsic growth rate but increasingly depen-dent on parameters associated with the angiogenesis process.
Although the performed local analysis provides direct information on the effect of small pa-rameter perturbations about their nominal values, it does not indicate the effect of concurrent, large perturbations in all model parameters. In cancer progression and treatment, many pa-rameters are unknown or only estimated, and may be uncertain by one or more orders of
mag-nitude [18]. In order to reflect this uncertainty, we assume that the value of each parameter is
uniformly distributed around the nominal value obtained through data fitting in previous sec-tion. We set the range of that distribution to ± 10% of the nominal value. Such amount of un-certainty in each parameter yields up to 30% differences in the tumor volume 100 days after
initiation.Fig. 2b and cshow the partial rank correlation coefficients and variance
decomposi-tion indicative of most influential parameters perturbadecomposi-tions. At large tumor sizes local and global sensitivity analysis concur that tumor progression is most sensitive to
angiogenesis-associated parameters. Global sensitivity analysis, however, reveals that tumor growth rateεis
the major determinant of tumor progression when the tumor is small (Fig. 2c). At the
begin-ning of tumor growth almost 75% percent of variation in tumor volume are due to uncertainty in the tumor growth rate. Similar size dependence is confirmed in the values of partial rank
Fig 2. Local and global sensitivity analysis for the control case.Analysis carried with the nominal parameters values presented inTable 1. (a) Time evolution of the local sensitivities, defined as the partial derivatives of the tumor growth curve taken with respect to each parameter and multiplied by the nominal parameter value. (b) Partial rank correlation coefficients between each parameter and the tumor volume after 20, 50 or 95 days from initiation. Coefficients were calculated from 1,000 randomly generated samples under the assumption that each parameter is uniformly varied by no more than 10% of its initial value (*denotes p-value below 0.01). (c) First order sensitivity indices, defined as the fraction of the total variance in tumor volume caused by the variation in each parameter value. Calculations were performed after 20, 50 and 95 days from tumor initiation using the FAST method and under the assumption that parameters are varied uniformly by no more than 10%.
correlation coefficients (Fig. 2b). The initial high correlation of tumor volume with the value of the tumor growth rate decreases in favor of angiogenesis-associated parameters. From the
glob-al sensitivity anglob-alysis we derive the following therapeutic implications: (i) at small tumor sizes
it is better to perturb the tumor growth rate by targeting cancer cells directly, and (ii)
manipu-lation of the vascular supply by increasing inhibition or decreasing stimumanipu-lation is the most promising approach when tumors have grown to a substantial size.
Target angiogenic stimulators or endothelial cells?
As alluded to above, anti-angiogenic drugs can have different courses of action. One class of drugs interferes with the balance of angiogenesis promoters and inhibitors in favor of inhibi-tion, whereas the other class prevents blood vessel formation regardless of stimulatory signals. We set out to answer the question which anti-angiogenic mechanism is less patient specific and promises more robust treatment results. The original model is used in case of Angiostatin,
TNP-470 and Endostatin and the modified model for Bevacizumab.Table 2shows the
phar-macokinetic parameters for Bevacizumab as estimated above (cf.Table 1), as well as TNP-470,
Angiostatin and Endostatin as estimated by Hahnfeldt and colleagues through fitting to
experi-mental data [7]. We assume the same treatment protocol as in the previous section with drugs
being administered on days 1 and 4 of each week for 4 weeks. Doses for TNP-470, Angiostatin and Endostatin are chosen to give response curves comparable to treatment with Bevacizumab at 4 and 8 mg/kg/day. For sensitivity analysis of the treatment model we only present data for Angiostatin as similar results were obtained for both TNP-470 and Endostatin (data not shown). In order to investigate the robustness of the treatment outcome we revisit the intrinsic
uncertainty for parametersε,μ,b,d,e. We assume that the variation is uniformly distributed
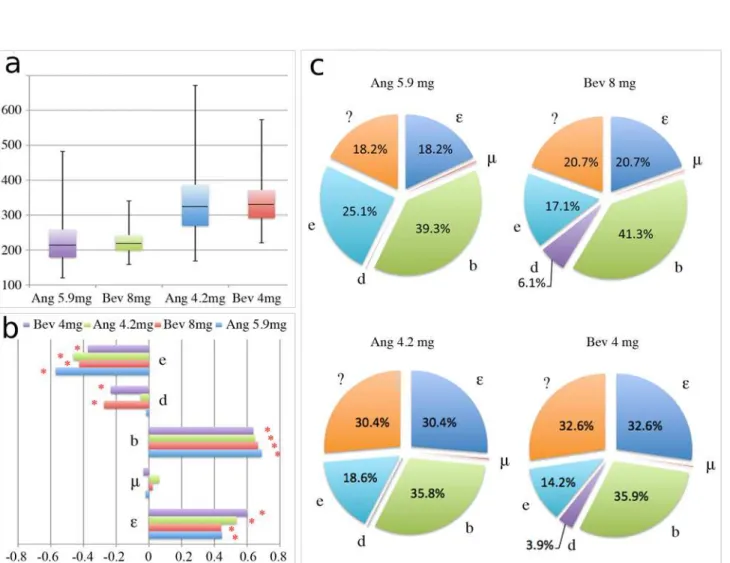
around the nominal value of the parameter and its maximal value is limited to 20%.Fig. 3
shows the global sensitivity analysis revealing the influence of parameter uncertainty on tumor volume 26 days after initiation. For both drug dose regimes a larger variation in tumor volume is observed for Angiostatin than for Bevacizumab. With comparable average tumor volumes at the end of treatment, Bevacizumab yields 34% and 49% lower standard deviation from average tumor size than Angiostatin for both lower and higher drug doses, respectively. The minimal tumor volumes for both drug regimes however, are in favor of Angiostatin, with almost 25% less tumor volume than the smallest tumors obtained with Bevacizumab. On the other hand, the worst possible outcomes (maximal tumor volume) with Bevacizumab were almost 30% smaller than those in the Angiostatin group. The decomposition of the variance revealed no significant differences between both drugs, providing the similar amount of unexplained origin
of variation (higher order interactions) (compareFig. 3c). Differences are only observable in
the dependence of tumor volume on uncertainty in parameterddescribing endogenous
vascu-lature inhibition. Estimated partial rank correlation coefficients show higher correlation ofd
with treatment outcome for Bevacizumab, suggesting that tumors with larger endogenous inhi-bition of tumor angiogenesis may respond better to Bevacizumab.
Discussion
Mathematical models can be utilized to dissect complex mechanisms underlying tumor growth and response to treatment, especially if treatment is not directed at tumor cells but at the envi-ronment that modulates tumor growth kinetics. We set out to investigate the sensitivity of pa-rameters in a well-studied mathematical model of tumor growth with reciprocal dependence
on its vascular support, and its response to anti-angiogenic treatment [7,13]. In line with
Table 2. Dosage of different agents giving similar therapeutic effects.
e (drug impact) clr (clearance rate) D (dose)
TNP-470 1.3 10.1 13.2; 20.2
Endostatin 0.66 1.7 4.1; 5.8
Angiostatin 0.15 0.38 4.2; 5.9
Bevacizumab 0.4755 0.0799 4; 8
Shown are the exact values of pharmacokinetic parameters (e, clr) and doses (D) for which the original model (TNP-470, Endostatin, Angiostatin) and the modified one (Bevacizumab) give the same tumor volume at the end of treatment. Values of pharmacokinetic parameters, except for bevacizumab, were estimated in [7].
doi:10.1371/journal.pone.0120007.t002
Fig 3. Global sensitivity analysis for Bevacizumab and Angiostatin.Analysis carried for two different dose regimes and with the nominal parameters values presented inTable 1andTable 2. (a) Box plot of tumor volume after 26 days from the initiation calculated from 1,000 samples generated under the assumption that parametersε,μ,b,d,eare varied uniformly up to 20%. (b) Partial rank correlation coefficients between each parameter and the tumor volume after 26 days from initiation (*denotes p-value below 0.01). (c) First order sensitivity indices, defined as the fraction of the total variance in tumor volume caused by the variation in each parameter value. Calculations were performed after 26 days from tumor initiation using the FAST method.
growth dynamics. Local and global sensitivity analysis further revealed that tumor growth is separated into distinct phases with different dependence on underlying mechanisms. Intuitive-ly, when a tumor is initiated its progression is predominantly determined by the intrinsic growth rate, that is, ratio of cell proliferation to cell death. As the tumor grows and exhausts its vascular support the growth rate becomes insignificant and tumor progression is increasingly dependent on the interplay of angiogenesis promoting and inhibiting mechanisms. These find-ings offer valuable insights into tumor size-dependent treatment design. Small tumors as well as tumors progressing with ample vascular support might be best targeted by direct induction of cell kill. Tumors with curtailed vascular support are not dependent on their growth rate, and induction of cell kill will only have minimal effects. We showed that for such tumors interfer-ence with the neovascularization is the most promising treatment target. These model predic-tions will need to be confirmed in carefully designed animal experiments that allow for quantification of the degree of tumor vascularization and vascularization-dependent response to cytotoxic and anti-angiogenic treatments as well as their combinations.
A number of anti-angiogenic treatments have recently been approved for both single treat-ment and in combination with other therapeutic agents and many more are in various stages of clinical trials. The Hahnfeldt model has successfully predicted tumor response to
anti-angiogenic treatment with TNP-470, Angiostatin and Endostatin [7]. A modification of that
model put forward by Poleszczuk and colleagues extended its applicability to treatment with
Bevacizumab [13]. We normalized treatment protocols in both models to achieve comparable
tumor sizes after treatment and analyzed the sensitivity of both models to the underlying pa-rameters. With equal perturbation of parameters in both models representative of patient vari-ability we showed that the average tumor sizes after treatment with both Angiostatin and Bevacizumab are similar. The deviation from average response, however, was significantly larg-er for Angiostatin, indicating that the course of action with Bevacizumab is less patient specific and thus wider applicable. The most favorable outcome, however, was observed for treatment with Angiostatin, with final tumor size being more than 30% smaller than the best sample from the Bevacizumab group. On the other hand, the least successful treatment outcome featured also a significantly larger tumor in the Angiostatin group compared to Bevacizumab. No signif-icant differences in parameter sensitivity were found between both drugs, providing similar amount of unexplained origin of variation in tumor response. These results visualize that higher order interactions between tumor, vasculature and anti-angiogenic agents are at play that are yet to be fully deciphered.
In conclusion, we have demonstrated that simple mathematical models with a small number of experimentally validated parameters can reliably reproduce and predict tumor growth and treatment response data. Thorough analysis of parameter uncertainty yields invaluable insights into mechanisms driving growth kinetics and response of tumors. Our study encourages the measure of tumor vasculature as a surrogate for tumor carrying capacity as a biomarker, which may ultimately lead to better-informed patient-specific synergizing of cytotoxic and anti-an-giogenic treatment. These findings from our analysis augment the understanding of cause-ac-tion relacause-ac-tion of tumor kinetics and aim to drive future experiments and clinical validacause-ac-tion towards improved understanding and ultimately patient prognosis.
Author Contributions
References
1. Folkman J. Tumor angiogenesis: therapeutic implications. N Engl J Med. 1971; 18: 1182–1184. 2. Hanahan D, Weinberg RA. The hallmarks of cancer. Cell. 2000; 100: 57–70. PMID:10647931
3. Hanahan D, Weinberg RA. Hallmarks of cancer: the next generation. Cell. 2011; 144: 646–674. doi:10. 1016/j.cell.2011.02.013PMID:21376230
4. Loeb LA. A mutator phenotype in cancer. Cancer Res. 2001; 61: 3230–3239. PMID:11309271
5. Leach MO, Brindle KM, Evelhoch JL, Griffiths JR, Horsman MR, Jackson A, et al. The assessment of antiangiogenic and antivascular therapies in early-stage clinical trials using magnetic resonance imag-ing: issues and recommendations. Br J Cancer. 2005; 9: 1599–1610. PMID:15870830
6. Cooke R. Dr. Folkman's War: Angiogenesis and the Struggle to Defeat Cancer. New York: Random House; 2001.
7. Hahnfeldt P, Panigrahy D, Folkman J, Hlatky L. Tumor development under angiogenic signaling: a dy-namical theory of tumor growth, treatment response, and postvascular dormancy. Cancer Res. 1999; 59: 4770–4775. PMID:10519381
8. Ergun A, Camphausen K, Wein LM. Optimal scheduling of radiotherapy and angiogenic inhibitors. Bull Math Biol. 2003; 65: 407–424. PMID:12749532
9. D’Onofrio A, Gandolfi A. Tumor eradication by antiangiogenic therapy: analysis and extensions of the model by Hahnfeldt et al. (1999). Math Biosci. 2004; 191: 159–184. PMID:15363652
10. Bonate PL. Pharmacokinetic-Pharmacodynamic Modeling and Simulation. 2nd ed. New York: Spring-er; 2011.
11. Ledzewicz U, Schättler H. Optimal and suboptimal protocols for a class of mathematical models of tumor anti-angiogenesis. J Theor Biol. 2008; 252: 295–312. doi:10.1016/j.jtbi.2008.02.014PMID:
18371982
12. Klamka J,Świerniak A. Controllability of a model combined anticancer therapy. Control and Cybernetics. 2013; 42: 125–138. doi:10.1109/TSMCB.2011.2162234PMID:21878418
13. Poleszczuk J, Bodnar M, ForyśU. New approach to modelling of antiangiogenic treatment on the basis of Hahnfeldt et al. model. Math Biosci Eng. 2011; 8: 591–603. doi:10.3934/mbe.2011.8.591PMID:
21631148
14. Fujita K, Sano D, Kimura M, Yamashita Y, Kawakami M, Ishiguro Y, et al. Anti-tumor effects of bevaci-zumab in combination with paclitaxel on head and neck squamous cell carcinoma. Oncol Rep. 2007; 18: 47–51. PMID:17549344
15. Byrd RH, Schnabel RB, Schultz GA. A trust region algorithm for nonlinearly constrained optimization. SIAM J Numer Anal. 1987; 24: 1152–1170.
16. McKay MD, Beckman RJ, Conover WJ. A Comparison of Three Methods for Selecting Values of Input Variables in the Analysis of Output from a Computer Code. Technometrics. 1979; 21: 239–245. 17. Cukier RI, Fortuin CM, Shuler KE, Petschek AG, Schaibly JH. Study of the sensitivity of coupled
reac-tion systems to uncertainties in rate coefficients: i theory. J Chem Phys. 1973; 59: 3873–3878. 18. Saltelli A, Tarantola S, Chan KPS. A quantitative model-independent method for global sensitivity