GID
2, 703–717, 2012Inner structure of the Puy de D ˆome volcano
A. Portal et al.
Title Page Abstract Introduction Conclusions References Tables Figures
◭ ◮
◭ ◮
Back Close Full Screen / Esc
Printer-friendly Version Interactive Discussion
Discussion
P
a
per
|
Dis
cussion
P
a
per
|
Discussion
P
a
per
|
Discussio
n
P
a
per
|
Geosci. Instrum. Method. Data Syst. Discuss., 2, 703–717, 2012 www.geosci-instrum-method-data-syst-discuss.net/2/703/2012/ doi:10.5194/gid-2-703-2012
© Author(s) 2012. CC Attribution 3.0 License.
Geoscientiic
Instrumentation
Methods and
Data Systems
Discussions
This discussion paper is/has been under review for the journal Geoscientific Instrumentation, Methods and Data Systems (GI). Please refer to the corresponding final paper in GI if available.
Inner structure of the Puy de D ˆome
volcano: cross-comparison of
geophysical models (ERT, Gravimetry,
Muonic Imagery)
A. Portal1,3,4, S. B ´en ´e2, P. Boivin1,3,4, E. Busato2, C. C ˆarloganu2, C. Combaret5, P. Dupieux2, F. Fehr2, P. Gay2, P. Labazuy1,3,4, I. Laktineh5, J.-F. L ´enat1,3,4, D. Miallier2, L. Mirabito5, V. Niess2, and B. Vulpescu2
1
Clermont Universit ´e, Universit ´e Blaise Pascal, Observatoire de Physique du Globe de Clermont-Ferrand, Laboratoire Magmas et Volcans, BP 10118,
63000 Clermont-Ferrand, France 2
Clermont Universit ´e, Universit ´e Blaise Pascal, CNRS/IN2P3, Laboratoire de Physique Corpusculaire, BP 10118, 63000 Clermont-Ferrand, France
3
Laboratoire magmas et volcans (LMV), CNRS, UMR6524, 63038 Clermont-Ferrand, France 4
IRD, R163, LMV, 63038 Clermont-Ferrand, France 5
GID
2, 703–717, 2012Inner structure of the Puy de D ˆome volcano
A. Portal et al.
Title Page Abstract Introduction Conclusions References Tables Figures
◭ ◮
◭ ◮
Back Close Full Screen / Esc
Printer-friendly Version Interactive Discussion
Discussion
P
a
per
|
Dis
cussion
P
a
per
|
Discussion
P
a
per
|
Discussio
n
P
a
per
|
Received: 18 July 2012 – Accepted: 24 July 2012 – Published: 5 September 2012 Correspondence to: A. Portal ([email protected])
GID
2, 703–717, 2012Inner structure of the Puy de D ˆome volcano
A. Portal et al.
Title Page Abstract Introduction Conclusions References Tables Figures
◭ ◮
◭ ◮
Back Close Full Screen / Esc
Printer-friendly Version Interactive Discussion
Discussion
P
a
per
|
Dis
cussion
P
a
per
|
Discussion
P
a
per
|
Discussio
n
P
a
per
|
Abstract
Muon imagery of volcanoes and geological structures are presently and actively de-veloped by several groups in the world. It has the potential to provide a 2-D or 3-D density distribution with an accuracy of a few percent. However, at this stage of the de-velopment of the method, comparisons with the results from established geophysical
5
methods are necessary to validate its results. An experiment is currently carried out at the Puy de D ˆome volcano involving the concurrent acquisition of muon imagery, elec-trical resistivity (2-D tomography) and gravity survey. Here, we present the preliminary results for the last two methods.
North-south and east-west resistivity sections have been obtained in June 2011 and
10
May 2012. These electric data allow to model of the distribution of the resistivity values down to the base of the dome. The dome and its surroundings are now mapped with more than 300 gravity stations measured during a detailed gravity survey carried out in March and May 2012. The computed Bouguer anomaly can be interpreted by models of the density distribution within the dome. This will be directly comparable with the
15
results from the muon imagery. Our ultimate goal is to derive a model of the dome using the joint interpretation of all the sets of data.
1 Introduction
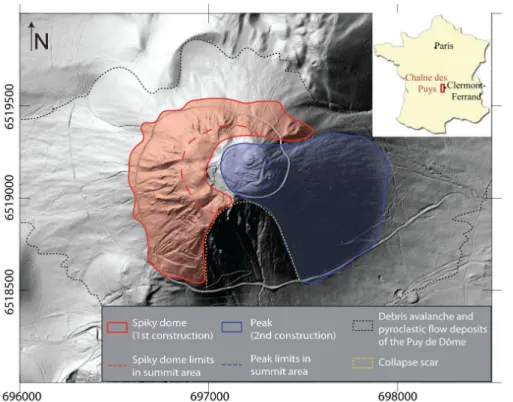
Puy de D ˆome is a 11 000 yr old and 400 m high trachytic dome situated in the cen-tral part of La Chaˆıne des Puys volcanic field (Massif Central, France). Its morphology
20
suggests the presence of two distinct units (Fig. 1), with the second one emplaced in the scar of a sector collapse in the former one (Boivin et al., 2009). Puy de D ˆome construction was accompanied and followed by significant fumarolic and hydrother-mal activity, as shown by hydrotherhydrother-mal alteration features on summit outcrops. A late phreato-magmatic eruption of weak amplitude marked the end of activity of the dome
25
GID
2, 703–717, 2012Inner structure of the Puy de D ˆome volcano
A. Portal et al.
Title Page Abstract Introduction Conclusions References Tables Figures
◭ ◮
◭ ◮
Back Close Full Screen / Esc
Printer-friendly Version Interactive Discussion
Discussion
P
a
per
|
Dis
cussion
P
a
per
|
Discussion
P
a
per
|
Discussio
n
P
a
per
|
The dual morphology of the volcano is clearly evidenced by the high precision (50 cm resolution) LiDAR survey (Fig. 1).
The ToMuVol (Muon Tomography of Volcanoes) collaboration, involves geological (Laboratoire Magmas et Volcans, LMV) and physical (Laboratoire de Physique Corpus-culaire, LPC) researchers and is aimed at developing muon tomography for studying
5
and monitoring volcanoes. The Puy de Dome was selected as an experimental site because of: (1) its geological and morphological characteristics (i.e. simple external shape but probably complex inner structure), (2) its proximity with the laboratories in Clermont-Ferrand and (3) its very good accessibility. In addition to muon imagery, two geophysical surveys have been carried out on the Puy de D ˆome: electrical resistivity
10
tomography measurements (June 2011 and May 2012) and a high resolution gravity survey (March and May 2012).
The objective of this work is first to compare models from electrical and gravity mea-surements, then to compare models from these classical geophysical methods with muonic models and later to define inner structures of the Puy de D ˆome volcano and
15
validate the muon approach.
2 Methodology
2.1 Electrical Resistivity Tomography (ERT)
The ERT method provides images of the distribution of electrical properties in the soil. In the case of the Puy de D ˆome volcano, field measurements used multi-electrode
20
systems based on a quadripole method that works by injecting an electric current us-ing two electrodes and then measurus-ing the resultant potential with the remainus-ing two electrodes. The injected current generates an electric field that is dependent of the dis-tribution of the ground conductivity. An apparent electrical resistivity is deduced using Ohm laws.
GID
2, 703–717, 2012Inner structure of the Puy de D ˆome volcano
A. Portal et al.
Title Page Abstract Introduction Conclusions References Tables Figures
◭ ◮
◭ ◮
Back Close Full Screen / Esc
Printer-friendly Version Interactive Discussion
Discussion
P
a
per
|
Dis
cussion
P
a
per
|
Discussion
P
a
per
|
Discussio
n
P
a
per
|
The rock resistivity depends on the fluid content and nature (usually water), the per-meability and the alteration of the rocks. Geological interpretations can be ambiguous because different lithologies can have similar resistivities and also because of the non-uniqueness of the models. On the other hand, the resistivity of rocks within a structure such as the studied dome, may vary significantly (several orders of magnitude) and
5
therefore the method has a high potential to differentiate volcanic structures.
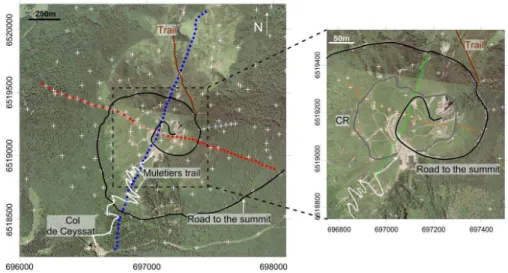
Figure 2 shows the location of the electrical acquisition lines. We used an ABEM SAS 4000 system with 64 electrodes with electrode spacing of 35 m for the entire volcano, and 5 m in the summit area. Both Wenner (vertical sensibility) and Wenner-Schlumberger (vertical and horizontal sensibility) protocols were used for the
measure-10
ments.
Res2Dinv software, developed by Loke (Loke and Barker, 1996), was used to ob-tain 2-D models. Prior to inversion, the raw data were filtered out. The datasets along each profile comprise the data from both 35 m and 5 m electrode spacing lines and the topography is taken into account.
15
2.2 High resolution gravity survey
The method allows to map the gravity field variations due to the uneven density distribu-tion in the geological target. We used a Scintrex CG-5 Gravimeter (INSU, CNRS). This instrument measures the relative gravity value between gravity stations. The absolute value was obtained at stations where the absolute gravity value has been previously
20
determined. Station spacing in our survey (Fig. 2) was around 250 m in the distal zone (between 1 and 2 km far from the summit) and 80 m in the proximal zone (1 km around the summit). Absolute gravity bases and secondary bases established during the sur-vey were measured during each daily prospect. Typically, 50 % of the station and base measurements were repeated twice during each prospect in order to have an optimum
25
control on the quality of the data.
GID
2, 703–717, 2012Inner structure of the Puy de D ˆome volcano
A. Portal et al.
Title Page Abstract Introduction Conclusions References Tables Figures
◭ ◮
◭ ◮
Back Close Full Screen / Esc
Printer-friendly Version Interactive Discussion
Discussion
P
a
per
|
Dis
cussion
P
a
per
|
Discussion
P
a
per
|
Discussio
n
P
a
per
|
Earth and measured values. It is calculated from gravity data after (1) instrumental and tide drift corrections, (2) theoretical gravity value calculation (or latitude correction), (3) free air correction, (4) plateau correction (depending on density correction value ρcor) and (5) topography correction (also withρcor). This anomaly reflects the density variations in the ground.
5
3 Results
3.1 Resistivity distribution models of Puy de D ˆome volcano
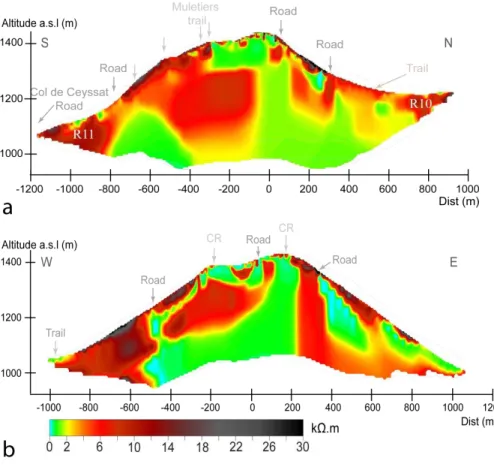
The inversion of the electrical data provides 2-D models of the distribution of the resis-tivity. The two models shown on figure 3 have an accuracy of 7 % for the north-south section and 20 % for the east-west model. The data from the summit detailed electrical
10
survey (5 m electrode spacing) were added to the 35 m electrode spacing data, thus allowing to obtain a better image of the superficial structures.
The models show a general heterogeneity of the Puy de D ˆome. Parts with resistivity higher than 5 kΩm suggests massive, unaltered or poorly altered rocks of the dome ex-trusion. Alternatively, they could also be low permeability, dry breccias or pyroclastites.
15
Low resistivity parts (ρ <5 kΩm) probably correspond to wet or intensely altered or brecciated rocks, or rocks containing conductive minerals (clay for example).
Superficial zones with high resistivity values are observed along the Puy de D ˆome slopes. These formations have low thickness (tens of meters). Recent geological ob-servations suggest that these structures could be actual lava flows emitted by a summit
20
vent (D. Miallier and P. Boivin, personal communication, 2012).
GID
2, 703–717, 2012Inner structure of the Puy de D ˆome volcano
A. Portal et al.
Title Page Abstract Introduction Conclusions References Tables Figures
◭ ◮
◭ ◮
Back Close Full Screen / Esc
Printer-friendly Version Interactive Discussion
Discussion
P
a
per
|
Dis
cussion
P
a
per
|
Discussion
P
a
per
|
Discussio
n
P
a
per
|
3.2 Bouguer anomaly map
The Bouguer anomaly is often correlated with the topography if the density of correction is too different from that of the rocks that create the topography. The Nettleton test determines the correction density that minimises the topography-anomaly correlation (Nettleton, 1939). In the case of the Puy de D ˆome, we found that a density correction
5
of 2.0×10³kg m−3 minimizes the topography-anomaly relation. This value is in good
agreement with density measurements made on samples of the Puy de D ˆome rocks (D. Miallier, personal communication, 2012, i.e., in the range 1.6–2.2×10³kg m−3).
The local anomaly was calculated by subtracting a regional component (first degree surface estimate). The resulting residual Bouguer anomaly with a density correction of
10
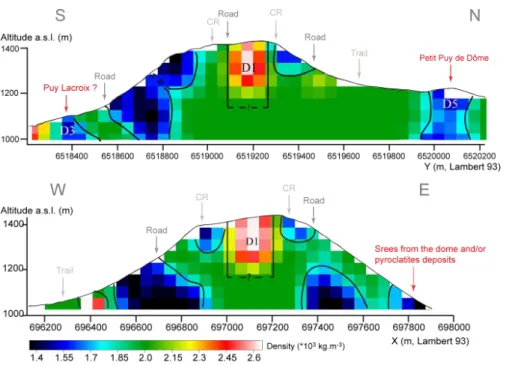
2.0×10³kg m−3is used for the modelling.
The gravity models were obtained using an inversion package, GROWTH2.0, devel-oped by Camacho et al. (2011). Figure 4 shows density sections of the models of the Puy de D ˆome. A high heterogeneity is visible in the volcano structure. A dense core is identified under summit area and is probably rooted bellow 500 m into the volcano.
15
On both sides of this core, low density structures form a ring-like pattern (assuming an axial symmetry). Beneath the lower slopes of Puy de D ˆome volcano, we observe for-mations with low density values that can also be identified in some places with known strombolian cones. These structures are mainly composed of low density scoriaceous material.
20
4 Discussion
4.1 Comparison of resistivity and density models
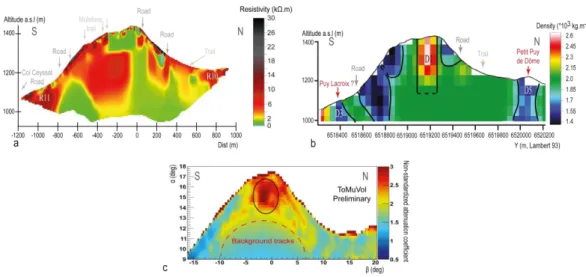
The comparison of these two types of geophysical models along the north-south di-rection (Fig. 5a and b) shows both similar and different structures. Among the similar structures, R10 and R11 (high resistivity) on the one hand and D5 and D3 (low density)
GID
2, 703–717, 2012Inner structure of the Puy de D ˆome volcano
A. Portal et al.
Title Page Abstract Introduction Conclusions References Tables Figures
◭ ◮
◭ ◮
Back Close Full Screen / Esc
Printer-friendly Version Interactive Discussion
Discussion
P
a
per
|
Dis
cussion
P
a
per
|
Discussion
P
a
per
|
Discussio
n
P
a
per
|
clearly match with two strombolian cones: the Petit Puy de D ˆome at the north and Puy Lacroix towards the south. Inside the dome, the correlation between resistivity and density structures is not clear. Indeed, D1 structure (dense core) has no resistivity equivalent when we would expect that massive intrusions would have both resistivity and density values higher than that of the other deposits such as pyroclastites and
5
breccias. In the case of Puy de D ˆome volcano, the correlation between physical prop-erties of rocks and their nature appears to be more complex. In our opinion, the density model is robust enough to interpret D1 as a massive trachytic structure. The variable resistivity of this structure can probably be inferred to fracturing processes that make possible the alteration of rocks by giving way to water and fumaroles circulations.
Ob-10
viously, the joint comparison of the resistivity and density structures has to be further investigated in the case of the Puy de Dome. For this, we plan to study the physical properties of rock samples from the dome. This will help to understand the resistivity and density structures and will provide robust constraints to compute new geophysical models.
15
4.2 Comparison of gravity and muonic models
Using Fig. 5b and c we can compare the initial results from muonic imagery with den-sity models obtained from gravity measurements. The Fig. 5c presents a preliminary model of the absorption coefficient distribution of the Puy de D ˆome along a north-south section. Such an image integrates the signal of muons crossing the dome along
20
the west-east direction. Since muon attenuation is linearly linked with the rock density, comparisons with the gravity data can be attempted, keeping in mind that Fig. 5b rep-resents a section in a 3-D model and Fig. 5c an image of the muon signal across the dome.
The two models show a dense core located beneath the top of the volcano. This
25
GID
2, 703–717, 2012Inner structure of the Puy de D ˆome volcano
A. Portal et al.
Title Page Abstract Introduction Conclusions References Tables Figures
◭ ◮
◭ ◮
Back Close Full Screen / Esc
Printer-friendly Version Interactive Discussion
Discussion
P
a
per
|
Dis
cussion
P
a
per
|
Discussion
P
a
per
|
Discussio
n
P
a
per
|
not carried out a detailed analysis of these, because the preliminary muon image still needs to be improved. However, we note the preliminary image provides a good insight of the capabilities of the muonic imagery.
In the future, we intend to perform a joint inversion of the gravity and muonic data to obtain better constrained models. This approach has already been applied
5
by Nishiyama et al. (2012) for Mt. Showa-Shinzan lava dome.
5 Conclusions
This study aims to compare different geophysical models: ERT and gravity on the one hand, and a comparison of these methods with muonic tomography on the other hand. Our goal is to develop a method to study the interior of volcanoes with muon
tomogra-10
phy alone or with the addition of other conventional geophysical methods.
Our preliminary results on the Puy de D ˆome volcano illustrate the complex correla-tion between different parameters.
Acknowledgements. The LIDAR data used in this study have been provided through a collec-tive project driven by the Centre R ´egional Auvergnat de l’Information G ´eographique (CRAIG) 15
which has been financially supported by the Conseil G ´en ´eral du Puy-de-D ˆome, the Fonds Europ ´een de D ´eveloppement R ´egional (FEDER) and the Blaise Pascal University of Clermont-Ferrand (UBP).
References
Boivin, P., Besson, J. C., Briot, D., Camus, G., de Go ¨er de Herve, A., Gourgaud, A., Labazuy, 20
P., Langlois, E., de Larouzi `ere, F. D., Livet, M., Mergoil, J., Miallier, D., Morel, J. M., Vernet, G., and Vincent, P.: Volcanologie de la Chaˆıne des Puys, Parc Naturel R ´egional de la Chaˆıne des Puys, Carte et fascicule, 5th Edn., 200 pp., 2009.
Camacho, A. G., Fern ´andez, J., and Gottsmann, J.: The 3-D gravity inversion package GROWTH2.0 and its application to Tenerife Island, Spain, Computers and Geosciences, 25
GID
2, 703–717, 2012Inner structure of the Puy de D ˆome volcano
A. Portal et al.
Title Page Abstract Introduction Conclusions References Tables Figures
◭ ◮
◭ ◮
Back Close Full Screen / Esc
Printer-friendly Version Interactive Discussion
Discussion
P
a
per
|
Dis
cussion
P
a
per
|
Discussion
P
a
per
|
Discussio
n
P
a
per
|
Loke, M. H. and Barker, R. D.: Practical techniques for 3-D resistivity surveys and data inversion, Geophys. Prospect., 44, 499–523, 1996.
Miallier, D., Boivin, P., Deniel, C., Gourgaud, A., Lanos, P., Sforna, M., and Pilleyre, T.: The ultimate eruption of the Puy de D ˆome volcano (Chaˆıne des Puys, French Massif Central) about 10,700 years ago, CR Geosci., 342, 847–854, 2010.
5
Nettleton, L. L.: Determination of density for reduction of gravimeter observations, Geophyics, 4, 179–183, doi:10.1190/1.1437088, 1939.
Nishiyama, H., Oshima, H., Maekawa, T., Tanaka, H., Tanaka, Y., and Okubo, S.: Development of a joint inversion technique using gravity and muon-radiographic data for resolving three-dimensional density structure of a gigantic body, in: “High energy geophysics: muon and 10
GID
2, 703–717, 2012Inner structure of the Puy de D ˆome volcano
A. Portal et al.
Title Page Abstract Introduction Conclusions References Tables Figures
◭ ◮
◭ ◮
Back Close Full Screen / Esc
Printer-friendly Version Interactive Discussion
Discussion
P
a
per
|
Dis
cussion
P
a
per
|
Discussion
P
a
per
|
Discussio
n
P
a
per
|
Fig. 1.High resolution LiDAR DEM of the Puy de D ˆome (50 cm resolution, CRAIG – GeoPhenix
GID
2, 703–717, 2012Inner structure of the Puy de D ˆome volcano
A. Portal et al.
Title Page Abstract Introduction Conclusions References Tables Figures
◭ ◮
◭ ◮
Back Close Full Screen / Esc
Printer-friendly Version Interactive Discussion
Discussion
P
a
per
|
Dis
cussion
P
a
per
|
Discussion
P
a
per
|
Discussio
n
P
a
per
|
Fig. 2.Location of the ERT lines and gravimetric stations on the Puy de D ˆome volcano. (Left
GID
2, 703–717, 2012Inner structure of the Puy de D ˆome volcano
A. Portal et al.
Title Page Abstract Introduction Conclusions References Tables Figures
◭ ◮
◭ ◮
Back Close Full Screen / Esc
Printer-friendly Version Interactive Discussion
Discussion
P
a
per
|
Dis
cussion
P
a
per
|
Discussion
P
a
per
|
Discussio
n
P
a
per
|
Fig. 5.Comparison of geophysical models along north-south direction.(a)2-D resistivity model;