DOI: 10.5216/cab.v14i2.13571
EFFECT OF SEVERAL STRUCTURES OF CONTEMPORARY
GROUPS ON ESTIMATES OF (CO)VARIANCE AND GENETIC
PARAMETERS FOR WEANING WEIGHT IN NELLORE CATTLE
LILLIAN PASCOA1, ARCADIO DE LOS REYES2, MAURICIO A. ELZO3, JORGE LUIZ FERREIRA4, LUIZ A.F.
BEZERRA5, RAYSILDO BARBOSA LOBO5
1Professor, PhD, Instituto Federal de Educação, Ciência e Tecnologia de Goiás, Aparecida de Goiânia, GO, Brazil.
2Professor, PhD, Universidade Federal de Goiás, Goiânia, GO, Brazil
3Professor, PhD, Department of Animal Sciences, University of Florida, Gainesville, Florida, USA. 4Professor, PhD, Universidade Federal do Tocantins, Araguaína, TO, Brazil.
5Department of Genetics, FMRP-USP, Ribeirão Preto-SP, Brazil
ABSTRACT We used actual and adjusted weights to 120 d and 210 d
of age of 72,731 male and female Nellore calves born in 40 PMGRN - Nellore Brazil herds from 1985 to 2005
aiming to compare the effect of different definitions of contemporary groups on estimates of (co)variance and genetic parameters. Four models, each one with a different structure of contemporary group (CG), were compared
using the Akaike Information Criterion (AIC), the Bayesian Information Criterion (BIC), and the Consistent Akaike Information Criterion (CAIC). (Co)variance
estimates were obtained using a derivative-free restricted maximum likelihood procedure. Estimates of (co)variances and genetic parameters were similar for the four models considered. However, the BIC and CAIC indicated that the most appropriate model for this Nellore population was the one that considered CG to be random,
and sex of calf to be fixed and separate from CG, in which CG was defined as the group of calves born in the same
herd, year, season of birth (trimester), and undergone the same management.
KEYWORDS:beef cattle; contemporary groups; information criteria.
EFEITO DE DIFERENTES MODELOS SOBRE AS ESTIMATIVAS DE
(CO)VARIÂNCIAS E PARÂMETROS GENÉTICOS PARA PESOS ATÉ A DESMAMA EM GADO NELORE
RESUMO Com o objetivo de se comparar o ajustamento de modelos com diferentes definições de grupos contemporâneos sobre as estimativas de (co)variâncias e parâmetros genéticos para pesos padronizados e reais aos 120 e 210 dias de idade, analisaram-se dados de 72.731 bezerros Nelore, machos e fêmeas, nascidos de 1985 a 2005 em 40
rebanhos integrantes do PMGRN - Nelore Brasil. Foram
comparados quatro modelos incluindo diferentes estruturas de grupos contemporâneos (CG), julgados pelos
derivadas. As estimativas de (co)variâncias e parâmetros genéticos foram similares entre os modelos, porém os critérios de informação (BIC, CAIC) indicaram que o modelo mais adequado é o que considera o grupo contemporâneo como efeito aleatório, sendo este
constituído pela concatenação dos efeitos de rebanho, ano de nascimento, grupo de manejo e efeito sazonal de trimestre de nascimento, e com efeito do sexo do bezerro independente do CG.
PALAVRAS-CHAVE: critérios de informação; gado de corte; grupos contemporâneos.
INTRODUCTION
The structure of contemporary groups (CG) is of primary importance for genetic evaluation of animals under selection; they are crucial to avoid potential biases in genetic evaluations due to differential treatment of animals in a population (VAN VLECK, 1987).
Contemporary groups have usually been considered as fixed effects in beef cattle genetic evaluations. This has been based on HENDERSON (1973) statement that in sire models, genetic predictions of sires would be associated to contemporary group effects, and to eliminate this bias, CG needed to be defined as fixed effects. Currently, the model of choice is an animal model where individuals are assumed to represent a random sample of the genetic material in a population; however, CG continues to be considered as fixed effects.
Some authors have found that random CG effects yield a better adjustment than models with fixed CG in various animal species. In small herds, BABOT et al. (2003) managed to estimate genetic values for litter size in herds with insufficient number of animals per CG using simulated data, whereas VASCONCELOS et al. (2005) estimated genetic values for milk production in dairy cattle in Portugal using contrast models. Treating CG as random effects was also found to be advantageous by GONZÁLEZ-RECIO & ALENDA (2005) when analyzing binary reproductive traits in Spanish dairy cattle, by WOLF et al. (2005) for growth and litter size in swine utilizing a multi-trait animal model, and by LEGARRA et al. (2005) for milk production in ewes using a Bayesian approach.
To obtain the best possible estimates of (co)variance and genetic parameters it is important to define mathematical models that fit the available data as accurately as possible. This will in turn yield the most accurate genetic predictions given the available information. Thus, the objective of this study was to compare models with different definitions of contemporary groups on estimates of (co)variances and genetic parameters for actual and adjusted weights at 120 and 210 d of age in Nellore cattle in Brazil.
MATERIAL AND METHODS
Actual and adjusted weights at 120 d (AW120, RW120) and 210 d (AW210, RW210) from 72,731 male and female Nellore calves born between 1985 and 2005 in 40 herds from PMGRN-Nellore Brazil were used in this study. Actual weights were the closest ones to 120 d and 210 d within the intervals of 120 ± 90 d and 210 ± 90 d, respectively. Calf ages were expressed as deviations (CAD) from 120 d and 210 d. Adjusted weights were computed by interpolation between a prior and a posterior weight to the standardized age (120 d or 210 d), allowing a maximum interval of 195 d between these two weights (± 90 d plus an additional 15 d due to possible management changes). Birth weight was used as the prior weight for AW120 when there was no other weight (actual birth weight or breed mean: 33 kg for males, and 31 kg for females) to compute the interpolation. Computations were similar to PMGRN (LÔBO, 1996):
AW = W + [(W-Wp)/I] x (A - Aw)
where, AW = adjusted weights at standard ages (AW120 or AW210); W = actual weight; Wp = prior weight; I = interval in days between W and Wp; A = standard age (120 d or 210 d); Aw = age at measurement of W.
The effect of age of cow in years was grouped into six classes (DAC): 1 = 2 yr; 2 = 3 yr; 3 = 4 yr; 4 = 5 yr; 5 = 6 to 9 yr; and 6 = 10 yr and older cows.
Four structures of contemporary groups were defined by concatenation of individual effects, starting from a base subclass (CGB), as follows:
CGB: herd – year of birth – management group at each age.
CG1: CGB– semester of birth. CG2: CGB– trimester of birth. CG3: CG1– sex of calf. CG4: CG2 - sex of calf.
Based on these four CGs (CG1 to CG4), four analytical models were defined:
153 Effect of several structures of contemporary groups on estimates…
M3: Weight = α + CG3 + DAC + ε M4: Weight = α + CG4 + DAC + ε
where, Weight = actual or adjusted weight at 120 d or 210 d of age; α = constant; CG = contemporary group; SC = sex of calf; DAC = class of cow age at calving, and ε = random residual effect. In addition, models for actual weights included age of calf at weighing (CAD), modeled as a cubic polynomial regression, and expressed as a deviation from 120 d or 210 d.
A minimum of five observations per contemporary groups were required. Calves in CG with less than five observations were kept in the database but their weights were set to zero, thus their genetic evaluations were computed using solely information from their relatives. This allowed us to have the same inverse of the relationship matrix (A-1) with 119,586 animals in all analyses.
Models for the estimation of (co)variances and genetic parameters for AW120, RW120, AW210 e RW210 using single-trait analysis, considering CG fixed (1) or random (2), were as follows:
y = Xb + Z1d + Z2m + Z3pe + e (1)
y = Xb + Z1d + Z2m + Z3pe + Z4c + e (2)
where, y = vector of observations; b = vector of fixed effects, including CG (Equation 1), and the effects of SC, DAC, and a cubic polynomial regression on CAD for the analysis of actual weights (Equations 1 and 2); d, m, pe, c and e = vectors of additive direct genetic effects, additive maternal genetic effects, maternal permanent environmental effects, contemporary group, and residual, respectively; and X, Z1, Z2, Z3 e Z4, are known incidence matrices relating observations in vector y to vectors b, d, m, pe, and c, respectively. The assumptions of these models were:
E[y] = Xb, and E[d] = E[m] = E[pe] = E[c] = E[e] = 0, and
Var
e pe m d =
2 2 2 20
0
0
0
0
0
0
0
0
0
e pe m dm dm dI
I
A
A
A
A
for model 1, and
Var
e c pe m d = 2 2 2 2 2 0 0 0 0 0 0 0 0 0 0 0 0 0 0 0 0 0 0 e c pe m dm dm d I I I A A A A
for model 2, where, A = matrix of additive relationships among individuals; I = identity matrices of appropriate order, d2, m2 ,
2
pe
, 2c
and e2 = additive direct genetic variance, additive maternal genetic variance, permanent environmental variance, contemporary group variance, and residual variance, respectively; and
dm= covariance betweendirect and maternal genetic effects.
Models were compared using the logarithm of the likelihood function (logL), using the Akaike Information Criterion (AIC; AKAIKE, 1972), the Bayesian Information Criterion (BIC; SCHWARZ, 1978), and Consistent Akaike Information Criterion (CAIC, BOZDOGAN, 1987). The CAIC gives higher penalties to hyperparametrized models compared to AIC. Thus, BIC and CAIC favor parsimonious models. These criteria are defined as follows:
AIC = -2logL + 2k BIC = -2logL + klog(n) CAIC = -2logL + k(log(n)+1)
where, k = number of estimated parameters; n = number of observations; logL = logarithm of the likelihood function.
Models with lower values of these information criteria are considered to better fit the data.
Estimates of (co)variances and genetic parameters were obtained using a derivative-free restricted maximum likelihood procedure (DFREML; SMITH & GRASER, 1986). Computations were carried out using the MTDFREML (Multiple Trait Derivative Free Restricted Maximum Likelihood; BOLDMAN et al., 1995) software package using a single-trait animal model. Because comparisons among animals were done within contemporary groups, the variance due to CG, in those models that considered CG to be random, was not included in the phenotypic variance.
RESULTS AND DISCUSSION
Model Fitting
Table 1. Number of observations (n), number of estimated parameters (k), log-likelihood function (-2logL); information criteria AIC, BIC and CAIC to evaluate model fit for actual and adjusted weights at 120 days of age (AW120 and RW120)
Model CG n -2logL k AIC BIC CAIC
--- Adjusted Weight at 120 days of age (AW120) --- M1 R F 70,543 70,543 442,782 446,807 696 8 444,174 446,823 450,553 446,896 450,553 446,896
M2 R F 70,543 70,543 439,996 446,301 1085 8 442,166 446,317 452,109 446,390 452,110 446,390
M3 R F 70,543 70,543 440,877 447,416 1099 6 443,075 447,428 453,146 447,483 453,146 447,483
M4 R F 70,543 70,543 437,225 447,211 1676 6 440,577 447,223 455,936 447,278 455,936 447,278 --- Actual Weight at 120 days of age (RW120) --- M1 R F 70,677 70,677 458,902 463,026 699 11 460,300 463,048 466,707 463,149 466,707 463,149
M2 R F 70,677 70,677 456,037 462,487 1088 11 458,213 462,509 468,186 462,609 468,186 462,609
M3 R F 70,677 70,677 456,949 463,623 1102 9 459,153 463,641 469,254 463,723 469,254 463,723
M4 R F 70,677 70,677 453,163 463,357 1679 9 456,521 463,375 471,910 463,457 471,910 463,457 AIC = Akaike Information Criterion; BIC = Bayesian Information Criterion; CAIC = Consistent Akaike Information Criterion; CG = Contemporary group fixed (F) or random (R).
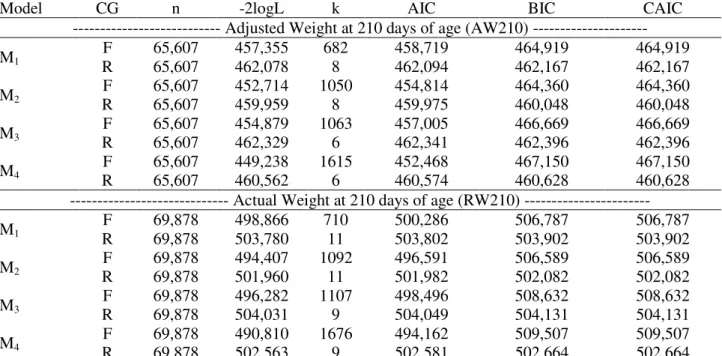
Table 2. Number of observations (n), number of estimated parameters (k), log-likelihood function (-2logL); information criteria AIC, BIC and CAIC to evaluate model fit for actual and adjusted weights at 210 days of age (AW210 and RW210)
Model CG n -2logL k AIC BIC CAIC
--- Adjusted Weight at 210 days of age (AW210) --- M1 F R 65,607 65,607 457,355 462,078 682 8 458,719 462,094 464,919 462,167 464,919 462,167
M2 F R 65,607 65,607 452,714 459,959 1050 8 454,814 459,975 464,360 460,048 464,360 460,048
M3 F R 65,607 65,607 454,879 462,329 1063 6 457,005 462,341 466,669 462,396 466,669 462,396
M4 F R 65,607 65,607 449,238 460,562 1615 6 452,468 460,574 467,150 460,628 467,150 460,628 --- Actual Weight at 210 days of age (RW210) --- M1 F R 69,878 69,878 498,866 503,780 710 11 500,286 503,802 506,787 503,902 506,787 503,902
M2 F R 69,878 69,878 494,407 501,960 1092 11 496,591 501,982 506,589 502,082 506,589 502,082
M3 F R 69,878 69,878 496,282 504,031 1107 9 498,496 504,049 508,632 504,131 508,632 504,131
M4 F R 69,878 69,878 490,810 502,563 1676 9 494,162 502,581 509,507 502,664 509,507 502,664 AIC = Akaike Information Criterion; BIC = Bayesian Information Criterion; CAIC = Consistent Akaike Information Criterion; CG = Contemporary group fixed (F) or random (R).
In all cases, the criterion AIC had the smallest values for models with CG fixed. On the other hand, BIC and CAIC, by imposing higher penalties than AIC for models with higher number of
155 Effect of several structures of contemporary groups on estimates…
(1992), working with dairy data from small herds, estimated lower prediction error variances (PEV) and mean squared errors (MSE) for models with random CG. Contrarily, VALVERDE et al. (2008), using Braunvieh cattle weaning weight data, found somewhat higher accuracies of genetic predictions for direct genetic effects when CG were considered fixed, and no difference between models with CG fixed or random for maternal genetic effects.
For weights at 120 d (AW120 and RW120), the criteria BIC and CAIC indicated that models with trimester seasonal effect had the best fit when CG was random (Table 1). A similar result was obtained for weights at 210 d (AW210 and RW210; Table 2). However, when CG was fixed, the best fitting models were those with semester seasonal effects for 120 d (AW120 and RW120), whereas for weights at 210 d, model M2 (trimester) was better than M1 (semester), but model M3 (semester) was better than M4 (trimester) for AW210 and RW210. On the other hand, REYES et al. (1998) found out that it was better to consider trimester over semester when they compared the efficiency of two fixed effects models containing season (trimester or semester) as part of the structure of contemporary groups for weaning weight in Nellore cattle.
According to the BIC and CAIC criteria, models that had sex of calf effect separated from CG, provided a better fit to the data. These models allowed the construction of contemporary groups with larger number of individuals and permitted better genetic connections among CG and higher accuracies of prediction of genetic evaluations. These results are in agreement with those found by REYES et al. (2006) for growth between birth and weaning in a multibreed Nellore x Hereford cattle population.
Among models with random CG, model M2 was the most parsimonious and provided the best fit. Thus, for 120 d and 210 d of age and actual or adjusted data, results here suggest that models that had random CG with trimester seasonal effect, and sex of calf effect separated from CG effect were the most appropriate for growth from birth to weaning in Nellore cattle.
(Co)variance components and genetic parameters Tables 3 and 4 present the estimates of (co)variances and genetic parameters for the four traits in this study (AW120, RW120, AW210 e RW210). Estimates for each trait differed little among models.
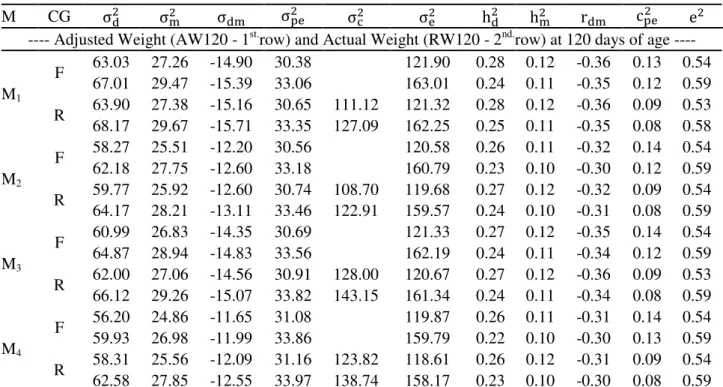
Table 3. Estimates of (co)variances and genetic parameters for actual and adjusted weights at 120 days of age in Nellore cattle in Brazil using several models
M CG
---- Adjusted Weight (AW120 - 1st.row) and Actual Weight (RW120 - 2nd.row) at 120 days of age ----
M1
F 63.03 27.26 -14.90 30.38 121.90 0.28 0.12 -0.36 0.13 0.54 67.01 29.47 -15.39 33.06 163.01 0.24 0.11 -0.35 0.12 0.59 R 63.90 27.38 -15.16 30.65 111.12 121.32 0.28 0.12 -0.36 0.09 0.53 68.17 29.67 -15.71 33.35 127.09 162.25 0.25 0.11 -0.35 0.08 0.58
M2
F 58.27 25.51 -12.20 30.56 120.58 0.26 0.11 -0.32 0.14 0.54 62.18 27.75 -12.60 33.18 160.79 0.23 0.10 -0.30 0.12 0.59 R 59.77 25.92 -12.60 30.74 108.70 119.68 0.27 0.12 -0.32 0.09 0.54 64.17 28.21 -13.11 33.46 122.91 159.57 0.24 0.10 -0.31 0.08 0.59
M3
F 60.99 26.83 -14.35 30.69 121.33 0.27 0.12 -0.35 0.14 0.54 64.87 28.94 -14.83 33.56 162.19 0.24 0.11 -0.34 0.12 0.59 R 62.00 27.06 -14.56 30.91 128.00 120.67 0.27 0.12 -0.36 0.09 0.53 66.12 29.26 -15.07 33.82 143.15 161.34 0.24 0.11 -0.34 0.08 0.59
M4
F 56.20 24.86 -11.65 31.08 119.87 0.26 0.11 -0.31 0.14 0.54 59.93 26.98 -11.99 33.86 159.79 0.22 0.10 -0.30 0.13 0.59 R 58.31 25.56 -12.09 31.16 123.82 118.61 0.26 0.12 -0.31 0.09 0.54 62.58 27.85 -12.55 33.97 138.74 158.17 0.23 0.10 -0.30 0.08 0.59 For each term: Adjusted weights (1st row) and actual weights (2nd row). M = Model; CG = Contemporary group fixed (F) or random
Table 4. Estimates of (co)variances and genetic parameters for actual and adjusted weights at 210 days of age in Nellore cattle in Brazil using several models
M CG
---- Adjusted Weight (AW210 - 1st.row) and Actual Weight (RW210) - 2nd.row) at 210 days of age ----
M1
F 145.24 49.44 -33.64 67.26 234.41 0.31 0.11 -0.40 0.15 0.51 153.89 52.05 -38.61 72.98 292.43 0.29 0.10 -0.43 0.14 0.55 R 146.35 49.39 -33.97 67.84 369.29 233.65 0.32 0.11 -0.40 0.08 0.50 155.44 52.05 -38.94 73.51 372.46 291.46 0.29 0.10 -0.43 0.08 0.55
M2
F 119.35 42.25 -20.84 66.59 231.23 0.27 0.10 -0.29 0.15 0.53 127.12 44.98 -26.09 72.15 290.03 0.25 0.09 -0.35 0.14 0.57 R 121.88 42.44 -21.41 67.19 344.51 229.66 0.28 0.10 -0.30 0.09 0.52 130.60 45.41 -26.89 72.70 350.62 287.93 0.27 0.09 -0.35 0.08 0.56
M3
F 142.78 49.27 -33.91 67.87 230.08 0.31 0.11 -0.40 0.15 0.50 151.25 51.87 -38.47 73.71 287.45 0.29 0.10 -0.43 0.14 0.55 R 144.49 49.26 -34.25 68.46 383.40 229.01 0.32 0.11 -0.41 0.08 0.50 153.57 51.96 -38.86 74.27 382.35 286.03 0.29 0.10 -0.44 0.08 0.54
M4
F 116.61 41.91 -21.14 67.55 226.68 0.27 0.10 -0.30 0.16 0.53 123.75 44.51 -25.60 73.24 285.04 0.25 0.09 -0.34 0.15 0.57 R 121.22 42.55 -22.00 67.95 372.24 223.99 0.28 0.10 -0.31 0.08 0.52 129.81 45.42 -26.86 73.63 371.83 281.57 0.26 0.09 -0.35 0.08 0.56 For each term: Adjusted weights (1st row) and actual weights (2nd row). M = Model; CG = Contemporary group fixed (F) or random
(R); = additive direct genetic variance; = additive maternal genetic variance; = direct-maternal genetic covariance; = maternal permanent environmental variance; = contemporary group variance; = residual variance; = direct heritability; = maternal heritability; = direct-maternal genetic correlation; = ratio of maternal permanent environmental variance to phenotypic variance; = ratio of residual variance to phenotypic variance.
Estimates of and were larger in models with semester of birth season effect in CG (M1 and M3) than those obtained in models with trimester of birth season effect in CG (M2 e M4). On the other hand, estimates of were similar in all models. These results may have been due to greater variation among weights when the period of time (season effect) considered in CG was longer.
Estimates of e for weight at 120 d and 210 d of age were similar in models that included or not the effect of sex of calf within CG (M2 vs M4 and M1 vs M3). Estimates of ranged from 118.61 to 163.01 kg2 for actual and adjusted weights at 120 d (W120), and from 223.99 to 292.43 kg2 for actual and adjusted weights at 210 d (W210), with smaller values in CG of larger size, i.e., those in models that considered semester seasonal effects and sex of calf separately from CG.
Models that considered CG random yielded higher estimates of and , and lower estimates of than models that considered CG fixed. Larger estimates of and smaller values of in models with random CG were also obtained for weaning weights in Braunvieh cattle in México (VALVERDE et al., 2008). Literature values
reported higher values of heritability estimates for models with fixed CG than for models with random CG (PHOCAS & LALOE, 2003; CHANVIJIT et al., 2005; VALVERDE et al., 2008). However, these lower heritability estimates for models with random CG were computed with phenotypic variances that included the variance due to contemporary group ( ), which is not appropriate because comparisons among animals evaluated genetically occur within contemporary groups.
Estimates for ranged from 56.20 to 68.17 kg2 and estimates for from 24.86 to 29.67 kg2 for weight at 120 d of age (W120). For weights at 210 d of age (W210), estimates ranged from 116.61 to 155.44 kg2 and estimates of ranged from 41.91 to 52.05 kg2. Estimates of
157 Effect of several structures of contemporary groups on estimates…
in milk production of future mothers and a reduction in weaning weights of their progenies (VALVERDE et al., 2008).
Estimates of ranged from 30.38 to 33.97 kg2 for W120 and from 66.59 to 74.27 kg2 for W210. These estimates were higher than those reported by GARNERO et al. (2001) for weights at 120 d of age (19.1 kg2) and at 220 d of age (48.01 kg2).
Direct heritability estimates ranged from 0.22 to 0.28 for W120 and from 0.25 to 0.32 for W210. Estimates of maternal heritabilities ranged from 0.10 to 0.12 for W120 and from 0.09 to 0.11 for W210. MARCONDES et al. (2002) and SIQUEIRA et al. (2003) found similar estimates of direct heritability for W120 (0.24 and 0.29, respectively), and of maternal heritability (0.08) in Nellore cattle. GARNERO et al. (2001) also estimated values of heritability for direct genetic effects (0.19) and for maternal genetic effects (0.06) similar to those obtained here.
Differences among estimates of (co)variances and genetic parameters were small across models in this study, perhaps due to the utilization of the same matrix of additive relationships. However, one could expect that estimates from models that yield better fit would be more accurate and reliable.
CONCLUSIONS
The most appropriate model for the estimation of (co)variances and genetic parameters for actual and adjusted weights at 120 d and 210 d of age in Brazilian Nellore cattle was the one that had random CG and sex of calf separated from CG, where CG was defined as a group of calves born in the same herd, year, season measured as trimester of birth, and had the same management. Estimates of (co)variances and genetic parameters, predictions of breeding values, and ranking of animals obtained with the best model are expected to be more accurate and reliable.
REFERENCES
AKAIKE, H. Information theory and an extension of maximum likelihood principle. In: INTERNATIONAL SYMPOSIUM ON INFORMATION THEORY, 2., Proceedings… p.267-281, 1972. Disponível em http://www.sortiend.org/lme/Statistical%20Papers/Akaike
_1973%20with%20commentary.pdf, acesso em 03 de
março de 2013.
BABOT, D.; NOGUERA, J.L.; ALFONSO, L.; ESTANY, J. Fixed or random contemporary groups in genetic
evaluation for litter size in pigs using a single trait repeatability animal model. Journal of Animal Breeding and Genetics, v. 120, n. 1, p.12-22, 2003.
BOLDMAN, K.; KRIESE, L.; VAN VLECK, L.D. A manual for use of MTDFREML : A set of programs to obtain estimates of variances and covariances. USDA. ARS., 1993.
BOZDOGAN, H. Model selection and Akaike’s information criterion (AIC): the general theory and its analytical extensions. Psychometrika, v. 52, p.345-370, 1987.
CHANVIJIT, K.; DUANGJINDA, M.;
PATTARAJINDA, V.; REODECHA, C. Model comparison for genetic evaluation of Milk yield in crossbred Holsteins in the tropics. Journal of Applied Genetics, v. 46, n. 4, p.387-393, 2005.
FERREIRA, G.B.; MACNEIL, M.D.; VAN VLECK, L.D. Variance components and breeding values for growth traits from different statistical models. Journal of Animal Science, v. 77, p. 2641-2650, 1999.
GARNERO, A.V.; LOBO, R.B.; BEZERRA, L.A.F.; OLIVEIRA, H.N. Comparação entre alguns critérios de seleção para crescimento na raça Nelore. Revista Brasileira de Zootecnia, v.30, n. 3, p.714-718, 2001.
GONZÁLEZ-RECIO, O.; ALENDA, R. Genetic parameters for female fertility traits and a fertility index in Spanish dairy cattle. Journal of Dairy Science, v. 88, p. 3282-3289, 2005.
HENDERSON, C.R. Sire evaluation and genetics trends. In: ANIMAL BREEDING AND GENETIC SYMPOSIUM IN HONOR OF DR. JAY L. LUSH, Illinois, USA. Proceedings… Illinois, v. 1, p.10-41, 1973.
Disponível em:
<http://jas.fass.org/cgi/reprint/1973/Symposium/10> Acesso em: 15 mar. 2011.
LEE, C.; POLLAK, E.J. Genetic antagonism between body weight and milk production in beef cattle. Journal of Animal Science, v. 80, p.316-32, 2002.
LEGARRA, A.; LÓPEZ-ROMERO, P.; UGARTE, E. Bayesian model selection of contemporary groups for BLUP genetic evaluation in Latxa dairy sheep. Livestock Production Science, v. 93, p.205-212, 2005.
LÔBO, R.B. Programa de Melhoramento Genético da Raça Nelore, 2 Ed. Ribeirão Preto, SP: ANCP, 1996.
REYES, A.; LOBO, R.B.; BEZERRA, L.A.F.; MARTINS, E.N. Critérios de época na conformação de grupos contemporâneos para características de crescimento em Nelore. In: REUNIÃO ANUAL DE SOCIEDADE BRASILEIRA DE ZOOTECNIA, 35., Botucatu. Anais... Botucatu : SBZ, v. 3, n. 1, p. 437-439,
1998. Disponível em
http://www.sbz.org.br/reuniaoanual/anais/arq_reuniao_an ual/sbz1998.rar. Acesso em 03 março 2013.
REYES, A.; ELZO, M.A.; ROSO, V.M.; FRIES, L.A.; CARVALHEIRO, R. Efeitos não genéticos na composição dos grupos contemporâneos para o ganho de peso do nascimento a desmama de uma população multirracial Nellore x Hereford. In: REUNIÃO ANUAL DA SOCIEDADE BRASILEIRA DE ZOOTECNIA, 43., João Pessoa. Anais... João Pessoa, 2006. Disponível em: <http://www.animal.ufl.edu/elzo/Publications/Proceedings/2 006/Sociedad%20Brazileira%20de%20Zootecnia/Reyes%20
et%20al._SBZ43_July-24-27-2006_Trabalho_HOMEPAGE.pdf. Acesso em 20 out. 2009.
ROSALES, A.J.; ELZO, M.A.; MONTANO, B.M. Parámetros y tendencias genéticas para características de crecimiento predestete em la población mexicana de Simmental. Revista Mexicana de Ciencias Pecuarias, v. 42, p. 171-180, 2004.
SCHWARZ, G. Estimating the dimension of a model. The Annals of Statistics, v. 6, n. 2, p.461-464, 1978. Disponível em: < http://www.jstor.org/stable/2958889> Acesso em: 15 mar. 2011.
SIQUEIRA, R.L.P.G.; OLIVEIRA, J.A.; LOBO, R.B.; BEZERRA, L.A.F.; TONHATI, H. Análise da variabilidade genética aditiva de características de
crescimento na raça Nelore. Revista Brasileira de Zootecnia, v. 32, n. 4, p. 880-886, 2003.
SMITH, S.P.; GRASER, H.U. Estimating Variance Components in a Class of Mixed Models by Restricted Maximum Likelihood. Journal of Dairy Science, v. 69, p. 1156-1165, 1986.
UGARTE, E.; ALENDA, R.; CARABAÑO, M.J. Fixed or random contemporary groups in genetic evaluations. Journal of Dairy Science, v. 75, p. 269-278, 1991.
VALVERDE, R.R.; DOMÍNGUEZ, R.N.; FLORES, A.R.; MUÑÍS, J.G.G.; VALENCIA, F.M. Comparación de definiciones de grupos contemporáneos en la evaluación genética de bovinos Suizo Europeo. Revista Mexicana de Ciencias Pecuarias, v. 46, n. 4, p. 359-370, 2008.
VAN VLECK, L.D. Contemporary Groups for Genetic Evaluations. Journal of Dairy Science, v. 70, p. 2456-2464, 1987.
VASCONCELOS, J.; MARTINS, A.; FERREIRA, A.; CARVALHEIRA, J. Consequências da eliminação de rebanhos pequenos da avaliação genética de bovinos leiteiros em Portugal. Revista Portuguesa de Zootecnia, v. 12, p. 105-117, 2005.
VISSHER, P.M.; GODDARD, M.E. Fixed and random contemporary groups. Journal of Dairy Science, v. 76, p. 1444-1454, 1992.
WOLF, J.; ZAKOVA, E.; GROENEVELD, E. Genetic parameters for a joint genetic evaluation of production and reproduction traits in pigs. Czech Journal of Animal Science, v. 50, n. 3, p. 96-103, 2005.