Are there differences between comparison
methods used to evaluate the accuracy and reliability
of digital models?
Objectives: The accuracy and reliability of plaster models and digital models acquired with two different surface laser scanners were tested by means of three methods: measurement with calipers, digital measurement with proper software and superimposition of the digital models. Methods: Thirty plaster models with permanent dentition that met the inclusion criteria were selected and scanned with two laser scanners (R700 and Xcad). Three examiners measured distances on plaster models with a digital caliper and on digital models using Ortho Analyzer software. The digital models were also compared by means of superimposition of the models using the Geomagic Qualify software. The intra and inter-examiner reliability of the measurements were evaluated using the ICC. Paired t test was used to test the accuracy of the measure-ments on digital and plaster models. Results: The measurements on plaster and digital models acquired by two different scanners showed high values for the ICC. Although statistically significant differences between the measurements on plaster and digital models have been found, these discrepancies were not considered clinically relevant. The superimposition method with Geomagic Qualify software showed that the two digital models were not significantly different. Conclusions: Digital models created from scanned plaster models using the R700 or Xcad scanners were clinically accurate according to the two methods of comparison used.
Keywords: Orthodontics. Dimensional measurement accuracy. Reproducibility of results.
1 Universidade Federal Fluminense, School of Dentistry, Department of Orthodontics (Niterói/RJ Brazil).
2 Radboud University, Nijmegen Medical Centre, Department of Orthodontics (Nijmegen, The Netherlands).
3 Full Professor, Universidade Federal Fluminense, School of Dentistry, Department of Orthodontics (Niterói/RJ, Brazil).
» The authors report no commercial, proprietary or financial interest in the products or companies described in this article.
DOI: http://dx.doi.org/10.1590/2177-6709.22.1.065-074.oar
How to cite this article: Camardella LT, Breuning H, Vilella OV. Are there differences between comparison methods used to evaluate the accuracy and reli-ability of digital models? Dental Press J Orthod. 2017 Jan-Feb;22(1):65-74. DOI: http://dx.doi.org/10.1590/2177-6709.22.1.065-074.oar
Submitted: April 22, 2016 - Revised and accepted: September 03, 2016
Contact address: Leonardo Tavares Camardella Rua Mário Santos Braga, 30, 2º andar, sala 214 - Niterói/RJ CEP: 24.020-140 - E-mail: [email protected]
Objetivos: a acurácia e a confiabilidade de modelos de gesso e modelos digitais adquiridos por dois diferentes scanners de superfície a laser foram testadas com três métodos: medição com paquímetro, medição com programa específico e sobreposição de modelos digitais. Métodos: trinta modelos de gesso com dentição permanente que preencheram os critérios de inclusão predeterminados foram selecionados e escaneados com dois diferentes scanners a laser (R700 e Xcad). Três examinadores mediram distâncias selecionadas nos modelos de gesso usando um paquímetro digital e, nos modelos digitais, usando o programa Ortho Analyzer. Os modelos digitais também foram comparados por sobreposição de modelos, com o programa Geomagic Qualify. A confiabilidade intra e interexaminadores das medições foi avaliada por meio do coeficiente de correlação intraclasse (ICC). O teste t pareado foi utilizado para avaliar a acurácia das medições nos modelos de gesso e digitais. Resultados: as medições nos modelos de gesso e nos modelos digitais escaneados pelos dois diferentes scanners apresentaram valores elevados para o ICC. As diferenças estatisticamente significativas encontradas entre as medições nos modelos de gesso e nos modelos digitais não foram consideradas clinicamente relevantes. O método de sobreposição de modelos com o programa Geomagic Qualify demonstrou que os dois tipos de modelos digitais não foram sig-nificativamente diferentes. Conclusões: os modelos digitais criados a partir do escaneamento dos modelos de gesso com os scanners
R700 e Xcad foram clinicamente precisos, de acordo com os dois métodos de comparação utilizados.
INTRODUCTION
Plaster models have been an essential part of patient records for orthodontic treatment. They are a valuable tool for diagnosis and treatment, and can also provide a dynamic copy of the actual treatment progress of orth-odontic cases. It is widely used but oten associated with some problems such as storage, breakage and loss.1,2 The procedure of scanning the plaster models to create digital models, or directly scanning the teeth, gingiva and palate, is becoming a routine in clinical orthodon-tics. In 2014, 35% of graduate programs in Orthodon-tics in the United States and Canada used digital study models for most of the treated cases.3 The manufactur-ing of dental models to be used for CAD/CAM systems in Prosthetic Dentistry has been used for some decades.4
Digital models can be fabricated with the indirect method of laser scanning of plaster models1,5-18 and by scanning alginate and PVS impressions with laser scan-ners or with CT scanscan-ners.2 The direct method of intraoral
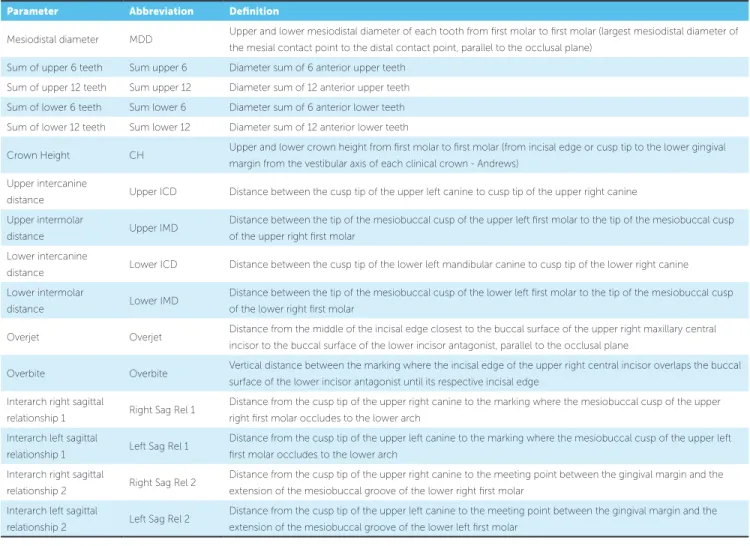
Table 1 - Parameters definitions.
scanning has been successfully introduced.12,19 Finally, the dentition can be evaluated and measured on the patient’s cone beam computed tomography (CBCT) image.2,5,14
Several studies evaluated the accuracy and reliabil-ity of measurements of digital models made by plaster models scan. Many of these studies found statistically signiicant diferences between the plaster model and digital model, but these diferences were considered to be clinically not relevant.1,5-17 Some studies found sta-tistically signiicant diferences and concluded that the measurements on the digital models were signiicantly larger,6,7,9,10,12 while others found signiicant lower values for the measurements on digital models.1,8,11 Accord-ing to this literature survey, it may be concluded that there is no agreement on the accuracy of digital model dimensions made in plaster models scans.
Digital models present several advantages compared to plaster models, such as ease of data storage and data transmission. A major advantage of digital models is the
Parameter Abbreviation Deinition
Mesiodistal diameter MDD Upper and lower mesiodistal diameter of each tooth from irst molar to irst molar (largest mesiodistal diameter of the mesial contact point to the distal contact point, parallel to the occlusal plane)
Sum of upper 6 teeth Sum upper 6 Diameter sum of 6 anterior upper teeth Sum of upper 12 teeth Sum upper 12 Diameter sum of 12 anterior upper teeth Sum of lower 6 teeth Sum lower 6 Diameter sum of 6 anterior lower teeth Sum of lower 12 teeth Sum lower 12 Diameter sum of 12 anterior lower teeth
Crown Height CH Upper and lower crown height from irst molar to irst molar (from incisal edge or cusp tip to the lower gingival margin from the vestibular axis of each clinical crown - Andrews)
Upper intercanine
distance Upper ICD Distance between the cusp tip of the upper left canine to cusp tip of the upper right canine Upper intermolar
distance Upper IMD
Distance between the tip of the mesiobuccal cusp of the upper left irst molar to the tip of the mesiobuccal cusp of the upper right irst molar
Lower intercanine
distance Lower ICD Distance between the cusp tip of the lower left mandibular canine to cusp tip of the lower right canine Lower intermolar
distance Lower IMD
Distance between the tip of the mesiobuccal cusp of the lower left irst molar to the tip of the mesiobuccal cusp of the lower right irst molar
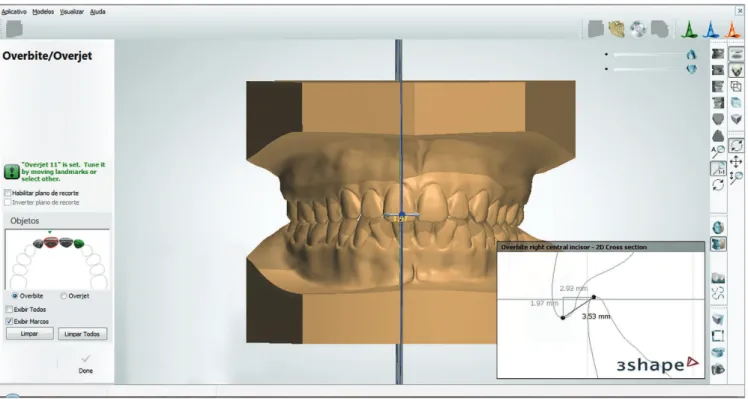
Overjet Overjet Distance from the middle of the incisal edge closest to the buccal surface of the upper right maxillary central incisor to the buccal surface of the lower incisor antagonist, parallel to the occlusal plane
Overbite Overbite Vertical distance between the marking where the incisal edge of the upper right central incisor overlaps the buccal surface of the lower incisor antagonist until its respective incisal edge
Interarch right sagittal
relationship 1 Right Sag Rel 1
Distance from the cusp tip of the upper right canine to the marking where the mesiobuccal cusp of the upper right irst molar occludes to the lower arch
Interarch left sagittal
relationship 1 Left Sag Rel 1
Distance from the cusp tip of the upper left canine to the marking where the mesiobuccal cusp of the upper left irst molar occludes to the lower arch
Interarch right sagittal
relationship 2 Right Sag Rel 2
Distance from the cusp tip of the upper right canine to the meeting point between the gingival margin and the extension of the mesiobuccal groove of the lower right irst molar
Interarch left sagittal
relationship 2 Left Sag Rel 2
ability to superimpose digital models for comparison, which cannot be done with plaster models, because of their physical nature.20
As there are several types of plaster model scanners available, studies that evaluate the accuracy and reliabil-ity of digital models produced by a speciic scanner are required. There are two diferent methods to compare the accuracy of digital models: measurements of dis-tances between teeth; and superimposition of the digital model on stable structures of the models. The aim of our study is to evaluate if these two methods of com-parison present similar results and can be used to test the accuracy of digital models in a complementary way.
MATERIALS AND METHODS
A pilot study with plaster models of 15 individuals was used to determine the sample size for this study. The formula described by Pandis,21 assuming a 80% power test and α = 0.05 was used to detect a diference of 0.7 mm between the models whit a standard devia-tion of 1.0 mm. This sample size calculadevia-tion revealed the need for a sample of at least 29 plaster models. Ethi-cal approval for the study was received before the start of the study (reference number: 221.664, 01/02/2013).
Impressions from a sample of students at the Orth-odontic Department of Universidade Federal Fluminense
were made. Inclusion criteria for the selected patients were: fully erupted permanent dentition (including all upper and lower irst permanent molars). Dentitions showing dental anomalies in size and shape, presence of
severe gingival recessions, dental crown abrasions, attri-tions and erosions or with ixed orthodontic retention, were excluded. The inal sample consisted of impres-sions of 30 volunteers. The age of the volunteers at the time of impression taking was between 21 and 39 years, with an mean of 27 years and 9 months.
Alginate impressions of the upper and lower arches were made (Hydrogum, Zhermack®, Badia Polesine, Rovigo, It-aly), following the manufacturer’s guidelines. The bite regis-tration was made with a # 7 dental wax (Clássico®, São Paulo, Brazil). This bite registration was used for trimming the base of the plaster models. The impression of the teeth and the alveolar ridge were poured with type IV plaster (Vigodent®, Rio de Janeiro, Brazil) and the base of the plaster model was poured with white plaster (Mossoró®, Rio de Janeiro, Brazil). The plaster models were scanned with two diferent types of surface laser scanners: R700 (3Shape®, Copenhagen, Den-mark) and Xcad (XCADCAM Tecnologia®, São Paulo, Brazil), according to the instructions of the manufactures. The digital models were used for measurements of dimen-sions and distances, using the Ortho Analyzer sotware (3Shape®, Copenhagen, Denmark), and for superimposition with Geomagic Qualify sotware (3D Systems®, Rock Hill, South Carolina, USA). Before the start of the measurements, sagittal, transverse and vertical adjustments on digital models were made when needed, with the mentioned sotware.
Sixty two parameters with clinical relevance for or-thodontics were deined (Table 1). Three trained and calibrated examiners performed the measurements on the dental models. For measurements on plaster
Figure 1 - Measurement of the height of the dental crown in the plaster model, with a digital caliper.
models, it was used a caliper with accuracy of 0.01 millimeter (Starrett®, Itu, São Paulo, Brazil) (Fig 1). The measurements on digital models were made with the Ortho Analyzer sotware (Fig 2). In order to evalu-ate the accuracy and reliability of the measurements performed by the three examiners, they measured all the parameters on ive pairs of models randomly se-lected from the sample and measured this subsample again ater 15 days. Ater this calibration process, the examiners started measuring all the models.
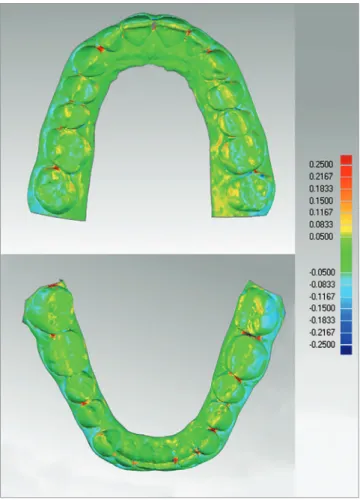
The digital models of both scanners were also com-pared using the superimposition method on Geomag-ic Qualify sotware. The dentition of the two models was aligned using the best-it surface alignment tool of the sotware. Ater alignment, the model edges were trimmed with digital cutting tool, to create coincident borders between the models. Geomagic Qualify sot-ware then calculated the maximum and mean distances (positive and negative diferences) as well as the stan-dard deviation between the “capturing points” of the two digital models. These values are visually displayed with a “color map” which shows the distances between the models in diferent colors. The distance limit used
for preparation of this color map was 0.25 mm (Fig 3). Figure 3 - Superimposition of 3Shape and Xcad models.
Table 2 - Correlation between examiners on plaster models vs. digital models.
PARAMETER
Plaster model n = 30
3Shape model n = 30
Xcad model n = 30 Intraclass
Correlation Coeicient
95% Conidence
Interval
Intraclass Correlation Coeicient
95% Conidence
Interval
Intraclass Correlation Coeicient
95% Conidence
Interval Upper MDD (Mean) 0.891 0.814 - 0.942 0.844 0.737 - 0.915 0.851 0.749 - 0.920
Table 3 - Paired t tests mean differences between examiners on plaster models vs. digital 3Shape models (mm).
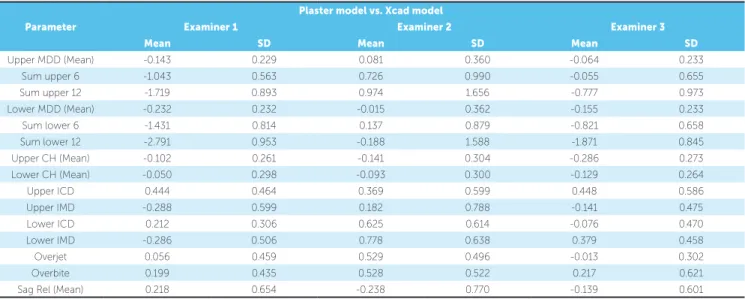
Table 4 - Paired t tests mean differences between examiners on plaster models vs. digital Xcad models (mm).
Plaster model vs. 3Shape model
Parameter Examiner 1 Examiner 2 Examiner 3
Mean SD Mean SD Mean SD
Upper MDD (Mean) -0.064 0.238 0.123 0.326 0.014 0.296
Sum upper 6 -0.570 1.001 1.077 0.769 0.393 1.253
Sum upper 12 -0.851 1.313 1.487 1.505 0.169 2.176
Lower MDD (Mean) -0.149 0.222 0.094 0.321 -0.051 0.255
Sum lower 6 -0.488 0.675 0.888 0.939 -0.144 0.821
Sum lower 12 -1.789 1.054 1.129 1.364 -0.622 1.608
Upper CH (Mean) 0.005 0.299 -0.041 0.257 -0.133 0.274
Lower CH (Mean) 0.063 0.285 -0.047 0.325 -0.029 0.281
Upper ICD 0.275 0.488 0.088 0.577 0.285 0.458
Upper IMD -0.361 0.365 -0.026 0.845 -0.246 0.528
Lower ICD -0.085 0.513 0.337 0.534 -0.107 0.456
Lower IMD -0.469 0.540 0.510 0.833 0.171 0.607
Overjet -0.164 0.412 0.091 0.394 -0.259 0.274
Overbite 0.338 0.287 0.569 0.250 0.287 0.292
Sag Rel (Mean) -0.027 0.637 -0.427 0.783 -0.142 0.658
Plaster model vs. Xcad model
Parameter Examiner 1 Examiner 2 Examiner 3
Mean SD Mean SD Mean SD
Upper MDD (Mean) -0.143 0.229 0.081 0.360 -0.064 0.233
Sum upper 6 -1.043 0.563 0.726 0.990 -0.055 0.655
Sum upper 12 -1.719 0.893 0.974 1.656 -0.777 0.973
Lower MDD (Mean) -0.232 0.232 -0.015 0.362 -0.155 0.233
Sum lower 6 -1.431 0.814 0.137 0.879 -0.821 0.658
Sum lower 12 -2.791 0.953 -0.188 1.588 -1.871 0.845
Upper CH (Mean) -0.102 0.261 -0.141 0.304 -0.286 0.273
Lower CH (Mean) -0.050 0.298 -0.093 0.300 -0.129 0.264
Upper ICD 0.444 0.464 0.369 0.599 0.448 0.586
Upper IMD -0.288 0.599 0.182 0.788 -0.141 0.475
Lower ICD 0.212 0.306 0.625 0.614 -0.076 0.470
Lower IMD -0.286 0.506 0.778 0.638 0.379 0.458
Overjet 0.056 0.459 0.529 0.496 -0.013 0.302
Overbite 0.199 0.435 0.528 0.522 0.217 0.621
Sag Rel (Mean) 0.218 0.654 -0.238 0.770 -0.139 0.601
STATISTICAL ANALYSIS
Statistical analysis of the measurements was performed using the SPSS program, version 20.0 (IBM®, Armonk, NY, USA). The intraclass correlation coeicient (ICC) was used to evaluate the intra and inter-examiner reliabil-ity of measurements for each model type. Paired t test was used to evaluate the intra-examiners accuracy and to com-pare the diference in distances measured on plaster models and digital models. Descriptive statistical analysis was used to show the results of the superimposition of the digital models. P-values < 0.05 were considered to be signiicant.
RESULTS
Table 5 - Paired t tests mean differences between examiners on 3Shape models vs. Xcad models (mm).
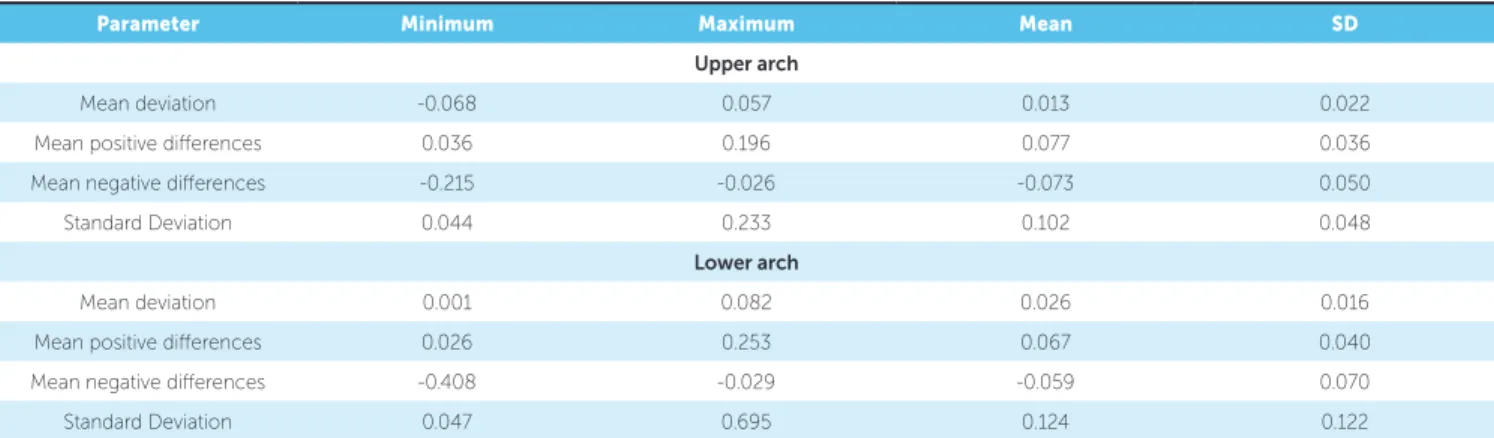
Table 6 - Descriptive analysis of the comparison on 3Shape models vs. Xcad models by superimposition using Geomagic Qualify software (mm). 3Shape model vs. Xcad model
Parameter Examiner 1 Examiner 2 Examiner 3
Mean SD Mean SD Mean SD
Upper MDD (Mean) -0.079 0.259 -0.042 0.368 -0.078 0.338
Sum upper 6 -0.472 0.894 -0.351 1.134 -0.449 1.465
Sum upper 12 -0.868 0.927 -0.513 1.514 -0.946 2.482
Lower MDD (Mean) -0.083 0.257 -0.109 0.344 -0.104 0.268
Sum lower 6 -0.943 0.651 -0.751 0.863 -0.677 1.081
Sum lower 12 -1.002 1.021 -1.317 1.337 -1.248 1.689
Upper CH (Mean) -0.107 0.265 -0.099 0.237 -0.153 0.227
Lower CH (Mean) -0.114 0.299 -0.046 0.275 -0.099 0.201
Upper ICD 0.168 0.432 0.281 0.550 0.162 0.587
Upper IMD 0.072 0.500 0.209 0.554 0.105 0.474
Lower ICD 0.297 0.469 0.288 0.533 0.031 0.416
Lower IMD 0.183 0.328 0.268 0.597 0.208 0.382
Overjet 0.220 0.421 0.438 0.487 0.246 0.254
Overbite -0.139 0.261 -0.041 0.426 -0.070 0.472
Sag Rel (Mean) 0.245 0.571 0.189 0.644 0.002 0.627
Parameter Minimum Maximum Mean SD
Upper arch
Mean deviation -0.068 0.057 0.013 0.022
Mean positive diferences 0.036 0.196 0.077 0.036
Mean negative diferences -0.215 -0.026 -0.073 0.050
Standard Deviation 0.044 0.233 0.102 0.048
Lower arch
Mean deviation 0.001 0.082 0.026 0.016
Mean positive diferences 0.026 0.253 0.067 0.040
Mean negative diferences -0.408 -0.029 -0.059 0.070
Standard Deviation 0.047 0.695 0.124 0.122
difference in measurement error for all measurement parameters on digital models scanned by Xcad scan-ner (Xcad models) was 0.083 mm for examiscan-ner one, 0.099 mm for examiner two, and 0.063 mm for ex-aminer three. According to the ICC, all exex-aminers presented excellent intra-examiners reliability: ex-aminer one showed an mean ICC for all parameters of 0.961 for plaster models, 0.929 for 3Shape models and 0.951 for Xcad models; for examiner two, mean ICC of 0.959 for plaster models, 0.931 for 3Shape models and 0.939 for Xcad models was found; while for examiner three, mean ICC of 0.959 for plas-ter models, 0.966 for 3Shape models and 0.974 for Xcad models was found.
The analysis of the reliability of the measurements performed by the three examiners revealed a high ICC for the measurements on the plaster model, as well as on the digital models. The lowest ICC among examin-ers in plaster models was 0.775. For 3Shape models, the lowest ICC was 0.521, and for Xcad models the low-est ICC was 0.726. Of the 62 measurements on plaster models, the ICC of 55 measurements was larger than 0.850, while the ICC for 50 of the 62 measurements in 3Shape models and the ICC of 48 of the measurements on the Xcad models, was larger than 0.850 (Table 2).
between the plaster and digital models were found in some of the measurements (Tables 3 and 4). Paired t test showed less clinically relevant diferences on the mea-sured values between the two digital models (Table 5).
The superimposition of the digital models was used to evaluate the mean distances and the standard deviations between the models. The outcome of the descriptive statistical analysis of the differences be-tween the superimposition of the two digital models is shown in Table 6.
DISCUSSION
This study evaluated the accuracy and reliability of measurements on two digital models made with two different plaster model scanners, compared to measurements on plaster models. The differences between digital models created by the two different scanners were also evaluated by models superimposi-tion. It can be concluded that measurements on plas-ter models or digital models are associated with some degree of inaccuracy. Accuracy is presented as the difference in measurements of an object (a “gold stan-dard”) with known dimensions, but it should be no-ticed that since these plaster models are a copy of the real dentition, they could present some inaccuracy. The reliability of the scanned plaster model depends on the repeatability and reproducibility of the mea-surements used.15,22 As reported in other studies,1,7,8 the location of the selected reference points for mea-surements may vary among the examiners, regardless of the method used. This problem of measurement point identification directly affects the reliability of the measurements. To compare the reliability of the measurements among the examiners, the ICC was used. In this study, the reliability of the measure-ments was considered excellent for plaster models (mean r = 0.919), for 3Shape models (mean r = 0.900) and for Xcad models (mean r = 0.906) (Table 2). These results show that, due to the training and cali-bration of examiners before the start of this research, specified distances could be accurately measured with both calipers and digital measuring software, on re-spectively plaster models and digital models.
For the orthodontic measurements used in this study, statistically significant differences are not very important; only clinically relevant differences in measurements do really matter. In this study, it
was decided to use the same values for clinically rel-evant differences (cut-offs) as reported in the litera-ture.12,13,23 Mean differences in measurements for the overjet, overbite, tooth size and tooth height greater than 0.3 mm, and for transverse and sagittal distances greater than 0.4 mm were considered to be clinically relevant. Although according to the paired t test re-sults, the difference between several measurements was statistically significant, the difference between most of the parameters was not considered clinically relevant (Tables 3, 4 and 5).
The differences on measurements of 8 of the 62 measures were considered clinically relevant for the 3Shape models. For the Xcad models, 19 of the 62 measures were considered clinically relevant. This outcome suggests that the digital models made with the 3Shape scanner could be more accurate. The highest mean difference in measurements was 0.92 mm on the 3Shape models and 0.77 mm on the Xcad models, excluding the sum of dental diameters parameters. These data demonstrate a relatively high accuracy and reliability of the dimensions for both digital models. These findings are in concordance with other studies.6-12,16-18
Examiners one and three found in general, high-er values for measurements on digital models, com-pared to the same measurements on plaster models (Tables 3 and 4), which is in accordance with the results of some studies.9,12 On the other hand, ex-aminer two found lower values in the measurements on digital models, compared to measurements on plaster models (Tables 3 and 4). This outcome is in concordance with the measurement differences published by Watanabe-Kanno et al.11
For the measurements of overbite on plaster mod-els and digital modmod-els, relatively large diferences were found. Mean diferences for the overbite measure-ment on the 3Shape models presented clinically relevant diferences for two examiners. For one examiner the overbite measurements presented clinically relevant ferent on the Xcad models (0.52 mm). The largest dif-ference in overbite measurements found in this study was 0.56 mm (Tables 3 and 4). These indings are simi-lar to the results published by Santoro et al18 and Boot-vong et al.16 These results could show that the overbite measurement between the models is actually diferent, but it can also be possible that a diference in measure-ment method leads to diferent values of the overbite. On the other hand, the diferences in overbite measure-ments between the two digital models were not clini-cally relevant (Table 5). For calipers both the angle and the thickness of the tip of the calipers may have contrib-uted to some inaccuracies in the overbite measurement on plaster models.18 For digital models, it is possible to magnify and section the image (clipping of the model).
This feature combined with the small reference cursor used for measurement on digital models, facilitates ac-curacy in measurement point identiication compared to the measurement procedure with calipers on plas-ter models (Fig 4). Regarding the sagittal inplas-terarch re-lationship, two measurements for 3Shape models and two measurements for Xcad models showed clinically relevant diferences, as compared to the measurements on plaster models. The largest diference in sagittal re-lationship was found in the 3Shape models measured by examiner two (Tables 3 and 4). The diferences in the sagittal interarch relationship measurements be-tween the 3Shape model and Xcad model were small (Table 5). These results indicate that for the studied digital models, a clinically acceptable interarch accuracy and reliability can be expected, compared to the sagittal relationship found for the plaster models.
subjective interpretation in locating the reference points. It is important to diferentiate between statistically dif-ferent measurements and clinically relevant diferences, is order to evaluate if diferences in the measurements found on plaster or digital models can really afect the orthodontic diagnosis and treatment planning. It also indicates if the appliances created with computer-aided design/computer-aided manufacturing (CAD/CAM) over the digital dental models will be suiciently accu-rate to be used for orthodontic treatment.
The alternative comparison method of models super-imposition can be efectively used for digital models20,24 and this method can also be used to visualize and quantify tooth movement during orthodontic treatment.25 There are several sotware which can be used for this superim-position method. In this study, it was used the Geomagic Qualify sotware. This superimposition method showed that the diferences between the surfaces of the two digital models were insigniicant (Table 6). Blue and red surfaces on the color maps indicate areas with diference bigger than 0.25 mm between the superimposed models. Diferences over 0.25 mm were mainly localized on less relevant locations, such as interdental spaces, surface areas that were not smoothed with the sotware in Xcad mod-els and on the base of the model.
Compared to the distance measurement tech-nique, the superimposition technique as used in this study, is an accurate and reliable method. This
super-imposition method is easy and fast and misinterpreta-tions caused by measurements of different examiners can be avoided as the superimposition method and analysis are made by computer software. Continued research to test the accuracy and reliability of digital models made by indirect methods such as scanning dental models, impressions and direct methods using intraoral scanners and 3D radiographs, is needed as the use of these digital models for diagnosis, treat-ment planning, restoration and custom appliance fab-rication in Dentistry will increase.
CONCLUSIONS
Digital models from scanned plaster models us-ing the R700 or Xcad scanners were considered clinically accurate according to the two methods of comparison used. Both measurement and superim-position methods to compare the digital models can be efficiently used to evaluate the accuracy and reli-ability of digital dental models.
Acknowledgments
1. Abizadeh N, Moles DR, O’Neill J, Noar JH. Digital versus plaster study models: how accurate and reproducible are they? J Orthod. 2012 Sept;39(3):151-9. 2. de Waard O, Rangel FA, Fudalej PS, Bronkhorst EM, Kuijpers-Jagtman AM,
Breuning KH. Reproducibility and accuracy of linear measurements on dental models derived from cone-beam computed tomography compared with digital dental casts. Am J Orthod Dentofacial Orthop. 2014 Sept;146(3):328-36. 3. Shastry S, Park JH. Evaluation of the use of digital study models in postgraduate
orthodontic programs in the United States and Canada. Angle Orthod. 2014 Jan;84(1):62-7.
4. Touchstone A, Nieting T, Ulmer N. Digital transition: the collaboration between dentists and laboratory technicians on CAD/CAM restorations. J Am Dent Assoc. 2010 June;141 Suppl 2:15S-9S.
5. Grünheid T, Patel N, De Felippe NL, Wey A, Gaillard PR, Larson BE. Accuracy, reproducibility, and time eiciency of dental measurements using diferent technologies. Am J Orthod Dentofacial Orthop. 2014 Feb;145(2):157-64. 6. Asquith J, Gillgrass T, Mossey P. Three-dimensional imaging of orthodontic
models: a pilot study. Eur J Orthod. 2007 Oct;29(5):517-22.
7. Stevens DR, Flores-Mir C, Nebbe B, Raboud DW, Heo G, Major PW. Validity, reliability, and reproducibility of plaster vs digital study models: comparison of peer assessment rating and Bolton analysis and their constituent measurements. Am J Orthod Dentofacial Orthop. 2006 June;129(6):794-803.
8. Mullen SR, Martin CA, Ngan P, Gladwin M. Accuracy of space analysis with emodels and plaster models. Am J Orthod Dentofacial Orthop. 2007 Sept;132(3):346-52.
9. Goonewardene RW, Goonewardene MS, Razza JM, Murray K. Accuracy and validity of space analysis and irregularity index measurements using digital models. Aust Orthod J. 2008 Nov;24(2):83-90.
10. Sousa MV, Vasconcelos EC, Janson G, Garib D, Pinzan A. Accuracy and reproducibility of 3-dimensional digital model measurements. Am J Orthod Dentofacial Orthop. 2012 Aug;142(2):269-73.
11. Watanabe-Kanno GA, Abrão J, Miasiro Junior H, Sánchez-Ayala A, Lagravère MO. Reproducibility, reliability and validity of measurements obtained from Cecile3 digital models. Braz Oral Res. 2009 July-Sept;23(3):288-95.
12. Naidu D, Freer TJ. Validity, reliability, and reproducibility of the iOC intraoral scanner: a comparison of tooth widths and Bolton ratios. Am J Orthod Dentofacial Orthop. 2013 Aug;144(2):304-10.
13. Keating AP, Knox J, Bibb R, Zhurov AI. A comparison of plaster, digital and reconstructed study model accuracy. J Orthod. 2008 Sept;35(3):191-201; discussion 175.
REFERENCES
14. Kim J, Heo G, Lagravère MO. Accuracy of laser-scanned models compared to plaster models and cone-beam computed tomography. Angle Orthod. 2014 May;84(3):443-50.
15. Veenema AC, Katsaros C, Boxum SC, Bronkhorst EM, Kuijpers-Jagtman AM. Index of Complexity, Outcome and Need scored on plaster and digital models. Eur J Orthod. 2009 June;31(3):281-6.
16. Bootvong K, Liu Z, McGrath C, Hagg U, Wong RW, Bendeus M, et al. Virtual model analysis as an alternative approach to plaster model analysis: reliability and validity. Eur J Orthod. 2010 Oct;32(5):589-95.
17. Tomassetti JJ, Taloumis LJ, Denny JM, Fischer JR Jr. A comparison of 3 computerized Bolton tooth-size analyses with a commonly used method. Angle Orthod. 2001 Oct;71(5):351-7.
18. Santoro M, Galkin S, Teredesai M, Nicolay OF, Cangialosi TJ. Comparison of measurements made on digital and plaster models. Am J Orthod Dentofacial Orthop. 2003 July;124(1):101-5.
19. Cuperus AM, Harms MC, Rangel FA, Bronkhorst EM, Schols JG, Breuning KH. Dental models made with an intraoral scanner: a validation study. Am J Orthod Dentofacial Orthop. 2012 Sept;142(3):308-13.
20. Flugge TV, Schlager S, Nelson K, Nahles S, Metzger MC. Precision of intraoral digital dental impressions with iTero and extraoral digitization with the iTero and a model scanner. Am J Orthod Dentofacial Orthop. 2013 Sept;144(3):471-8. 21. Pandis N. Sample calculations for comparison of 2 means. Am J Orthod
Dentofacial Orthop. 2012 Apr;141(4):519-21.
22. Dowling AH, Burns A, Macauley D, Garvey TM, Fleming GJ. Can the intra-examiner variability of Little’s Irregularity Index be improved using 3D digital models of study casts? J Dent. 2013 Dec;41(12):1271-80.
23. Fleming PS, Marinho V, Johal A. Orthodontic measurements on digital study models compared with plaster models: a systematic review. Orthod Craniofac Res. 2011 Feb;14(1):1-16.
24. Grunheid T, McCarthy SD, Larson BE. Clinical use of a direct chairside oral scanner: an assessment of accuracy, time, and patient acceptance. Am J Orthod Dentofacial Orthop. 2014 Nov;146(5):673-82.