Horizontal Gene Transfer of the Integrative and
Conjugative Element ICE
clc
in
Pseudomonas knackmussii
B13
Nicolas Pradervand, Sandra Sulser, Franc¸ois Delavat, Ryo Miyazaki¤, Iker Lamas,
Jan Roelof van der Meer*
Department of Fundamental Microbiology, University of Lausanne, Lausanne, Switzerland
Abstract
The integrative and conjugative element ICEclcis a mobile genetic element in Pseudomonas knackmussii B13, and an experimental model for a widely distributed group of elements inProteobacteria. ICEclcis transferred from specialized transfer competent cells, which arise at a frequency of 3-5% in a population at stationary phase. Very little is known about the different factors that control the transfer frequency of this ICE family. Here we report the discovery of a three-gene operon encoded by ICEclc, which exerts global control on transfer initiation. The operon consists of three consecutive regulatory genes, encoding a TetR-type repressor MfsR, a MarR-type regulator and a LysR-type activator TciR. We show that MfsR autoregulates expression of the operon, whereas TciR is a global activator of ICEclcgene expression, but no clear role was yet found for MarR. Deletion of mfsR increases expression of tciR and marR, causing the proportion of transfer competent cells to reach almost 100% and transfer frequencies to approach 1 per donor.mfsRdeletion also caused a two orders of magnitude loss in population viability, individual cell growth arrest and loss of ICEclc. This indicates that autoregulation is an important feature maintaining ICE transfer but avoiding fitness loss. Bioinformatic analysis showed that themfsR-marR-tciRoperon is unique for ICEclcand a few highly related ICE, whereastciRorthologues occur more widely in a large variety of suspected ICE amongProteobacteria.
Citation:Pradervand N, Sulser S, Delavat F, Miyazaki R, Lamas I, et al. (2014) An Operon of Three Transcriptional Regulators Controls Horizontal Gene Transfer of the Integrative and Conjugative Element ICEclcinPseudomonas knackmussiiB13. PLoS Genet 10(6): e1004441. doi:10.1371/journal.pgen.1004441
Editor:Josep Casadesu´s, Universidad de Sevilla, Spain
ReceivedFebruary 12, 2014;AcceptedApril 30, 2014;PublishedJune 19, 2014
Copyright:ß2014 Pradervand et al. This is an open-access article distributed under the terms of the Creative Commons Attribution License, which permits unrestricted use, distribution, and reproduction in any medium, provided the original author and source are credited.
Funding:This work was supported by grants 3100A0-108199 and 31003A_124711 from the Swiss National Science Foundation. The funders had no role in study design, data collection and analysis, decision to publish, or preparation of the manuscript.
Competing Interests:The authors have declared that no competing interests exist. * Email: [email protected]
¤ Current address: Bioproduction Research Institute, National Institute of Advanced Industrial Science and Technology, Tsukuba, Ibaraki, Japan
Introduction
Comparisons between ever-increasing numbers of sequenced genomes reveal the large extent to which prokaryotic genomes have undergone horizontal gene transfer (HGT) [1-5]. HGT has traditionally been viewed as the consequence of natural transfor-mation, or of the action of mobile elements such as conjugative plasmids and phages [6,7]. During the last decade, however, other types of mobile genetic elements such as integrative and conjugative elements (ICEs) have been recognized, which are widespread and thus may significantly contribute to HGT [8-13]. In contrast to phages and plasmids, however, we still know little about the life styles of the diverse ICE types, their modes of self-transfer and regulatory pathways controlling self-transfer. Like temperate phages, ICEs mostly exist in an integrated form at one or more specific sites in the host’s chromosome (often in genes for tRNA), and are vertically transmitted to daughter cells by chromosome replication and segregation [8,10,14]. In order to transfer horizon-tally, ICEs excise themselves by site-specific recombination (attLand
attR, Figure 1). This produces a circular double-stranded DNA molecule, which can transfer by conjugation to a new recipient cell,
where it can reintegrate [14]. Autonomous plasmid-like replication of the excised form may occur [15-17], but is not required for the transfer itself.
The regulatory mechanisms that control the switch from integrated to excised state vary widely among different ICE types insofar as this has been studied. In several ICEs, this switch is the consequence of a cascade of a variety of regulatory factors, such as PhrI/RapI and ImmR/ImmA in ICEBs1 [18], SetR/SetCD in ICESXT [19,20], KorSA/Pra in pSAM2 [21-23] or QseM/TraR in ICEMlSymR7 [24,25]. Most wild-type ICEs transfer at low frequencies (i.e., less than 1 per 103donors), suggesting that the regulatory cascades keep extremely tight control and allow only a small subset of cells in a population to follow the path of ICE excision and transfer, but the need for such tight control is a priori unclear. This bistability is most pronounced and well-studied for a model ICE named ICEclcin
but can excise itself by the action of the IntB13 integrase encoded on the element (Figure 1A). Expression ofintB13in the integrated form is under control of the promoter Pint, which by single cell reporter gene analysis was shown to become active only in 3-5% of a bacterial population during stationary phase [26]. Direct single cell visualization further confirmed that only cells which express reporter gene fused to Pintabove a threshold are capable of transferring ICEclc to new recipients, a bistable state which we recently named ‘‘transfer competence’’ (tc) [30]. Irrespective of the success of ICEclc transfer, tc cells can only divide a few times once they re-enter exponential phase before they arrest growth. We recently showed that this is due to the expression of the ICEclc genes shiand parA[30]. Expression of
intB13is dependent on a variety of factors, most notably a gene named inrR (Figure 1A), which itself is also bistably expressed [26]. Both inrR and intB13 expression are dependent on the abundance of the stationary phase sigma factor RpoS, with cells having highest RpoS levels being more likely to activate Pintand PinR [29]. RpoS and InrR are important for activating ICEclc excision and transfer, but are not sufficient. Therefore, we hypothesized that additional factors are necessary for the tc state to develop [29].
In this study, we report a locus of three consecutive regulatory genes on ICEclc, which is essential for controlling its transfer. The locus was uncovered by random transposon mutagenesis, and further studied by creation of deletion mutants and complementation. The effect of mutations was studied at the level of ICEclc expression through microarray hybridizations, RT-PCR and reporter gene-based single cell fluorescence microscopy, and further in ICEclc transfer assays. Fitness of mutants compared to wild-type was examined in growth assays and individual cell fates were followed by microscopy. Bioinfor-matics was used to analyze the configuration of the ICEclc
regulatory locus within this ICE family, and to possibly reconstruct the steps that may have led to selection of the specific regulatory control mechanism of ICEclc. The results of our study help to explain why a careful balance has to be maintained between ICE transfer frequency and fitness loss.
Results
Discovery of an ICEclctransfer control locus by transposon mutagenesis
In order to discover ICEclc-located factors involved in its self-transfer, a library ofP. knackmussiiB13 mutants was generated by using random Tn5mutagenesis [31]. Next, we recovered ICEclc Figure 1. Schematic overview of ICEclcand the location of the genes relevant to this study.(A) ICEclcintegrated form with the two flanking 18-bp repeats (as black rectangles,attRandattL). Previously determined gene regions are placed at their approximate location. Important functional regions are depicted as grey boxes accompanied by legends.+or -, indicate the orientation of the coding strand for the respective gene(s) (the+strand being the one ofintB13).clcgenes,
chlorocatechol degradation;amngenes, 2-aminophenol degradation.
kb, kilo-basepairs. (B) Detail of themfsRoperon. Arrows, predicted open reading frames (the right-to-left orientation indicates the minus strand). Triangles, positions of the Tn5-mediated kanamycin gene insertions (nucleotide positions indicated below, according to the AJ617740.2 numbering). Regions deleted in this study are displayed as white bars with the names of the mutations noted below. The hooked arrow indicates repression by themfsRgene product on the PmfsRpromoter.
(C) Detail of the fragments inserted by mini-Tn7 delivery for
complementation of mfsR and tciR deletions. (D) BlastP-predicted
domains for each of the three regulatory genes in themfsRoperon. C and N, carboxy and amino terminus, respectively.
doi:10.1371/journal.pgen.1004441.g001
Author Summary
elements with Km-insertions by conjugating the pool of B13 mutantsen massetoPseudomonas putidaUWC1 and selecting for Km-resistantP. putida(Figure S1). We hypothesized that mutant ICEclc
with insertions in genes implicated in self-transfer could still be transferred to UWC1, when the second copy of ICEclcin the same B13 donor cell is intact and complements transfer of the mutant copy. A total of 1920 Km-resistantP. putida transconjugants was recovered and subsequently conjugated each individually with a second P. putidarecipient, resistant to nalidixic acid (Figure S1). For those conjugations in which no Km- and nalidixic acid-resistant transconjugant growth was detected, the correspondingP. putida donor was recovered and the location of the KmR-gene insertion on ICEclc was mapped. A total of 18 clones was recovered, which had insertions in an ICEclcopen reading frame numberedorf18502, that we renamed mfsR(Figure 1B). Surpris-ingly, apart from one donor with an insertion inintB13, no other mutants with impaired ICEclc transfer were found in this screening. The KmR-gene had been inserted in four different positions in mfsR, at ICEclc nucleotide positions 19033, 18758, 18730 and 18618 (Figure 1B, accession number: AJ617440.2). This suggests that transposon insertions in strain B13 were sufficiently frequent to cover all genes, but that the selection procedure was biased for the recovery of themfsRinsertion, which may have been due to the function ofmfsRas regulator in ICEclc
transfer (see below). Alternatively, it is possible that insertions in ICEclc genes needed for transfer might not be efficiently complemented by the second ICEclc copy and would thus be underrepresented in the P. putida library. Frequencies of ICEclc
transfer of the strainsP. putidaUWC1-2961 (KmR-gene insertion at 19033) and UWC1-2962 (insertion at 18618) in a filter-based conjugation assay were 103-fold and 102-fold lower than of aP. putida with one integrated wild-type ICEclc copy, respectively (Figure 2A).
mfsRis part of an operon formed by three consecutive transcriptional regulators
Closer inspection indicated mfsRto be the first open reading frame in a series of three consecutive transcriptional regulators, previously designated as orf18502, orf17984 and orf17162
(Figure 1B).mfsRencodes a TetR-like regulator harboring helix-turn-helix motifs TetR_N and TetR_C_7 (pfam0040 and pfam14246, respectively, see Figure 1D). The orf17984 gene overlaps with the end of themfsRopen reading frame by 4 bp and encodes a putative regulator of the MarR family (smart00347 HTH_MARR motif). The last gene of this cluster starts 24 bp downstream of the stop codon oforf17984and is predicted to code for a LysR-type transcriptional regulator, harboring an N-terminal HTH_1 motif (pfam00126) and a C-terminal substrate-binding domain (PBP2_LTTR_aromatics_like; cd08414). The gene
orf17162was renamedtciR(transfer competence inducer regulator) in anticipation of the results described further below. Reverse transcription of P. putida UWC1 (ICEclc) RNA isolated from exponential phase-grown cells, followed by specific PCR ampli-fication confirmed that the three genes are transcribed on the same mRNA, which ends downstream oftciR(Figure S2). This implies thatmfsR-marR-tciRform a single polycistronic unit.
Effects oftciR, marR, andmfsRdeletions on ICEclctransfer In order to more precisely investigate the role of the three regulators on ICEclctransfer, their open reading frames were each individually and partially deleted in separate strains, namely P. putidaUWC1 (ICEclc-DmfsR, strain 4322), UWC1 (ICEclc-DmarR, strain 4372), UWC1 (ICEclc-DmfsR-D’marR, strain 3453) and P. putida UWC1 (ICEclc-DtciR, strain 4321) (Figure 1B, Table 1).
ICEclctransfer frequencies in plate-mating assays with a gentami-cin-resistantP. putidaUWC1 as recipient were 2?103-fold lower for UWC1 donors with ICEclc having an internal deletion in tciR
compared to intact ICEclc(Figure 2B). Complementation of the ICEclc-DtciR mutation with a single copy mini-Tn7 transposed fragment containing the tciR gene under the PmfsR-promoter (strain 4649, Figure 1C) restored transfer, even to much higher levels than wild-type ICEclc(Figure 2B).
ICEclc transfer frequencies were 27-fold lower for UWC1 donors with ICEclchaving an internal deletion inmarRcompared Figure 2. ICEclc transfer frequencies from P. putida UWC1 donors with different ICEclcgenotypes.(A) and (B), Independently carried out transfer experiments using the indicated strain sets. Bars show mean transfer frequencies as transconjugant colony forming units (CFU/ml, growing on 3CBA, Km- or Gm-resistant) per donor CFU/ml from biological triplicates, and the corresponding standard deviations. Letters above bars indicate statistically significantly different groups per panel in an Anova with post hoc Tukey-Kramer test (P,0.001), with the same letter pointing to the absence of statistically significant differences.
to intact ICEclc (Figure 2B). Complementation of the ICEclc
-DmarR mutation with a similar single copy mini-Tn7-marR
insertion did not change transfer rates (strain 4804, Figure 2B). This suggests that the effect of themarRdeletion on ICEclctransfer is rather due to polar disturbance of the expression of the downstream-locatedtciR.
In contrast, ICEclc elements with mfsR deletions [i.e., P. putidaUWC1 (ICEclc-DmfsR) and UWC1 (ICEclc-DmfsR-D’marR)]
transferred with 25- and 15-fold higher frequencies than wild type ICEclc, respectively (Figure 2A, B). Complementation of the ICEclc-DmfsRmutation with a single copy mini-transposed mfsR
gene under control of its own promoter reduced ICEclc-DmfsR
transfer frequencies by 104-fold, also here much stronger than predicted from wild-type ICEclc itself (Figure 2B). These results suggested thattciR is the actual regulator of ICEclctransfer, and further that mfsR is regulating expression of the mfsR-marR-tciR
Table 1.Strains used in this study and their specifications.
Strain name
Strain collection
number Relevant characteristics
Reference or source
Escherichia coliDH5a [36]
E. coliDH5a lpir V. de Lorenzo
E. coliBW20767/pRL27 1853 tra+, pRL27 containing hyperactive mini-Tn5element (oriV, KmR). [31]
Pseudomonas knackmussiiB13 78 Original host of ICEclc(2 identical copies). [43]
Pseudomonas putidaUWC1 1291 plasmid-free derivative ofP. putidaKT2440, RifR [44]
P. putidaUWC1 (Nal) Spontaneous NalR-mutant of 1291. This study
P. putidaUWCGC 2744 Single copy mini-Tn7-Ptac-echerryinsertion, GmR [33]
P. putidaUWC1 2756 Single copy mini-Tn5-jimX-gfpinsertion, KmR [45]
P. putidaUWC1 (ICEclc) 2737 Derivative of strain 1291 with one ICEclccopy integrated intotRNAgly-5. [45]
P. putidaUWC1 (ICEclc) 2738 As 2737, but integrated intotRNAgly-6. [45]
P. putidaUWC1 (ICEclc-KmR19033) 2961 Transposon mutant of strain 2737 with a KmR-gene inserted at
nucleotide position 19033 in ICEclc.
This study
P. putidaUWC1 (ICEclc-KmR
18618) 2962 Transposon mutant of strain 2737 with a KmR-gene inserted at
nucleotide position 18618 in ICEclc.
This study
P. putidaUWC1 (ICEclc-DmfsR-D’marR) 3453 Derivative of strain 2737 withmfsRand part ofmarRdeleted (from nucleotide position 18395 to 19166).
This study
P. putidaUWC1 (ICEclc)
+Pint-gfp/PinR-echerry
3531, 3532, 3533 Derivatives of strain 2737 with single copy random insertion of a mini-Tn-Pint-gfp/PinR-echerry, KmR
This study
P. putidaUWC1 (ICEclc-DtciR) 4321 Derivative of strain 2737 with an internal deletion intciR (from nucleotide position 17164 to 17985).
This study
P. putidaUWC1 (ICEclc-DmfsR) 4322 Derivative of strain 2737 with an internal deletion inmfsR(from nucleotide position 18581 to 19143).
This study
P. putidaUWC1 (ICEclc-D’marR) 4372 Derivative of strain 2737 with an internal deletion inmarR(from nucleotide position 18032 to 18468).
This study
P. putidaUWC1 (ICEclc-DmfsR)
+Pint-gfp/PinR-echerry
4469, 4470, 4471 Derivatives of strain 4322 with single copy random insertion of a mini-Tn-Pint-gfp/PinR-echerry, KmR
This study
P. putidaUWC1 (ICEclc-DmarR)
+Pint-gfp/PinR-echerry
4475, 4476, 4477 Derivatives of strain 4372 with single copy random insertion of a mini-Tn-Pint-gfp/PinR-echerry, KmR
This study
P. putidaUWC1 (ICEclc-DtciR)
+Pint-gfp/PinR-echerry
4479, 4480, 4481 Derivatives of strain 4321 with single copy random insertion of a mini-Tn-Pint-gfp/PinR-echerry, KmR
This study
P. putidaUWC1 (ICEclc-DmfsR,gfp) 4612 Derivative of 4322 having agfpgene inserted downstream ofintB13. This study
P. putidaUWC1 (ICEclc-DmfsR, mini-Tn7:mfsR)
4646 Derivative of 4322 carrying a single copy mini-Tn7insertion of themfsRgene under its own promoter.
This study
P. putidaUWC1 (ICEclc-DtciR, mini-Tn7:mfsRfs-marRfs-tciR)
4649 Derivative of 4321 carrying a single copy mini-Tn7insertion of the (frameshifted) mfsRandmarRgenes, plus the intacttciRgene under themfsRpromoter.
This study
P. putidaUWC1 (ICEclc-DmarR, mini-Tn7:mfsRfs-marR-tciRfs)
4804 Derivative of 4372 carrying a single copy mini-Tn7insertion of the (frameshifted) mfsRandtciRgenes, plus the intactmarRgene under themfsRpromoter.
This study
P. putidaUWC1 mini-Tn5-PmfsR-mcherry 3482 Single copy insertion of a mini-Tn5 mfsRpromoter-mcherryfusion, KmR This study
P. putidaUWC1 mini-Tn7-mfsR, mini-Tn5-PmfsR-mcherry
4302 Derivative of strain 3482 but with a mini-Tn7insertion containing the intactmfsRgene expressed from its own promoter, KmR, GmR
This study
P. putidaUWC1 (ICEclc), mini-Tn5-PmfsR-mcherry
3497 Derivative of 2737, single copy insertion of a mini-Tn5 mfsRpromoter-mcherry fusion, KmR
This study
P. putidaUWC1 (ICEclc-DmfsR), mini-Tn5-PmfsR-mcherry
3606 Derivative of 3453, single copy insertion of a mini-Tn5 mfsRpromoter-mcherry
fusion, KmR This study
P. putidaUWC1 (ICEclc-DmfsR), mini-Tn7-mfsR, mini-Tn5-PmfsR-mcherry
4282 Derivative of 3606, but with a mini-Tn7insertion containing the intactmfsR gene expressed from its own promoter, KmR, GmR
This study
operon. Since MfsR is expected to be a repressor, its deletion would lead to higher expression of the downstream genes marR
andtciR, which results in increased ICEclctransfer. The effect of the transposon insertions inmfsR(i.e., lower ICEclctransfer rates, Figure 2A) seems therefore due to a polar effect on marR-tciR
expression.
tciRencodes a global activator of the genes in the ICEclc
core region
Next, we examined the effect of regulatory gene deletions on gene expression of ICEclcas a whole, using semi-tiling microarray analyses (Figure 3). WhenP. putidaUWC1 (ICEclc) wild-type cells are growing exponentially on 3-chlorobenzoate (3CBA), expres-sion from the genes in the ICEclccore region (roughly the second half of ICEclc) plus the integraseintB13is silent, whereas they are highly transcribed when cells are in stationary phase (Figure 3A). Among others, the core region encodes genes implicated in ICEclc
conjugative transfer [32,33].P. putidawith mutant ICEclclacking either marR or tciR strongly diminished expression in the core region and of the integrase gene in stationary phase when compared to wild type (Figure 3C, Figure S3). Lower core and integrase gene expression explains the lower ICEclctransfer rates
from these mutants (Figure 2B). In contrast,mfsRdeletion resulted in much higher expression from the ICEclc core genes in exponentially growing cells (Figure 3B), and even slightly higher expression in stationary phase than in wild-type ICEclc(Figure S4), which explains the 10- to 100-fold ICEclc higher transfer rates (Figure 2B). Expression of themfsR-marR-tciRcluster itself was the same in thetciRandmarRdeletion mutants, and no different to the wild-type (Figure 4A, C, E). In contrast, expression of the mfsR-marR-tciRcluster was higher in themfsRdeletion mutants than in wild-type, both in exponential and stationary phase cells (Figure 4B, D). Since gene expression from ICEclc is similar in mutants lackingmfsRalone ormfsRplus the first 117 bp ofmarR
(Figure S4), we conclude that it is the LysR-type regulator encoded by tciR, which is the main activator for ICEclc core gene expression.
Microarray analysis also helped to understand the behaviour of themfsRKm-insertion mutant (Figure 3D). As for thetciRdeletion mutant, expression of the ICEclccore region and of the integrase was dramatically lower than wild-type in stationary phase cells (Figure 3D, Figure S4). On the other hand, bothmfsRdeletion and
mfsR Km-insertion mutants showed increased expression of a group of genes on ICEclc coding for a putative efflux system
Figure 3. Differential expression of the ICEclcgene region from micro-array data in selected mutant ICEclcversus wild type inP. putidaUWC1.(A) Differential expression of the ICEclcregion between stationary and exponential phase cells of wild typeP. putidaUWC1 (ICEclc). (B) Differential expression of the ICEclcregion between themfsRdeletion mutant and wild-type, in exponentially growing cells. (C) Comparison of the
tciRdeletion mutant and wild-type, in stationary phase cells. (D) Comparison of themfsRtransposon insertion mutant versus wild-type, in stationary phase cells. Dots indicate the2log-fold change of hybridization signal per microarray probe in the comparison, plotted at their distance along the ICEclcsequence (X-axis; in kb). Regions of interest on ICEclcare redrawn as grey boxes at the bottom of each section (+or - indicate the DNA strand
on which the region is encoded). Separate displays indicate expression differences on the plus- (open symbols) or the minus-strand (closed symbols). Grey bars in the background indicate the two-fold cut-off level. For a complete set of microarray results, see Figures S3 and S4.
(Figure 3B, D). Detailed inspection ofmfsR-marR-tciRexpression in the Km-insertion mutant revealed that the first 160 bp of mfsR, upstream of the KmR-gene insertion were higher expressed than in wild-type cells (Figure 4F). In contrast, the downstream genesmarR
andtciRwere lower expressed compared to wild-type and to the
mfsRdeletion mutant (Figure 4B, D, F). This confirmed, therefore, that insertion of the KmR-gene had caused a polar effect on expression of marR and tciR, which explains the strongly diminished expression of the ICEclccore genes in stationary phase in themfsRKm-insertion mutant, and decreased ICEclctransfer.
Inserting the presumed mfsR promoter region upstream of a promoterlessmcherrygene in single copy on the chromosome ofP.
putidaUWC1 without ICEclc produced strong and homogenous mCherry expression among all cells (Figure 5A, strain 3482). Inserting into this strain a single copymfsRgene expressed from its own promoter abolished mCherry expression (Figure 5A, strain 4302). Expression of mCherry from PmfsR in P. putida UWC1 (ICEclc) was very low, whereas disruption ofmfsRon ICEclcagain resulted in high mCherry expression (Figure 5A, strain 3606). Complementation of this strain by a single copymfsRgene under its own promoter caused repression of mCherry expression (Figure 5A). All these data are consistent with the hypothesis that MfsR is repressing expression of itself and the downstream located
marRandtciRgenes.
Figure 4. Detailed view on the differential expression of themfsRoperon inP. putidaICEclcwild-type or mutants.(A)MarRdeletion mutant versus wild-type. (B)mfsRdeletion mutant versus wild type. (C)tciRdeletion mutant versus wild-type. (D)mfsR-’marRdeletion mutant versus wild-type. (E)marRversustciRdeletions. (F)mfsR-transposon insertion mutant versus wild-type. Panels show2log-fold change of expression level per microarray probe in this region of ICEclcfor exponential (dark dots) and stationary phase cells (white dots). Genetic map of the region drawn at the bottom of each section for clarity. Arrows represent genes, deleted regions are indicated by stippled bars and corresponding probes are within brackets.
mfsRdeletion leads to an increase in the number of cells activating ICEclc
We then tested whether changed ICEclctransfer rates and core gene expression were in fact due to changes in the proportion of cells activating ICEclc. Hereto, a double promoter-reporter construct, carrying Pint-gfpand PinR-echerrywas inserted in single copy on the chromosomes of P. putidaUWC1 (ICEclc),P. putida
UWC1 (ICEclc-DmfsR), P. putida UWC1 (ICEclc-D’marR) and P. putida UWC1 (ICEclc-DtciR) (Table 1). Pint and PinR are the respective promoters for the integrase gene intB13 (integrated form) and the integrase activator gene inrR. Previous studies showed that both promoters are active only in a small subpopulation of cells, which are representative for transfer competent cells [26,29,30]. Consistent with previous data, the subpopulation of P. putida UWC1 (ICEclc) wild-type cells expressing Pint and PinR in stationary phase suspended cultures represented a few percent (Figure 5B). In contrast, deletion inmfsR
resulted in 80-100% of cells expressing Pint- and PinR-promoters
(Figure 5B). Expression of both promoters in P. putida UWC1 (ICEclc-DmfsR) occurred in early stationary phase whereas in wild-type cells their expression is maximal in late stationary phase (Figure 5B). Conversely, P. putida UWC1 (ICEclc-DtciR) and P. putidaUWC1 (ICEclc-DmarR) did not produce any detectable Pint -or PinR-expressing cells, neither in exponential nor in stationary phase (Figure 5B). Considering a detection limit by microscopy of ,1 fluorescent cell among 1000-10,000 non fluorescent cells, the absence of detectable Pint- or PinR-expressing cells in those mutants would be in accordance with absence of ICEclc core gene activation on microarrays (Figure 3D) and lower transfer frequencies (Figure 2B).
Mutants withmfsRdeletion in ICEclcface a strong fitness cost
Given thatP. putidaUWC1 carrying ICEclc-DmfsRtransferred at a much higher rate than wild-type ICEclc, and also expressed both Pint- and PinR- promoters in almost all cells, we wondered why Figure 5. Effect of mutations in themfsRregion on the expression of the PmfsR-, Pint- and PinR-promoters of ICEclcinP. putidaUWC1.
(A) mCherry expression from themfsRpromoter added in single copy to the chromosome of the indicatedP. putidaUWC1 strains (relevant genotypes and strain numbers specified below the graph). mCherry expression measured on individual cells (n = 1000) by epifluorescence microscopy in late exponential phase of cultures grown on 10 mM succinate and expressed as box plots (AU, arbitrary units at 20 ms exposure time). (B) Scatter plot of GFP and mcherry fluorescence in single cells ofP. putidaUWC1 (ICEclc) wild-type,DmfsR,DtciRorDmarRdeletions, equipped with a single copy mini-transposon containing the Pint-egfpand PinR-mcherryfusions. Panels show expression of both markers at different growth phases, as indicated, with colors representing genotypes with independent mini-Tn5insertions. Note as example the subpopulation of wild-type cells (dotted ellips) expressing both reporters, compared to the majority of cells in themfsRdeletion mutant but a complete absence of such subpopulation in thetciRandmarR
deletion mutants.
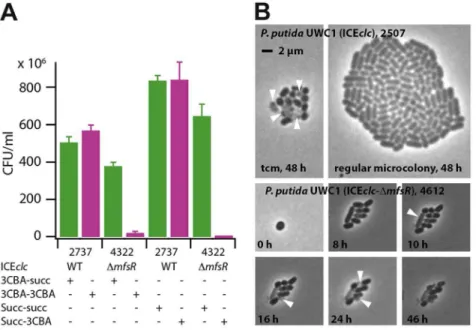
such mutants did not become selected spontaneously. Both P. putida UWC1 (ICEclc) wild-type and (ICEclc-DmfsR) displayed statistically indistinguishable generation times during exponential growth on minimal medium with either 3CBA or succinate as carbon source (Table 2), althoughP. putidaUWC1 (ICEclc-DmfsR) went through a longer lag phase (Figure S5A). In contrast, the proportion of colony forming units (CFU) in samples taken from stationary phase cultures on 3CBA or succinate and plated on 3CBA solid medium was dramatically reduced forP. putidaUWC1 (ICEclc-DmfsR) (Figure 6). Whereas the number of colonies formed on 3CBA plates was the same as that on succinate for P. putida
UWC1 (ICEclc), only 0.3-5.6% appeared on 3CBA plates for UWC1 (ICEclc-DmfsR) (Table 2). Also in absolute terms, the number of CFU/ml for UWC1 (ICEclc-DmfsR) cells taken from stationary phase cultures both on 3CBA and succinate was lower than that for UWC1 (ICEclc) (Figure 6). Moreover, 8 of 10 tested
colonies of UWC1 (ICEclc-DmfsR) grown on MM plates with succinate did no longer amplify the clcA gene of ICEclc (not shown), the remaining two still being able to grow on 3CBA. Furthermore, half or more of microcolonies formed from UWC1 (ICEclc-DmfsR) with a single copy Pint-egfp insertion showed incidence of malformations and cell lysis, similar to what was reported previously for nutrient-reactivated tc cells [30] (Figure 6B), but cells in the other microcolonies divided with generation times even slightly faster (1.4960.15 h) than those in microcolonies of P. putida UWC1 (ICEclc, 1.7960.09 h). This indicates that themfsRdeletion in ICEclcimposes a strong fitness cost onP. putidaUWC1. Survival of UWC1 was restored to wild-type level when the ICEclc-DmfsRwas complemented by the mini-Tn7insertedmfsRgene (Figure S6). In contrast, neitherP. putida
UWC1 (ICEclc) with marR or tciR deletion, nor the mini-Tn7
complemented strains of P. putida UWC1 (ICEclc-DtciR) and
Figure 6. Fitness loss ofP. putidaUWC1 (ICEclc) caused by themfsRdeletion.(A) Survival ofP. putidaUWC1 (ICEclc, 2737) andP. putida
UWC1 (ICEclc-DmfsR, 4322) pregrown in suspended culture to stationary phase on 3-chlorobenzoate (3CBA) or succinate (succ), and plated from there on 3CBA or succinate agar. (E.g., 3CBA-3CBA, suspended culture on 3CBA, plated on 3CBA agar). Survival expressed as colony forming units (CFU) on the agar plate per ml of stationary phase culture. Data bars indicate the average from independent biological triplicates. Error bars indicate the calculated standard deviation from the average. (B) Phase-contrast micrographs at 1000-fold magnification of microcolonies ofP. putidaUWC1 (ICEclc) andP. putida(ICEclc-DmfsRPint-egfp, 4612) growing on agarose surface supplemented with 0.1 mM 3CBA. Shown are a regular stationary phase microcolony ofP. putidawith wild-type ICEclcand a transfer competent microcolony (tcm), occurring at 1-3% frequency as reported previously [30]. For comparison, massive lysis (white arrows) and cellular malformations formed in many microcolonies ofP. putidaUWC1 with themfsRdeletion. doi:10.1371/journal.pgen.1004441.g006
Table 2.Effects of themfsRdeletion on the growth characteristics ofP. putidaUWC1 carrying ICEclc.
Strain Generation time (min)1 Survival rate (%)2
Name Number MM Succ MM 3CBA MM Succ MM 3CBA
P. putidaUWC1 (ICEclc) 2737 74.466.83 186
611 100612 11368.5
P. putidaUWC1 (ICEclc-DmfsR) 4322 68.268.1 18463 0.360.3 5.662.5
p = 0.384 p = 0.77 p = 0.00012 p = 2.96?10-5
1)Generation time was calculated as ln2/m, whereby
m(min-1) is the slope of the regression line on a plot of the logculture turbidityversus time from at least 5 points during
exponential phase. Coefficients of determination (R2) were.0.96 for each growth curve.
2)Survival rate in stationary phase of cultures on the indicated media was calculated as the ratio of the number of CFU/ml counted on MM
+3CBA and the number of
CFU/ml on MM+succinate plates. Succ, succinate; 3CBA, 3-chlorobenzoate.
3)Calculated standard deviation from triplicate measurements.
4)Calculated p-value in a two-tailed Student’s t-Test using equal variance.
Figure 7. Conservation oftciRanalogues in putative ICEclc-like regions in a variety of other bacterial genomes.Illustration represents
tciRanalogues (identified on the basis of a BLASTN E-value lower than 1?10-15), and surrounding relevant gene regions in the indicated bacterial
genomes (species name, accession numbers) compared to ICEclc. Genes are indicated as in the respective genome accession. Rectangles show
annotated genes and their orientation (top, orientation towards the left; bottom, gene orientation towards to right); common colors indicate similar predicted functions. Stippled rectangles indicate common gene regions inferred from Artemis comparison, but not present in the respective annotation. ICE were inferred from (i) more than 75% nucleotide identities across the complete core region of ICEclc, and within a 1-100 kb window from thetciRposition, and (ii) the presence of an integrase gene (in brown) within a 5-20 kb window from thetciR-analogue. Note how some genomes carry multiple different ICE from the same family (e.g.,Achromobacter xylosoxidans,Acidovoraxsp. strain JS42), and further how pair-wise identical ICE regions (shaded in grey) occur between different genomes. Finally note how the tciR-analogues often co-occur with a xer-type regulatory gene on the other strand (light green), and a furtherlysRgene member (yellow), but in none of the cases shown here with anmfsR
counterpart (in red).
(ICEclc-DmarR) were impaired in survival compared to UWC1 (ICEclc) (Figure S6).
tciRis a very widespread ortholog among ICE closely related to ICEclc
Using bioinformatic queries, we retrieved orthologs totciRand
mfsRfrom sequenced bacterial genomes, and examined manually whether they occur in chromosomal regions qualifying as ICE (e.g., presence of an integrase gene nearby, see Materials and Methods). Interestingly, orthologs to the individual components of the mfsR operon are widespread but rarely occur in the same configuration (Figure 7). So far, the ICEclc mfsR-marR-tciR
configuration is only found in the ICEclc variant of Burkholderia xenovorans LB400, whereas the Tn4371-element of Acidovorax sp. strain JS42 and Aeromonas hydropohila SSU (accession number AGWR01000022.1) both carry an mfsRhomolog and a MarR-type regulator immediately downstream, but no tciR equivalent nearby. There is atciRortholog inAcidovorax sp. strain JS42, but not on the same chromosomal region asmfsR(Figure 7).
On the other hand,tciRseems much more widespread among ICEs, as homologs can be found in ICEclc-like elements GI1 and GI6 ofBordetella petriiDSM12804, in PAGI-2 ofP. aeruginosastrain C, in diverse ICEs of X. campestris pv. vesicatoria str. 85-106, suspected ICEs in Herminiimonas arsenicoxydans, Cupriavidus metalli-durans CH34, and Tolumonas auensis DSM 9187, among several dozens of others (Figure 7). Given that TciR is such a common regulator found in ICEs of the ICEclcfamily, it might be similarly implicated in their transfer control. This regulation is likely different in detail from ICEclc, given the absence of anmfsRand
marR.
Discussion
ICEclc has two distinctive modes of existence: the integrated form, which is transmitted vertically, and the circular form, which can be horizontally transferred. Previous work in our laboratory has shown that the transition between these two states occurs in only a few percent of cells in a population under stationary phase conditions [26,30,34]. We have recently suggested to name cells in which the molecular decision occurs to activate the ICEclc
horizontal transfer modetransfer competent(tc) cells [30]. Single cell time-lapse experiments indicated that ICEclc transfer - at least insofar as detectable by microscopy, only occurs from tc cells, which can be distinguished through simultaneous expression of fluorescent proteins from single copy transcriptional fusions to the Pintand PinR promoters of ICEclc[30]. Activation of those two promoters is the likely outcome of a multi-step regulatory cascade that orchestrates expression of some fifty genes [32], but the key factors that determine the onset of this cascade and control the extent of bistability are still obscure. Previous work provided evidence for the role of the stationary phase sigma factor RpoS in activation of ICEclcpromoters, and we could show that tc cells on average have higher levels of RpoS [34]. In the present study, we report the discovery of a cluster of three regulatory genes, two of which globally control ICEclc activation and transfer, and additionally maintain a cap on fitness loss induced by the ICE (Figure 8).
The three regulatory genes occur in a unique configuration of a TetR-type repressor (encoded bymfsR), followed by a MarR-type (orf17984) and a LysR-type regulator (tciR). Transcript and microarray analysis of the locus in wild-type and mutant ICEclc, plus analysis of reporter gene expression from themfsRpromoter in a variety of host backgrounds, showed that the three genes are
expressed as a polycistronic unit and are under autoregulatory control by MfsR (Figure 5A).
Precise gene deletions and complementations indicated thattciR
is likely the main global regulator of ICEclc transfer activation. Deletion of tciR caused a 2?103-fold lower frequency of ICEclc
transfer compared to wild type (Figure 2B), silenced expression of the ICEclccore region (Figure 3B) and reduced the proportion of cells expressing Pint and PinR in stationary phase (Figure 5B). Complementation of thetciRdeletion on ICEclcwith a single copy mini-Tn7insertedmfsRfs-marRfs-tciRfragment (Figure 1C) fused to the mfsR promoter region restored the expected phenotype (Figure 2B). TciR may act either directly as a regulator on a variety of individual ICEclc core promoters, or as a ‘‘master’’ regulator in a hierarchical activation cascade (Figure 8).
The role ofmarRis less clear and as yet unsolved. Deletion in
marRresulted in essentially the same ICEclctranscriptome profile as deletion intciR(Figure 3D). It also resulted in a lower transfer frequency than wild-type but not as low as the deletion intciR
(Figure 2B), and produced no detectable reporter gene expression from Pintor PinR(Figure 5). In contrast, complementation of the
marRdeletion on ICEclcby a single copymarRgene through mini-Tn7 delivery (Figure 1C) did not restore ICEclc transfer Figure 8. Model for regulation of ICEclctransfer competence.
MfsR autoregulates expression of itself and of the TciR activator, without which ICEclctransfer decreases by 2?103-fold. TciR may activate
specifically one or more promoters on ICEclc, such as the
RpoS-dependent PinR-promoter [29], or a promoter upstream of theparA-like gene [32]. Expression of the PinR-promoter occurs preferentially in cells having highest RpoS levels, and only 1-3% of cells in a population in stationary phase visibly express reporter gene from PinR [29]. InrR transmits bistable activation through an unknown process to theintB13
promoter [26], and possibly simultaneously to other promoters for the genes for the conjugative system in the ICEclccore region [32]. The exact mechanism of arisal of bistability is unclear as yet. For gene locations on ICEclc, see Figure 1A.
(Figure 2B). Furthermore, mutants with deletions inmfsRormfsR
plus the first 116 bp ofmarR(Figure 1B), behaved quite similar in transfer frequency (Figure 2) and showed similar ICEclc tran-scriptomes (Figure S4). ThemarRgene therefore seems to have no clear role in ICEclccore gene expression.
The most surprising effect of deletions inmfsRwas a complete deregulation of the ICEclc core gene expression. This became obvious from frequencies of ICEclc transfer being 10-100 fold higher than wild type, approximating 1 transfer per donor cell (Figure 2B). The deregulation was also obvious in microarray data showing the ICEclccore region in themfsRdeletion mutants being already transcribed in exponential phase (Figure 3B, Figure S3). Finally, 80-100% of individual cells in stationary phase expressed the reporter genes from Pintand PinR in themfsRdeletion strain compared to 3-5% in wild-type (Figure 5B). This can be explained by the fact that deletion of mfsR would abolish autorepression, which would lead to constant high expression ofmarR and tciR.
This overinitiates ICEclccore gene expression, leads to more cells entering the tc state and to higher transfer rates. The balance of
mfsR control appears to be extremely delicate, since even complementation with a single gene copy under control of the original promoter results in a stronger effect than the wild-type, both fortciRandmfsR(Figure 2B). The delicate balance became also obvious from the polar effects of insertion of the Km-resistance gene withinmfsR, leading to decreased transcription of
marR andtciR, diminished core gene expression (Figure 3D) and reduced transfer rates (Figure 2A).
The finding that deletion and complementation ofmfsRortciR
drastically changes the proportion of cells activating ICEclc,could imply that the bistability seen in wild-type situation (i.e., 3-5% of cells in stationary phase becoming transfer competent) is a result of feedback at this locus. Cells activating ICEclc in the wild-type situation could arise as a consequence of ‘‘sloppy’’ control by MfsR, incidentally causing a few cells to escape its control and transcribingmarR andtciR. We think this is an unlikely scenario, because mCherry expression from the mfsRpromoter is homog-enous among cells (Figure 5A). Alternatively, there might be a chemical ligand that specifically binds to MfsR in a small subset of cells, upon which its repression is relieved in those cells. The resulting TciR would then be the necessary activator to trigger ICEclccore expression in cells with on average highest RpoS levels [29] (Figure 8). On the other hand, even thoughmfsRmay be the first level of control, bistability may also originate at later checkpoints in the regulatory cascade, which depend on the presence of sufficient TciR.
Quasi-global appearance of transfer competence across all cells in the mfsR deletion mutant resulted in massive fitness loss (Figure 6), which became evident at two levels. First of all, time-lapse observations indicated lysis and aberrant cell growth in more than 50% of microcolonies (Figure 6B). This lysis and growth arrest are similar to what we previously described as being a side consequence of becoming transfer competent in wild-type cells [30], and is caused by theparA-shigene products on ICEclc[30]. Secondly, there was a strong loss of the capacity to grow on 3CBA among cells sampled from stationary phase cultures of themfsR
mutant compared to wild-type (Figure 6A, Figure S6), indicative for loss of ICEclcand counterselection against maintaining ICE
clc-DmfsR. However, those cells that maintained ICEclc-DmfsRcould still grow on 3CBA and showed indistinguishable exponential growth rate (Table 2). This paradox can be understood when modeling the number of tc cells in batch culture populations for ICEclcwild-type (probability of tc arisal,Ptc, in stationary phase of 0.025) and for the ICEclc-DmfsR mutant (Ptc= 0.5). This model (Figure S5B) shows that whereas a large proportion of tc cells
appear in ICEclc-DmfsRmutant cultures in stationary phase, these can only divide 2-3 times upon reinoculation into fresh medium before lysing. This causes an apparent prolongation of a lag phase visible as stagnant culture turbidity, but does not influence the overall predicted population exponential growth rate in batch culture (Figure S5B).
As expected from the postulated role of TciR, its complemen-tation in trans also leads to increased ICEclc transfer, but interestingly, only the mfsR deletion caused strongly decreased cell survival (Figure S6). We therefore hypothesize that ICEclc
activation may follow two separate processes: transfer and tc cell growth arrest [30], that may both be initiated at themfsRlocus. Deleting mfsR would then deregulate both processes, whereas expressingtciRin trans would only increase activation through the transfer branch (Figure 8).
The configuration of the mfsR-marR-tciR operon of ICEclc is unique, buttciR alone is a very common part of ICE similar to ICEclc (Figure 7). We therefore speculate that mfsR-marR are a more recent acquisition in ICEclc, which drastically changed the expression of the tciR gene. Unfortunately, expression of tciR
analogs in other ICEs has not been studied and very little has been reported on the transferability of ICEs related to ICEclc. The exceptions being GI3 of B. petriithat transfers at extremely low frequencies (,10-7) [35], and theP. aeruginosaPAGI-2 element for which transfer has not been detected at all [16]. In comparison, wild-type ICEclc transfers at rates of 10-2 to 10-3 per donor (Figure 2), suggesting that it was perhaps the acquisition of the
mfsRregulatory control that led to expression of transfer activity in a larger proportion of cells in the population. As we show here, the downside of increasing the proportion of ICEclc tc cells is an increase of the proportion of cells displaying growth arrest through theshi-parApathway [30]. Likely, the MfsR autoregulation evolved to a stage of permitting efficient transfer but avoiding too much fitness loss to the population. Even though the mechanistic details are different for ICEclc, double control layers are more common for various ICEs and typically involve a variety of regulators acting on each other and/or in response to specific chemical ligands [18,19,23-25]. It will be highly interesting to further study the mechanistic details of the control systems that maintain very low ICE transfer rates, and to understand whether and how such control can evolve to allow hyperefficient transfer.
Materials and Methods
Strains and culture conditions
Table 1 lists the strains used in this study.Escherichia coliDH5a
(Gibco Life Technologies, Gaithersburg, Md.),E. coliDH5a lpir,
E. coliBW20767/pRL27 were cultured at 37uC on Luria-Bertani (LB) medium [36].Pseudomonasspecies were cultured at 30uC on LB or 21C minimal medium (MM) [37] complemented with one of the following carbon sources: 0.5, 5, or 10 mM 3-chlorobenzo-ate (3CBA), 15 mM succin3-chlorobenzo-ate or 10 mM fructose. Antibiotics were supplemented to the growth medium to select for maintenance of genetic constructions at the following concentrations: kanamycin (Km) 25mg/ml, chloramphenicol (Cm) 20mg/ml, rifampicin (Rif) 50mg/ml, nalidixic acid (Nal) 50mg/ml, gentamicin (Gm) 20mg/ ml, and ampicillin (Ap) 100mg/ml.
Strain constructions and DNA techniques
[29,38]. Nucleotide positions are given according to AJ617740 (ICEclc). Primers used for strain constructions are listed in table S1. For complementation ofP. putidaUWC1 (ICEclc-DmfsR, strain 4322) we first amplified themfsRgene plus the 429 bp upstream region containing the mfsRpromoter using PCR. This fragment was cloned into pGEM-T-easy and verified for correctness by DNA sequencing. The fragment containing the correct mfsR
region was then recovered by restriction enzyme digestion with PstI and BamHI, and ligated into the mini-Tn7 vector pUC-miniTn7-Gm [39]. After transformation and verification inE. coli, the mini-Tn7 construct was introduced into P. putida UWC1 (ICEclc-DmfsR) by using the pUX-BF13 helper plasmid [40]. Clones resistant to Gm were selected and verified by PCR for correct insertion of the mfsR DNA in the attTn7 locus. To complement P. putida UWC1 (ICEclc-DtciR, strain 4321) and (ICEclc-DmarR, strain 4372) we amplified the complete mfsR-marR-tciR locus including the 429-bp upstream region. This fragment was cloned into pGEM-T-easy and again verified for correctness by DNA sequencing. The fragment was recovered by digestion with BamHI and StuI, and ligated with the mini-Tn7vector. A frameshift was then introduced in the mfsR coding region by digestion at the unique NcoI-site, filling in using Klenow and religation. This will cause premature ending of the mfsR gene product (mfsRfs)
. A second frameshift was subsequently introduced to inactivate the marR gene product, using the unique BsgI-site (marRfs). After transformation and verification in E. coli, the construct was introduced in P. putida UWC1 (ICEclc-DtciR) as outlined above. This procedure was repeated to create a fragment with frameshifts inmfsRand intciR(using the unique KpnI site), but maintaining an intact marR. This construct was introduced into P. putida UWC1 (ICEclc-DmarR). Gm-resistant clones were verified by PCR for the correct insertion at theattTn7-site, and for the presence of ICEclc.
A 656-bp region upstream ofmfsRwas amplified by PCR and fused to a promoterlessmcherrygene. This fragment was introduced in single copy on the chromosome ofP. putida UWC1,P. putida
UWC1 (ICEclc) orP. putidaUWC1 (ICEclc-DmfsR) using mini-Tn5
delivery. Three independent Km-resistant colonies were verified by PCR for the correct insertion and stored individually.P. putida
UWC1 mini-Tn5-PmfsR-mcherry and P. putida UWC1 (ICEclc
-DmfsR) mini-Tn5-PmfsR-mcherrywere then further used as recipient to introduce the mini-Tn7-mfsRconstruct.
Random mutagenesis and screening
Random mini-transposon insertions inP. knackmussiiB13 were generated by mobilization of the pRL27 suicide plasmid fromE. coli BW20767 in a biparental mating. Hereto both strains were each cultured overnight in 3 ml LB, pelleted down, resuspended in 50ml sterile saline solution (0.9% NaCl), mixed in a 1:1 (v/v) ratio and incubated on the surface of an LB agar plate for 24 hours at 30uC. The mixture was then resuspended with 1 ml saline solution, which was inoculated in 100 ml MM with 0.5 mM 3CBA plus Km to select for the mini-transposon insertion and Cm to counterselect against E. coli, and incubated at 30uC for 16 h with orbital shaking (180 rpm). An aliquot of 3 ml of this pool of enriched KmR B13 mutants was used en masse as donor in a subsequent mating procedure. Hereto, cells from the 3 ml suspension were pelleted by centrifugation, washed with 3 ml sterile saline and mixed with 3 ml of suspension ofP. putidaUWC1 recipient, that had been grown for 16 h on LB, was pelleted by centrifugation and resuspended in sterile saline. The mating mixture was again centrifuged, the cell pellet was resuspended in 50ml sterile saline solution and spotted on the surface of a MM agar plate containing 0.5 mM 3CBA. The mixture was incubated
for 72 hours at 30uC, after which the cells were washed from the plate with 1 ml sterile saline, which was further serially diluted and plated on MM agar plates with 5 mM 3CBA plus Km and Rif to select for transconjugants carrying mutant ICEclc. Individual colonies were purified, recultured in organized 96-well format and stored at -80uC after addition of and mixing with glycerol to 15% (v/v). Libraries were replicated and regrown in 100ml LB plus Rif for 16 h in 96-well microtiter plates, mixed with 100mlP. putida
UWC1 NalR recipient suspension, and incubated at 30uC for 48 h. Then 50ml of each well was reinoculated into 170ml of MM containing 5 mM 3CBA plus Km, Rif and Nal, and growth was measured by continuous OD-measurements in a multiplate reader (FluoStar Omega, BMG labtech). Absence of growth was taken as indication for absence of ICEclctransfer, in which case the donor culture was recovered for mapping of the transposon insertion.
Insertion mappings
DIG-labeled primers 070934 or 070935, annealing to one of the ends of the KmRinsert but facing outward, were used (separately) in single-primer PCR with DNA from mutant UWC1 donors as templates. The reactions produced oligonucleotide probes with the 59-DIG label, the sequence of the end of the KmRgene and the adjacent sequence of the ICEclc insert position. Such products were used for rough localization of the insertion position by hybridizing to macroblot membranes (Eurogentec, UK), whose set of 55-mer oligonucleotides covers most of the ICEclc genes. Hybridization and detection of the DIG-marker were carried out according to the manufacturer’s instructions (Roche Diagnostics GmbH, Mannheim, Germany). Once the insertion was roughly mapped on ICEclc, PCR-based sequencing was used to determine exact position of the KmR-gene insertion.
ICEclc transfer assays
The frequency of ICEclc transfer was determined in experi-mental conditions described previously [33]. P. putida UWC1 ICEclc wild-type or mutant derivatives were used as donors, whereasP. putidaUWCGC (constitutively fluorescent, GmR) orP. putidaUWC1 KmR were used as the recipient (Table 1). Briefly, donors and recipient were each cultivated on 5 mM 3CBA MM and 10 mM fructose MM, respectively, and combined on 0.5 mM 3CBA agar plates as a single concentrated pellet. After 48 hours incubation at 30uC, mating mixes were resuspended, diluted and plated on 5 mM 3CBA MM agar (counting of donor CFU) or 5 mM 3CBA Gm or Km agar (counting of transconjugant CFU). Transconjugants were checked by PCR and frequencies were expressed as the number of transconjugant CFU per donor CFU. Donor survival was used for the data shown in Figure S6.
ICEclc transcriptome analysis by microarrays
The ICEclctranscriptomes ofP. putidaUWC1 (ICEclc),P. putida
UWC1 (ICEclc), P. putida UWC1 (ICEclc-KmR19033), P. putida UWC1 (ICEclc-D’marR),P. putidaUWC1 (ICEclc-D’tciR),P. putida
Time-lapse microscopy
P. putidaUWC1 strains were precultured for 16 h at 30uC in LB medium, after which 100ml were transferred to 20 ml fresh MM 4 mM 3CBA medium in presence of the appropriate antibiotics. This culture was incubated for 96 hours at 30uC and 200 rpm shaking, after which the cells were 100-fold diluted in MM without C-source and inoculated on agarose surfaces (gel patches) for time-lapse microscopy [41]. Medium for gel patches consisted of 1% agarose dissolved by heating into MM with 0.1 mM 3CBA. Gel patches were created by pipetting 130ml of the agarose-MM-3CBA solution kept at 55uC on the surface of a circular cover glass (42 mm ø and 0.17-mm thick), placed in an autoclaved perfusion chamber (POC, H. Saur, Reutlingen, Germany), separated with a 0.5 mm thick silicon spacer ring and covering them with a second cover glass. After solidification of the agarose, the upper cover slip was removed and 6ml of the diluted cell suspension was placed onto the agarose gel patch. As soon as the drops were dried on the surface, the patches were turned upside down and placed bacteria-facing-down on a new round cover glass [41]. A second silicon spacer ring was added to allow air circulation within the closed chamber and the glass sandwich was fixed into the metal cast POC chamber with a metal ring. Up to four patches could be placed simultaneously within a single glass sandwich in a POC chamber.
Microcolony development was followed directly on a Nikon Inverted Microscope Eclipse Ti-E, equipped with a Perfect Focus System (PFS), pE-100 CoolLED and a Plan Apol10061.45 Oil objective (Nikon), installed in a controlled temperature room (22uC). Ten random regions of every patch were imaged automatically during 48 hours with intervals of 1 h, in Phase Contrast mode (10 ms exposure), eGFP (500 ms) and eCherry (500 ms). Images were recorded using Micro-Manager 1.4 (http:// www.micro-manager.org/) and fluorescence values were extracted using MetaMorph (Series 7.5, MDS, Analytical Technologies).
P. putidaUWC1 ICEclcand mutant fitness tests
Triplicates of strains UWC1 (ICEclc) and UWC1 (ICEclc-DmfsR) were grown for 16 h in LB medium at 30uC. Both strains were then 500-fold diluted (starting OD6000.001) in MM with 5 mM 3CBA or 10 mM succinate. Upon reaching early stationary phase, strains were again diluted into fresh MM (starting OD 0.001) with the same carbon source, and growth was followed by frequent culture turbidity measurements (OD600). 24 h after reaching stationary phase, each replicate culture was serially diluted in MM and plated onto MM agar plates with 5 mM 3CBA or with 10 mM succinate. The number of CFU/ml was scored and the ratio was calculated between the number of CFU/ml on MM agar with 5 mM 3CBA and the number of CFU/ml on MM with 10 mM succinate.
Ten randomly chosen colonies of UWC1 (ICEclc-DmfsR) cultivated in MM with succinate and grown on MM-succinate agar plates were retested for growth on MM agar with 5 mM 3CBA. The presence of ICEclcwas determined by colony PCR on the same colonies by amplifying theclcAgene, which is carried by ICEclc and the gene product of which is essential for 3CBA metabolism.
Bioinformatic screening for ICE related to ICEclc
Homologues totciRof ICEclcwere detected by BLASTN to the nr/nt database at E-value,1?10-15. The corresponding whole or draft genome sequences were retrieved and compaired by aligning to ICEclc (Accession number AJ617740.2) using Megablast. Detected regions were manually recovered and searched for the
tciR homologue and an intB13 homologue within a 1-100 kb
window. If annotated, the presence of a gene for tRNA-Gly nearby the intB13homologue was scored. Regions covering all criteria (i.e., homology to ICEclccore region,tciRhomologue and presence of integrase gene) were retained as containing putative ICE. Selected regions were further individually pair-wise compared by using the Artemis Comparison Tool within the WebACT service [42].
Supporting Information
Figure S1 Outline of the random mutagenesis and subsequent selection procedure. Original ICEclc-host P. knackmussii B13 is randomly mutagenized by miniTn5-mediated insertions of kanamycin resistance inserts (KmR). Mutant B13 are selected by culturing cells on minimal medium (MM) with Km and 3-chlorocatechol (3CBA) as sole carbon and energy source. The pool of B13 mutants is cultured in batch and mixed with recipient strain
P. putida UWC1 (resistant to rifampicin, RifR). The mixture is incubated in mating conditions for 72 hours and plated on MM with 3CBA, Km and Rif, to select for transconjugants. Individual colonies of transconjugants were restriked and organized into a mutant library in 96-well plates. Each mutant is used as donor in a new 96-well mating with recipientP. putidaUWC1 resistant to Rif and nalidixic acid (NalR). Individual mating mixtures are grown on MM agar with 3CBA, Km, Rif, Nal in order to select for transconjugants. In absence of transconjugant growth, the donor of that particular mating was recovered from the library and had its insertion position mapped.
(TIF)
Figure S2 Reverse transcriptase polymerase chain reaction analysis of transcription in the mfsR-marR-tciR region. (A) Amplification of specific regions on reverse-transcribed (+) or not (-) mRNA purified from exponentially growingP. putida UWC1 (ICEclc) cultures on 3CBA, compared to amplification on purified DNA. (B) Schematic overview of the location of the used primers for the reverse transcription reaction (RT) and for the amplifica-tion of the gene regions.
(TIF)
Figure S3 Pair-wise comparisons of expression in the ICEclc
area by microarray analysis. (A)P. putidaUWC1 (ICEclc-DmarR, strain 4372) compared toP. putidaUWC1 (ICEclc, strain 2737). (B)
P. putidaUWC1 (ICEclc-DtciR, strain 4321) versusP. putidaUWC1 (ICEclc, strain 2737). (C)P. putida UWC1 (ICEclc-DmarR, strain 4372) versusP. putida UWC1 (ICEclc-DtciR, strain 4321). Panels indicate comparisons of exponentially growing or stationary phase cells, with hybridization signals on the plus- (open symbols) or minus-strand (closed symbols) of ICEclc. Dots indicate the2log-fold change of hybridization signal per microarray probe in the comparison, plotted at their distance along the ICEclcsequence (X-axis; in kb). A scheme of ICEclcis redrawn at the bottom of each section, with regions of interest as grey boxes (+or - indicate the DNA strand on which the region is encoded). Grey bars in the background indicate the two-fold cut-off level.
(TIF)
Figure S4 Pair-wise comparisons of expression in the ICEclc
area ofmfsRmutants by microarray analysis. (A)P. putidaUWC1 (ICEclc-DmfsR, strain 4322) compared toP. putidaUWC1 (ICEclc, strain 2737). (B) P. putida UWC1 (ICEclc-DmfsR-D’marR, strain 3453) versusP. putida UWC1 (ICEclc, strain 2737). (C)P. putida
Dots indicate the 2log-fold change of hybridization signal per microarray probe in the comparison, plotted at their distance along the ICEclcsequence (X-axis; in kb). A scheme of ICEclcis redrawn at the bottom of each section, with regions of interest as grey boxes (+or - indicate the DNA strand on which the region is encoded). Grey bars in the background indicate the two-fold cut-off level.
(TIF)
Figure S5 Observed and expected population growth in cultures of P. putida with wild-type ICEclc and the DmfsR mutant. (A) Measured turbidities in triplicate batch cultures growing on 3CBA as sole carbon and energy source. Note the increased lag time of the
P. putidaDmfsRmutant. (B) Modeled population growth of all cells (brown) and tc cells (red) in two subsequent batch cultures growing on 3CBA; the second being inoculated with 1:1000 volume from the first culture in stationary phase. Scenarios show predicted behavior for wild-type ICEclc (with a probability Ptc of 0.025 of tc cell appearance in stationary phase) and forDmfsR(withPtc= 0.5). Note how a tc population appears in stationary phase, which is transferred to a new culture, but rapidly dies as a result of activation of thepar-shisystem [30]. Note further how exponential growth rates remain the same for both wild-type ICEclcand theDmfsRmutant. Modeling based on Monod kinetics, using the following parameters: total C = 4.25 mg C/ml, dry weight of a single cell = 2?10-12g, yield = 0.3 g/g, Ks= 0.02 mg/mL, generation time of non-tc cells = 1 h, generation time of tc-cells = 2 h, death rate of tc cells = 0.4 h-1.
(TIF)
Figure S6 Population sizes ofP. putidaUWC1 carrying wild-type (2737, 2738) or mutant ICEclc, measured as colony forming units (CFU) on 5 mM 3-chlorobenzoate agar plates, per ml of resuspended culture spotted and incubated for 48 h on 0.5 mM 3-chlorobenzoate containing agar medium. (A) P. putida UWC1
strains: 4165, ICEclcwith a deletion in the genes for the suspected efflux system (as unrelated control); 4321,tciRdeletion; 4322,mfsR
deletion; 4372, marR deletion; versus P. putida UWC1 (ICEclc), 2738. (B)P. putida UWC1 strains: 2737, ICEclcwild-type; 4321,
tciRdeletion; 4322,mfsRdeletion; 4372,marRdeletion; 4646,mfsR
deletion but complemented in trans by a single copy mini-Tn7
insertedmfsRgene under its own promoter; 4649,tciRdeletion but complemented in trans by a single copy mini-Tn7 inserted fragment with the (mfsRfs)-(marRfs)-tciR genes under the mfsR
promoter. 4804, marR deletion but complemented in trans by a single copy mini-Tn7 inserted fragment with the (mfsRfs
)-marR-(tciRfs) genes under themfsRpromoter. (A) and (B), Independently carried out experiments on different occasions and by different scientists. Letters indicate statistically indistinguishable groups identified from ANOVA tests on biological replicates, followed by Tukey’s post hoc testing. P-values indicate the significance for the overall group difference (a versus b), or in one specific case, between the samples connected by the line.
(TIF)
Table S1 Oligonucleotides used for amplification of ICEclc
fragments. (DOCX)
Acknowledgments
The authors thank Philipp Engel and Victor de Lorenzo for critical reviewing of the manuscript.
Author Contributions
Conceived and designed the experiments: NP SS FD JRvdM. Performed the experiments: NP SS FD IL RM JRvdM. Analyzed the data: NP SS FD RM JRvdM. Contributed reagents/materials/analysis tools: RM NP. Wrote the paper: NP JRvdM FD.
References
1. Koonin EV, Wolf YI (2008) Genomics of bacteria and archaea: the emerging dynamic view of the prokaryotic world. Nucleic Acids Res 36: 6688-6719. 2. Kloesges T, Popa O, Martin W, Dagan T (2011) Networks of gene sharing
among 329 proteobacterial genomes reveal differences in lateral gene transfer frequency at different phylogenetic depths. Mol Biol Evol 28: 1057-1074. 3. Rankin DJ, Rocha EP, Brown SP (2011) What traits are carried on mobile
genetic elements, and why? Heredity 106: 1-10.
4. Beiko RG, Harlow TJ, Ragan MA (2005) Highways of gene sharing in prokaryotes. Proc Natl Acad Sci U S A 102: 14332-14337.
5. Gogarten JP, Townsend JP (2005) Horizontal gene transfer, genome innovation and evolution. Nat Rev Microbiol 3: 679-682.
6. Frost LS, Leplae R, Summers AO, Toussaint A (2005) Mobile genetic elements: the agents of open source evolution. Nat Rev Microbiol 3: 722-732. 7. Thomas CM, Nielsen KM (2005) Mechanisms of, and barriers to, horizontal
gene transfer between bacteria. Nat Rev Microbiol 3: 711-721.
8. Juhas M, van der Meer JR, Gaillard M, Harding RM, Hood DW, et al. (2009) Genomic islands: tools of bacterial horizontal gene transfer and evolution. FEMS Microbiol Rev 33: 376-393.
9. Guglielmini J, Quintais L, Garcillan-Barcia MP, de la Cruz F, Rocha EPC (2011) The repertoire of ICE in prokaryotes underscores the unity, diversity, and ubiquity of conjugation. PLoS Genet 7: e1002222.
10. Wozniak RA, Waldor MK (2010) Integrative and conjugative elements: mosaic mobile genetic elements enabling dynamic lateral gene flow. Nat Rev Microbiol 8: 552-563.
11. Burrus V, Waldor MK (2004) Shaping bacterial genomes with integrative and conjugative elements. Res Microbiol 155: 376-386.
12. Burrus V, Pavlovic G, Decaris B, Gue´don G (2002) Conjugative transposons: the tip of the iceberg. Mol Microbiol 46: 601-610.
13. Dobrindt U, Hochhut B, Hentschel U, Hacker J (2004) Genomic islands in pathogenic and environmental microorganisms. Nat Rev Microbiol 2: 414-424. 14. Bellanger X, Payot S, Leblond-Bourget N, Guedon G (2013) Conjugative and mobilizable genomic islands in bacteria: evolution and diversity. FEMS Microbiol Rev. 10.1111/1574-6976.12058 [epub ahead of print].
15. Klockgether J, Reva O, Larbig K, Tu¨mmler B (2004) Sequence analysis of the mobile genome island pKLC102 ofPseudomonas aeruginosaC. J Bacteriol 186: 518-534.
16. Klockgether J, Wu¨rdemann D, Reva O, Wiehlmann L, Tu¨mmler B (2007) Diversity of the abundant pKLC102/PAGI-2 family of genomic islands in Pseudomonas aeruginosa. J Bacteriol 189: 2443-2459.
17. Lee CA, Babic A, Grossman AD (2010) Autonomous plasmid-like replication of a conjugative transposon. Mol Microbiol 75: 268-279.
18. Auchtung JM, Lee CA, Monson RE, Lehman AP, Grossman AD (2005) Regulation of aBacillus subtilismobile genetic element by intercellular signaling and the global DNA damage response. Proc Natl Acad Sci U S A 102: 12554-12559.
19. Beaber JW, Waldor MK (2004) Identification of operators and promoters that control SXT conjugative transfer. J Bacteriol 186: 5945-5949.
20. Burrus V, Waldor MK (2003) Control of SXT integration and excision. J Bacteriol 185: 5045-5054.
21. Sezonov G, Hage`ge J, Friedmann A, Gue´rineau M (1995) Characterization of pra, a gene for replication control in pSAM2, the integrating element of Streptomyces ambofaciensMol Microbiol 17: 533-544.
22. Sezonov G, Ducheˆne A-M, Friedmann A, Gue´rineau M, Pernodet J-L (1998) Replicase, excisionase, and integrase genes of theStreptomyceselement pSAM2 constitute an operon positively regulated by thepragene. J Bacteriol 180: 3056-3061.
23. Sezonov G, Possoz C, Friedmann A, Pernodet J-L, Gue´rineau M (2000) KorSA from the Streptomyces integrative element pSAM2 is a central transcriptional repressor: target genes and binding sites. J Bacteriol 182: 1243-1250.
24. Ramsay JP, Sullivan JT, Jambari N, Ortori CA, Heeb S, et al. (2009) A LuxRI-family regulatory system controls excision and transfer of theMesorhizobium loti strain R7A symbiosis island by activating expression of two conserved hypothetical genes. Mol Microbiol 73: 1141-1155.
25. Ramsay JP, Major AS, Komarovsky VM, Sullivan JT, Dy RL, et al. (2013) A widely conserved molecular switch controls quorum sensing and symbiosis island transfer inMesorhizobium lotithrough expression of a novel antiactivator. Mol Microbiol 87: 1-13.