AN EVALUATION OF TURBO ROUNDABOUT PERFORMANCES:
CASE STUDY OF THE CITY OF OHRID
Natasha Gredoska1, Kristi Bombol 2, Daniela Koltovska Nechoska31
1, 2, 3 Sv. Kliment Ohridski University, Faculty of Technical Sciences, Depatment for Traffic and Transport, Boulevard 1st of May B.B., Bitola 7000, Republic of Macedonia
Received 18 December 2015; accepted 24 May 2016
Abstract: The turbo roundabout is an innovative design of the two lane roundabout that has revolutionised roundabout design. According to the international research, it is determined that the turbo roundabout has a higher level of traffic safety because of the lower number of conflicts and the use of raised lane dividers. In addition, compared with the conventional two lane roundabout, turbo roundabout has higher capacity. Due to these advantages, the reconstruction of intersections into turbo roundabouts has become a kind of global trend nowadays. The first turbo roundabout in the Republic of Macedonia was designed in Skopje in 2011, without tracking the performances. This was exactly the motive to investigate the performances of this type of intersections.
In this research three intersections in sequence located in Ohrid (two signalized and one non-signalized intersection) and the performances are determined for the current situation and the situation with increased flows by using the software tool SIDRA. A reconstruction of the intersections has been made into turbo roundabouts. The performances for two different cases (current situation and the situation with increased flows, with and without the pedestrians’ influence) are determined with the use of both VISSIM and analytical model by Brilon&Wu. The analysis has proven that with the input parameters, turbo roundabouts offer better performances compared to the existing intersections. Thus, the reconstruction of the intersections is justified.
Keywords: turbo roundabouts, capacity models, performances, pedestrian impact.
3 Corresponding author: [email protected]
1. Introduction
When comparison is drawn between the intersections – either signalized or non-signalized, and the roundabouts, the latter display a series of advantages over the former ones when capacity, level of service, and traffic safety are at question (Tollazi, 2015). However, at the roundabouts with multiple lanes and two-laned approaches and exits, conflictual situations arise when
vehicles enter the circular lanes and when they move from inner one into outer one of the roundabout. The most dangerous are the traffic manouevers at roundabouts exits. They are one of the main reasons for nu merous accident s on t wo-la ne roundabouts.
The problems stated could be eliminated by
introducing the so-called turbo roundabouts
conventional multi-lane roundabout where spiral road markings and physically separated lanes force drivers to follow a very specific path according to their intended destination. T he geomet r y of t u rbo rou ndabouts completely eliminates weaving and cut – in conflicts by guiding drivers from entry to exit of intersection.
The reasons for preferring turbo roundabouts are their key advantages:
• Capacity increase at the intersection. The capacity at the turbo roundabout is higher ½ to 2 ½ times than the capacity at a one-lane roundabout, and 1 до 1 ½ times than the capacity at two-lane roundabouts (Campbell et al., 2012). Besides the results reported by Giuffrè et al. (2010), Yperman and Immers (2003) also reported global capacity gains of 12 – 20%, Engelsman and Uken (2007) estimated capacity gains for turbo roundabout to be between 25 – 35%.
• Decrease of delay. T he capacit y at turbo roundabouts is either equal or higher than the capacity at signalized intersections and thus the delay at turbo roundabouts is rarer (Campbell et al., 2012).
• Larger safety. Turbo roundabouts are safer than a give way intersection (number of fatal accidents and accidents with serious injuries is lower for about ±70%), they are safer than the intersections with traffic signals regulation (number of fatal accidents and accidents with serious injuries is lower for about 50%), but in comparison to the one-lane roundabouts there is 20% to 40% higher rate of accidents at turbo roundabouts
• Construction space. The spatial need (m²) necessar y for constructing a turbo roundabout is nearly as large as the one for constructing a signalized i nter sec t ion ( prov ided t h at t he signalized intersection offer two trucks driving in parallel, in all directions (Campbell et al., 2012).
• Costs. The construction of a turbo roundabout requires higher costs than the construction of signalized one, but the life cycle costs and social costs are less (Campbell et al., 2012).
The reconstruction of intersections into turbo roundabouts has become a kind of global trend nowadays. The first turbo roundabout in the Republic of Macedonia was designed in Skopje in 2011, without tracking the performances. This was exactly the motive to investigate the performances of this type of intersections.
In this research three intersections in sequence located in Ohrid (two signalized and one non-signalized intersection) and the performances are determined for the current situation and the situation with increased flows by using the software tool SIDRA. A reconstruction of the intersections has been made into turbo roundabouts (Giuffrè et al., 2010). The performances for two different cases (current situation and the situation with increased flows, with and without the pedestrians’ influence) are determined with the use of both VISSIM and analytical model by Brilon&Wu.
2. Review of Capacity Determining
Models
busiest entry lane has reached saturation (Hagring, 1998). To calculate the capacity, in 1997 the multilane roundabout explorer was developed by modification of the capacity model of Bovy (1991), which considered both separated lanes and pseudoconf lict. Because of its linear structure, this model did not take into account multilane roundabout properties in a good way. Therefore a new model was developed by modification of the model of Hagring (1998).
Using only the gap acceptance approach to calibrate the parameters is not sufficient because the pseudoconflict is not taken into account. An initial estimate of the capacity of the turbo roundabout was published by Fortuijn and Harte (1997).
This study was based on a modification of the model derived by Bovy (1991), which was chosen because it takes the effect of pseudoconflicts into account. For validation of an analytic model, it is important to realize that the distribution of gaps offered in two flows simultaneously is determined primarily by a stochastic process. Thus, it is possible to test the effect of the distribution of the flows over two circulatory lanes by using a microsimulation model.
2.1. Conflict Stream Models
These models are also known as empirical models. The linear or exponential relation bet ween t he ent r y capac it y a nd t he circulating flow is evaluated by the observed capacity.
The advantages of these models are as listed below:
• The measurements taken at conditions
of saturated flow are directly applicable;
• The impact of pseudoconflicts can be
taken into consideration.
The disadvantages of these models are as listed below:
• The connection between the entry and
the circulating f low can be evaluated only at conditions of saturated flow;
• Only simple relationships between
capacity and roundabout traffic can be calibrated. For instance, an advanced model of two-lane capacity cannot be calibrated upon the measured capacity because of the large number of variables included.
2.2. Gap Acceptance Models
The structure of these models is also macroscopic. However, the underlying theory is based on analysis of the behavior of drivers entering a major traffic flow from a minor traffic f low. The main variables are:
tc – critical gap and tF – follow-on time – drivers’ characteristic in entry lane;
tM – minimum headway between vehicles –
drivers’ characteristic on the circulatory lane.
As noted above, when dealing with turbo roundabouts it is useful to consider the effect of the f low split between the circulatory lanes. Hagring (1998) derived a general notation for gap acceptance models of roundabouts with more than one lane.
2.3. Simulation Models
W hen the estimations are made for an individual vehicle, this model is known as a microsimulation model.
VISSIM is a microscopic, time step and behavior-based simulation model developed to model urban traffic and public transport operations and f lows of pedestrians. The parameters that the user can modify (such as distribution of accepted and rejected gaps) are calibrated to match the key features of the gap acceptance model.
3. Features of Analyzed Intersections
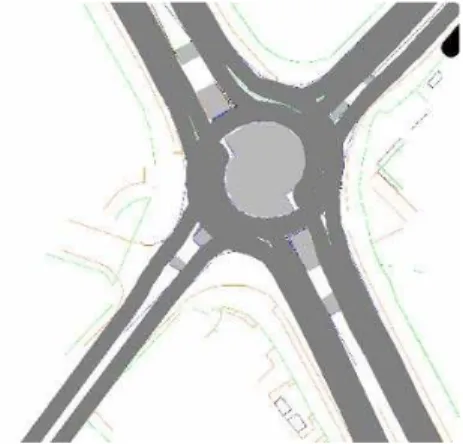
The analyzed intersections are located on the most loaded arterial traffic road in Ohrid – Blvd Turistička, out of which two intersections are signalized and the third is two – way STOP controlled intersection (Fig. 1). On the grounds of the conducted recording of the traffic, data has been obtained about the structure of the f low and the road traffic volume at peak hour (PАЕ/hour).
Fig. 1.
Macro Location of Intersections Source: Google Map
Table 1 displays the geometry of the existing intersections in SIDRA, the newly designed turbo roundabouts, and the data for road traffic volume according to direction. As the town of Ohrid is a tourist place, the
Table 1
Geometric Features and Traffic Volume at the Intersections
Existing intersections Turbo roundabouts Traffic volume
1.
2.
3.
Source: Gredoska (2015)
4. Application of Analytical and
Microsimulation Models for Determining
the Capacity of the Entry Lane at Turbo
Roundabouts
The capacity of the entry lane of the analyzed turbo roundabouts was determined with the application of the analytical model of Brilon&Wu and the microsimulation model VISSIM.
4.1. Analytical Determination of the
Capacity of Turbo Roundabouts – Model
of Brilon&Wu
of the roundabout (the central island, lane width, entry radius, etc.).
There have been longitudinal studies conducted in Germany for determining the capacity of the roundabouts.
For all types of roundabouts, except the Mini, capacities of entries to the circle have been established as independent from the flow at the other entries.
On the basis of the model given by Tanner, a proposed expression for determining the entry lane capacity at a roundabout came from Brilon et al. in 1997:
C= (1)
Where:
- C = basic capacity of one entry (PAE/h) - qk = traffic volume on the circle (PAE/h) - nc = number of circulating lanes
- ne= number of entry lanes the number of
entrance lanes - tg = critical gap (s) - tf = follow‐up time (s)
- tmin= minimum gap between succeeding
vehicles on the circle (s)
The following table displays the values of the time headway applied in this research for German drivers.
Table 2
Values of the Time Headway for German Drivers
Intersections Entry type Critical headway tc (s)
follow-up time tF (s)
Min. gap on the circle to (s)
IN1 4.5 2.5 1.9
Left and right lane
IN2 4.5 2.5 1.9
Single lane
IN3 4.3 2.8 2.0
Single lane
IN4
Left lane 4.0 2.6 1.9
Right lane 4.5 2.7 2.0
Source: Brilon (2008)
The capacity of the entry lane of a roundabout depends on the volume of the circulating f low and on the number of circular and
4.2. Determining the Impact of the
Pedestrians over the Capacity of the
Roundabouts According to the Model of
HCM
A s ide f rom t he c i rc u l at i ng f low, a considerable impact over the entry lane capacit y of the roundabouts have the pedestrians’ f lows. Generally speaking,
entry lane capacity is reduced with the increase of pedestrians’ volume. The model of HCM 2 010 qua nt i f ies t he pedestrians’ impact on the entr y lane capacity by applying the adjustment factor for pedestrian(fped). Tables 3 and 4 display the expressions by which pedestrians adjustment factor is determined at one-lane or two-one-lane roundabouts.
Table 3
One - Lane Entry Capacity Adjustment Factor for Pedestrian
Case One – lane entry capacity adjustment factor for pedestrian
If Vc, pce >881 fped =1
Else if nped ≤101 fped = 1-0,000137 nped
Else
Source: HCM (2010)
Where:
- fped = entry capacity adjustment factor for pedestrian
- nped= number of conflicting pedestrians per hour (pedestrians/hour)
- = conflicting vehicular flow rate in the circulatory roadway (PAE/hour)
Table 4
Two - Lane Entry Capacity Adjustment Factor for Pedestrian
Case Two – lane entry capacity adjustment factor for pedestrian
If nped < 100
Else
Source: HCM (2010)
Where:
- = entry capacity adjustment factor for pedestrian
- nped = number of conflicting pedestrians per hour (pedestrians/hour)
- = conflicting vehicular flow rate in the circulatory roadway (PAE/hour)
4.3. Estimation of Turbo Roundabouts
Performances by Using Microsimulation
Model
For determining the turbo roundabouts performances in this research, the VISSIM model was applied. This program conducts an analysis of the traffic operations when there are restrictions such as lane configuration, flow structure, traffic control, bus stops, etc. Thus, it was a useful tool for estimation of the various alternatives based on efficacy measures planning within the frames of traffic engineering.
The process of designing turbo roundabouts consists of several steps:
1. Traffic network design, 2. Vehicle inputs,
3. Routing decisions and routes (to direct traffic within the network),
4. Priority rules,
5. Defining the reduced speed areas Creating conflict areas.
Fig. 2 displays an excerpt of a roundabout design created in VISSIM.
Fig. 2.
Roundabout Design Created in VISSIM Source: Gredoska (2015)
The basic element of a VISSIM traffic network is a link representing a single (or multiple) lane roadway segment with a specific direction of flow. When the traffic network is designed
Fig. 3.
Vehicle Inputs
Source: Gredoska (2015)
Furthermore, the routes from each approach and from each entr y lane are defined.
Besides, the vehicles’ volume is also inserted for each of the routing decisions (Fig. 4).
Fig. 4.
Defining the Flow Routes Source: Gredoska (2015)
Fig. 5.
Once the routing decisions and routes have been defined, the priority rules are set. When setting the priorities, the critical gaps are inserted in accordance with the type of entry lane and then the allowed speed at the roundabout entry lane is defined (35 km/h). As pedestrians f low impact over the turbo roundabouts performance is also examined, pedestrians crossings are designed by means of links. The volume of the pedestrians’ flows is 50 pedestrians at the approach 1 and 3 (minor flow) and 250 pedestrians at the approach 2 and 4 (major flow). The priorities are set as well as the critical gaps of 3 to 6 seconds (Fig. 6) and
the conflict areas (Fig. 7). It is important to point out that pedestrians’ priorities are set to be in a way that once the pedestrians start crossing, the vehicle yield to pedestrians.
In the Republic of Macedonia, calibration and validation of critical gaps at turbo roundabouts have not been conducted. Upon the conducted research of the values of the critical gaps, in this case the values characteristics for German drivers have been used (Table 2). Due to certain similarities found in the driving modes – attentiveness when approaching this type of roundabouts has been used.
Fig. 6.
Defining the Reduced Speed Areas Source: Gredoska (2015)
The next step is defining the reduced speed areas (Fig. 6), and the last one is setting the conflict areas (Fig. 7).
Once t he t ra f f ic net work ha s been designed and all parameters necessary f o r d e t e r m i n i n g t h e r o u n d a b o u t s
performance have been used, simulations are performed (min. 10) to obtain the relevant data (Fig. 8).
Fig. 8.
Simulation in VISSIM Source: Gredoska (2015)
5. Analysis of the Performances of
the Existing Intersections and Turbo
Roundabouts
After the conducted analysis, data was obtained about the average delay, the level of
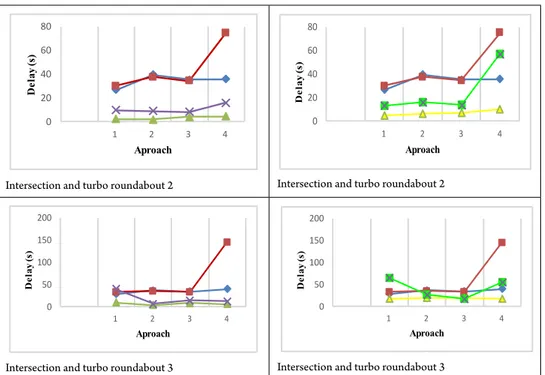
services, and the average travel speed. Table 5 shows a graph displaying the obtained results regarding the average delay at separate approaches to the existing intersections and to the turbo roundabouts – with and without pedestrians flow impact.
Table 5
Graph Display of Average Delay at Existing Intersections and Turbo Roundabouts with and without Pedestrians Flow Impact
Average delay (without pedestrians flow impact) Average delay (with pedestrians flow impact)
0 10 20 30 40 50 60
1 2 3 4
D
e
lay (s
)
Aproach
Intersection and turbo roundabout 1
0 10 20 30 40 50 60
1 2 3 4
D
el
a
y
(s)
Aproach
0 20 40 60 80
1 2 3 4
D
e
lay (s
)
Aproach
Intersection and turbo roundabout 2
0 20 40 60 80
1 2 3 4
D
e
lay (s
)
Aproach
Intersection and turbo roundabout 2
0 50 100 150 200
1 2 3 4
D
e
lay (s
)
Aproach
Intersection and turbo roundabout 3
0 50 100 150 200
1 2 3 4
D
el
a
y
(s)
Aproach
Intersection and turbo roundabout 3
Source: Gredoska (2015)
Legend:
Existing intersection
Existing intersection with increased flow
A turbo roundabout – current state without pedestrians flow impact
A turbo roundabout – state with increased volume without pedestrians flow impact A turbo roundabout – current state with pedestrians’ flow impact
A turbo roundabout – state with increased volume with pedestrians’ flow impact
O n t he g rou nd s of t he a n a l y s i s of average delay, we ca n conclude t hat turbo roundabouts offer smaller delay in comparison to the delay at current signalized intersections and two – way STOP cont rol led i ntersec t ion. It is important to mention that delay is smaller
when pedestrians’ flow impact is not taken into consideration. The average delay increase with the increase of the traffic and pedestrian flows.
Table 6
The Level of Service at Approaches and the Average Travel Speed
The level of service and the average travel speed
Intersection 1 intersection 2 Intersection 3
The level of service and the average travel speed
A turbo roundabout 1 A turbo roundabout 2 A turbo roundabout 3
Source: Gredoska (2015)
Legend:
Existing intersection and a turbo roundabout without pedestrians’ flow impact Existing intersection and a turbo roundabout with increased volumes without pedestrians’ flow impact
A turbo roundabout current state with pedestrians’ flow impact
A turbo roundabout with increased volumes with pedestrians’ flow impact
As for the level of service, from the results obtained, a conclusion can be drawn that there is a higher level of service at the turbo roundabouts than at the existing intersections, excluding the third turbo roundabout with increased volume and pedestrians’ flow impact which displays lower level of service. The average speed depends on the volume of traffic and pedestrian flows.
The higher the increase of these flows, the lower the average speed of the vehicles.
200 400 600 800 1000 1200 1400 1600 0 200 400 600 800 1000 1200 1400 E nt ery c apac it y (P A E /h)
Circulating flow (PAE/h) Brilon VISSIM
HCM/Brilon (pedestrian) VISSIM (pedestrian)
200 400 600 800 1000 1200 1400 1600
0 200 400 600 800 1000 1200 1400 E nt ery c apac it y (P A E /h)
Circulating flow (PAE/h) Brilon VISSIM
HCM/Brilon (pedestrian) VISSIM (pedestrian)
а) 50 pedestrians b) 250 pedestrians
200 400 600 800 1000 1200 1400 1600
0 200 400 600 800 1000 1200 1400 E nt ery c apac it y (P A E /h)
Circulating flow (PAE/h) Brilon VISSIM
HCM/Brilon (pedestrian) VISSIM (pedestrian)
c) 500 pedestrians Fig. 9.
Dependence of the Entry Lane Capacity on the Volume of the Circulating Flow and of the Pedestrians’ Flow (50, 250, 500 Pedestrians) According to the Model by Brilon and the One in VISSIM
Source: Gredoska (2015)
As the graph displays, at a rarer circulating f low and when pedestrians are not taken into consideration, the entry lane capacity according to the VISSIM model has higher values than Brilon’s model. With the increase of the circulating flows, the two models give nearly same values.
With a volume of 250 pedestrians, the
model of HCM/Brilon (pedestrian), though the difference between values obtained by the two models is small.
circulating flows. When the density of the traffic flow is high, pedestrians most often pass in between vehicles and through vehicles lines at the entrance to the intersection, thus insignificantly influencing the entry capacity. Therefore, capacity values of the three variants approximate one another.
6. Conclusion
The choice of intersection control mode is one of the most important decisions to be reached by traffic engineers. When making decision the traffic safety and capacity are key factors. When turbo roundabouts are in question, the research conducted worldwide shows that the advantages over the other types of intersections are the following: increased capacity, lower average delay, increased safety, etc.
On the bases of the conducted analysis with this research, it can be concluded that turbo roundabouts performances (delay, level of service, average travel speed, entry lane capacity) depend on the density of entry flows, the circulating flows, and the density of pedestrians’ flows.
At intensive traffic and pedestrians’ flows, pedestrians do influence the capacity. Thus, a jam occurs on the circulating lane flows, which causes saturation flow of vehicles on the entry lanes and increase of delays.
According to the used parameters, the analyzed turbo roundabouts offer better performances than the existing signalized intersections and two – way STOP controlled intersection.
References
Bovy, P.H. 1991. Zusammenfassung der schweizerischen Kreiselhandbuchs. Summary of the swiss guide to roundabouts. Available from Internet: uuid:05ae95bf-5f8b-4ca6-9370-4d194ce96126.
Brilon, W. 2008. Turbo – Roundabout – an Experience from Germany. In Proceedings of the National Roundabout Conference, 1-18.
Brilon, W.; Bondzio, L.; Wu, N. 1997. Unsignalized Intersections in Germany ‐ a State of the Art. Turbo
– Roundabout – an Ex perience from Germany.
In Proceedings of the 2nd International Symposium for Unsignalized Intersections, 61-70.
Campbell, D.; Jurisich, I.; Dunn, R. 2012. Improved multi – line roundabout designs for urban areas, Auck land Transpor t, Depar tment of Civ il and Environmental Engineering.
For tuijn, L .G.H.; Har te, V.F. 1997. Multilane Roundabouts: An Exploration of New Forms (in Dutch). Verkeerskundige werkdagen, CROW, Ede, Netherlands.
Fortuijn, L.G.H. 2009. Turbo roundabouts, Estimation of Capacity,Transportation Research Record: Journal of the Transportation Research Board, 2130: 83-92.
Fortuijn, L.G.H.2009. Turbo Roundabouts: Design Principles and Safety Performance,Transportation Research Record: Journal of the Transportation Research Board, 2096: 16-24
Gredoska, N. 2015. An evaluation of turbo roundabouts performances. Master thesis.St. Kliment Ohridski University, Bitola.
Hagring, O. 1998. Vehicle–Vehicle Interactions at Roundabouts and Their Implications for the Entry Capacity: A Methodological Study with Applications to Two-Lane Roundabouts. Doctoral thesis. University of Lund.
Transport Research Board. HCM 2010.
Engelsman, J.C.; Uken, M. 2007. Turbo roundabouts as an alternative to two lane roundabouts.In Proceedings of the 26th Annual Southern African Transport Conference, 9 -12.
Tollazi, T. 2015. Alternative Types of Roundabouts An Informational Guide. Springer International Publishing Switzerland. 206 p.
Yperman, I.; Immers, B. 2003. Capacity of a turbo – roundabout, determined by micro – simulation. In