Rotary bending fatigue behavior of A356 –T6
aluminum alloys by vacuum pressurizing casting
* Wan-qi Jie
Male, born in 1959, Ph.D, Professor. His research interests mainly focus on solidification theories of metallic materials and casting of light metals. First author Yong-qin Liu is a Ph.D. candidate under his supervising.
E-mail: jwq@nwpu.edu.cn
Received: 2014-12-19; Accepted: 2015-06-16
Yong-qin Liu1
, * Wan-qi Jie1,2
, Zhi-ming Gao 1
, Yong-jian Zheng 3
, Hai-jun Luo 1
, and Wen-tao Song 1
1. State Key Laboratory of Solidification Processing, Northwestern Polytechnical University, Xi’an, Shaanxi 710072, PR China 2. School of Aerospace, Mechanical and Manufacturing Engineering, RMIT University, Melbourne VIC 3001, Australia 3. Simulation and Modeling of Metallurgical Processes, Montanuniversitaet Leoben, 8700 Leoben, Austria
A
356 aluminum cast alloys are widely used in the fields of automobile and aerospace because of their advantages of light weight, good castability, attractive appearance, excellent mechanical properties and corrosion resistance [1-6]. In these industries, various inspections should be conducted to guarantee t h e s e r v i c e l i f e o f s t r u c t u r a l c o m p o n e n t s . T h e recognition of inevitable damage by dynamic stress, especially the ultimate failure by fatigue fracture, is one of the most important issues [1, 4]. Therein, the increasing use of high integrity shaped cast aluminum components under repeated cyclic loading has attracted considerable interest on the fatigue properties of cast A356 alloys [2, 7-9].Fatigue properties of aluminum cast alloys are strongly influenced by their casting defects, especially by porosity [10-11]. The evidence from S-N curves,
Abstract:
Vacuum pressurizing casting technique, providing better mould filling and inter-dendritic feeding, can reduce the porosity greatly in cast aluminum alloys, and improve the fatigue properties. The rotary bending fatigue properties of A356-T6 alloys prepared by vacuum pressurizing casting were investigated. The S-N curve and limit strength 90 MPa under fatigue life of 107 cycles were obtained. The analyses on the fatigue fractography andmicrostructure of specimens showed that the fatigue fracture mainly occurs at the positions with casting defects in the subsurface, especially at porosities regions, which attributed to the crack propagation during the fatigue fracture process. Using the empirical crack propagation law of Pairs-Erdogon, the quantitative relationship among the initial crack size, fatigue life and applied stress was established. The fatigue life decreases with an increase in initial crack size. Two constants in the Pairs-Erdogon equation of aluminum alloy A356-T6 were calculated using the experimental data.
Key words:
aluminum alloys; vacuum pressurizing casting; rotary bending fatigue; porosity; crack propagationCLC numbers: TG146.21 Document code: A Article ID: 1672-6421(2015)05-326-07
fractographies, microstructures and mechanical performances indicates that porosity defects in castings induce fatigue cracking and promote propagations of cracks [1, 8-10]. Numerous studies [8-9, 12-15] have shown that porosity reduces the incubation time of crack initiation through the high stress concentration region adjacent to this microstructural defect. Accordingly, the porosity is thus mainly responsible for decreasing the fatigue life of alloys. Generally speaking, porosity in alloys results from the incomplete feeding in the mushy zone, i.e. the
volume shrinkage associated with solidification cannot be compensated for by the inter-dendritic liquid flowing
Fig. 1: Schematic diagram of vacuum pressurizing casting experiment
1 Experimental procedure
1.1 Preparation and testing of fatigue
specimens
The base alloy was commercial A356 ingots, consisting of 7wt.% Si, 0.3wt.% Mg, 0.15wt.% Ti, 0.015wt.% Sr and the balance Al. The 0.015wt.%Sr(Al-10Sr) was added in the
form of master Al-10Sr alloy for eutectic Si modification. Mg
was increased to 0.35wt.% by adding pure Mg into the base material during melting to compensate for the burning loss. The alloy was melted in an induction furnace with a carbon crucible. Pure Mg was put into the melt when the temperature of the melt reached between 680-700 °C and was stirred clockwise by using of skimming ladle for composition uniform distribution. The melt was poured at 720 °C after degassing at 730-750 °C. The chemical composition of the experimental alloy is given in Table 1.
Table 1: Composition of experimental aluminum alloys (wt.%)
Si Mg Ti Sr Fe Mn Al
7.2 0.35 0.14 0.015 < 0.2 < 0.1 bal
The schematic diagram of the vacuum pressuring casting experiment is shown in Fig. 1. The specimens were cast in a resin bonded sand mould in the vacuum tank. Before pouring, the vacuum tank was pumped to 0.5 atm. After the mould
filling finished, the tank was quickly pressurized to 3 atm and kept for a certain time until the alloy was completely solidified.
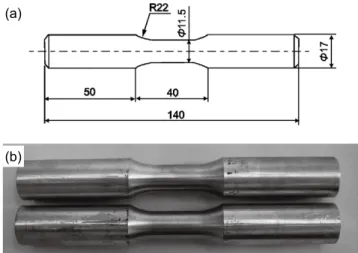
The castings were cylindrical with 190 mm length and 21 mm in diameter. After T6 treatment, cylindrical fatigue specimens with a parallel gauge section of 30 mm long and 11.5 mm in diameter (Fig. 2) were prepared according to the standard GB4337-84.
The rotary bending fatigue specimens were tested using a PQ-6 machine. All samples were tested at room temperature varying from 20 to 26 °C. The relative humidity was kept in the range 10%-25%. Various stress amplitudes and stress ratios (σ: 90, 100, 130, 170, 220 MPa; R = -1) were employed during the fatigue tests. Twenty-nine samples were tested, of which 4 specimens had not failed in up to 107 cycles.
Fig. 2: Geometry and picture of fatigue specimens for fatigue testing
1.2 Metallographic analysis
Standard metallographic techniques were used for quantitative metallographic analysis including the optical examination of the phase structures and porosity. Secondary dendrite arm spacing (SDAS) was measured by identifying and measuring aligned groups of the secondary dendrite cells and calculated as SDAS=L/nM, where L is the length of the line drawn from edge of the measured cells, n is the number of dendrite cells and M is the magnification.
The detailed morphology of porosity defects was revealed through the optical metallographic microscopy and SEM method.
1.3 Micro-fractographic observations
Micro-fractographic examination was carried out on the fracture surfaces of all the tested specimens using SEM (IEISS SUPRA 55). Fatigue crack initiators were identified for each specimen. X-ray energy disperse spectrum was used in determining the chemical constituents at fatigue crack initiation sites and other crack propagation regions.
2 Results
2.1 S-N curve
Results of the fatigue tests are shown in Fig. 3, where the total cycles of fracture is plotted against the alternating stress amplitude. The arrows indicate the unbroken specimens during fatigue tests. The S-N curves show a general trend that the fatigue life increases with a decrease in the cyclic stress amplitude. Fatigue strength at 107 cycles is usually defined as the fatigue limit and this value of A356-T6 alloys shaped by vacuum pressurizing casting technique in the present research is about 90 MPa.
2.2 Characteristic of rotary bending fatigue
fractography
Figure 4 shows the typical fracture surface of the present fatigue test samples. It can be seen that the initial crack occurred from region 1, propagated through region 2, and
finally fractured in region 3.
(a)
Fig. 3: S-N curve of Al-7Si-0.3Mg alloy sample with T6 heat treatment
Fig. 4: Typical characters of rotary bending fatigue fracture surface
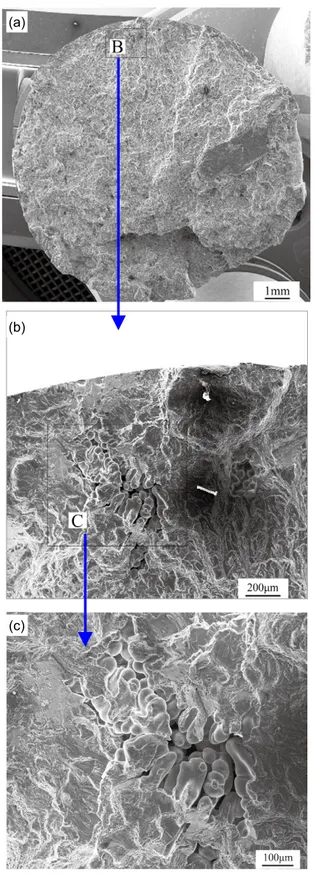
Fig. 5: (a) Macro-fractography of specimen under 220 MPa stress and fatigue life 4.8×10⁴
cycles, and magnified
pictures of zones (b) and (c) In initial crack region, i.e. region 1, porosity at the sample
surface acts as the main crack initiation site, and induces the fracture. The fatigue cleavage rivers spread into the centre of the sample from the defects. In the fatigue crack propagation region, river-like ridges and striations were observed for most of the samples, indicating ductile fracture of materials. In addition to the main fatigue crack, secondary cracks in the region of middle porosity were also seen in some samples, as shown in region 2. In overload regions, that is, region 3, the fracture surface was rough compared to the crack propagation region. Dimples, cracked eutectic particles were also observed on the fracture surface.
2.3 Fractography
Figure 5 shows the SEM fractography of A356-T6 alloy sample, which bears 220 MPa stress during the fatigue test and has a fatigue life of 4.8×10⁴ cycles. Figure 5(a) gives the macro morphology of the fracture surface. Zone B, marked in Fig. 5(a), presents a seriously rough topography with casting porosity. Figure 5(b) and (c) are the magnification of the marked zone B and zone C, respectively. It can be seen that the casting porosity is located in the subsurface and appears in the shape of dendrite arms spacing. Cleavage steps and rivers spread into other regions from the location of the porosity.
The fatigue fracture surface shows that the fracture occurred at the porosities near the sample surface for almost 90% of the samples examined. The porosities acted as the main crack initiation sites. The results agree with the viewpoint that the
initial crack first started at the groove-shaped roots instead of
other zones [3, 8].
The SEM fractography of specimens under 170 MPa loading (a)
(b)
is similar to that at 220 MPa, thus, the subsequent discussions will focused on the higher cycle fatigue (>104cycles), such as 130 and 100 MPa.
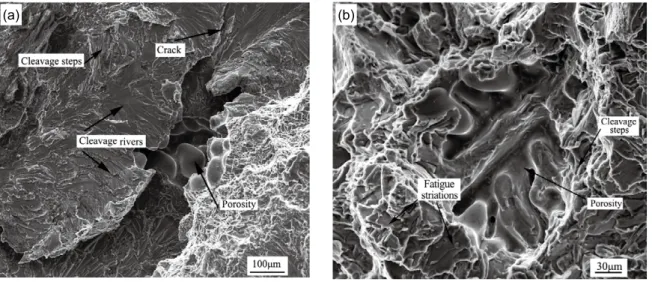
Figures 6(a) and (b) show the subsurface porosities. Cleavage steps obviously present around the porosities. It indicates that these porosities are the initiation sites of cracks. Some porosities inside the specimens were also found on the fracture surface, as shown in Fig. 7. The interior porosity, as shown in Fig. 7(a), is associated with a crack running through it. This phenomenon is believed to be related to the stress-concentration in the vicinity of interior porosities. However, compared to the porosities at the subsurface, there is no evidence of crack initiation at the interior porosity.
Fig. 6: Porosity at subsurface area of specimens: (a) 130 MPa, 5.79×10⁵
cycles, (b) 130 MPa, 7.23×10⁵
cycles
Around the interior porosity, numerous river patterns and cleavage steps are located in the flat topography of fracture sections. The typical patterns associated with stair-steps indeed indicate a cleavage fracture mode. Thus, the cleavage steps and rivers arrowed in Fig. 7(a) imply that the crack propagation paths formed at the groove-shaped roots of the dendrite structures, which surround the spatial spaces of porosity. Thus, the interior porosities contributed to the crack propagation but not crack initiation.
Figure 7(b) further shows the deduction of crack propagation discussed above, where cleavage steps and fatigue striations are clearly observed around the interior porosity.
Fig. 7: Crack propagation during fatigue fracture of specimen under 100 MPa, 5.89×10⁶
cycles
3 Discussions
3.1 Analysis on microstructures of specimens
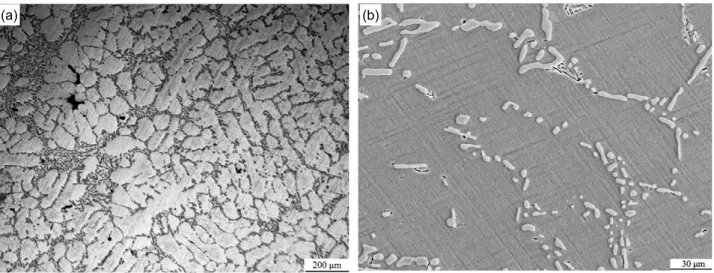
Microstructure examination of the failed component was carried out. The morphology of porosities was revealed through the optical metallographic analysis. A polished cross-section sample taken from the substrate around the fracture locations is shown in Fig. 8(a). It can be seen that
the casting porosity was formed at the junction of dendritic arms. Therefore, the porosity defects will suffer the stress concentration and acts as sources of cracks during the fatigue tests.
Stephanie, et al [9] concluded that, despite the significance of porosity in castings, the morphology of the solid eutectic microstructure determines the fatigue crack propagation. Once the crack tip enters a eutectic phase area, the propagation rate
(b) (a)
Fig. 8: Microstructure of A356 modified by Sr: (a) morphologies of primary grains, (b) morphology of eutectic
Si phase
will be decelerated due to the blocking effect of the silicon particles. The shorter and rounder silicon particles were recommended to improve fatigue property. Figure 8(b) shows the morphology of eutectic Si of A356-T6 alloy in the present
fatigue test. It is seen that the eutectic Si was well modified
and all shaped as spherical or short bars.
3.2 Effects of vacuum pressurizing casting
technique (VPCT) on fatigue life
Akiko [13] tested the rotary bending fatigue life of cast A356 with different dendrite arm spacing shaped by traditional casting in a sand mould. Figure 9 shows the comparison of fatigue life after T6 treatment between experimental results and the data of Akiko’s research. It shows that the VPCT gives the highest fatigue strength.
The mechanical properties of A356 shaped by VPCT and traditional casting technique (Akiko's research [13]) after T6 treatment are listed in Table 2. It can be seen that the specimen shaped by VPCT possesses properties superior to the traditional sand mould casting after T6 heat treatment.
Fig. 9: Comparison of fatigue life with data of Akiko’s test
Samples Tensile trength (MPa)
Elongation (%)
Brinell hardness HB
VPCT 270 4 90
Akiko’s research 237 2.5 86 Table 2: Comparison of properties of A356 alloy samples
after T6 treatment
3.3 Effects of porosity on crack initiation and
propagation
T h e i n v e s t i g a t i o n e v i d e n c e i n c l u d i n g f r a c t o g r a p h y, microstructure and mechanical performance indicated that porosity defects existing in the specimens induced the fatigue crack-initiations and initial propagations. Numerous fine fatigue striations indicated that the probable locations of crack initiation should be in the vicinity of subsurface porosities. According to the fracture mechanics, the presence of casting porosity will result in stress concentration in the surrounding matrix. Most of the porosities formed in the groove structure were confined by dendrite arms. In addition, these groove-shaped porosities have already formed crack tips before suffering repeated loading, which can largely shorten the time interval of fatigue crack initiation and provide crack propagation paths. Especially, the stress will be higher if the porosity locates at a subsurface rather than at the interior of the specimen [7-8, 14]. Based on the experimental data above, it is deduced that the larger-sized porosities at the surface locations dominated the fatigue failures of the alloys; the interior porosities contributed to the crack propagation.
3.4 Effect of porosity size on fatigue life and
constants in Pairs-Erdogon equation
There exists a critical porosity size for fatigue crack initiation, below which fatigue crack are initiated from other competing initiators, such as eutectic particles and slip bands. A fracture mechanics has been used to determine the number of cycles necessary to propagate a fatigue crack from a casting defect
to final fracture. The fatigue life of castings containing defects
can be quantitively predicted from the size of porosity. The
size of porosity on the fracture surface was quantified in terms of their projected areas. The radius of these areas was defined
as the porosity size.
The number of cycles required to propagate a long crack from an initial di to df at a fracture can be simply calculated
using the Pairs-Erdogon equation [8, 19] based on the crack growth rate and fracture toughness of the material,
where a is the initial crack length, N is number of cycles to failure, C and m are constants of materials. ΔK is the effective
stress intensity factor range, first proposed by Elber accounting
for the effect of crack closure,
where σa is the applied stress, F is the compliance calibration
factor of the crack and the values of 0.65 and 0.5 are chosen for surface defects and subsurface defects, respectively [18].
Substituting equation (2) into (1), we have
Assuming that the initial size of defects is di and the fracture
size is df, we have
and
During the fatigue fracture process in samples with small defects df >> di, the term can be calculated,
Thus, we have the quantitative relationship of fatigue life in the consideration of initial defect size and applied stress,
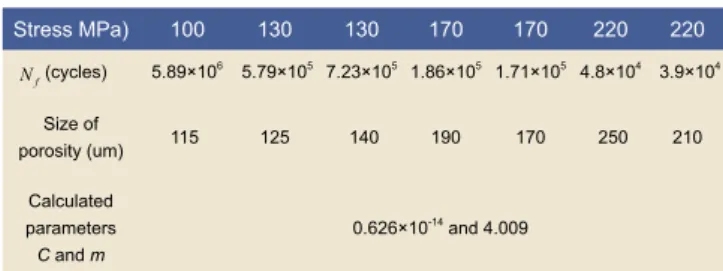
According to Eq. (7), we can see that the fatigue life will decrease when the initial porosities size increases with constant applied stress. At the same time, fatigue life also decreases with an increase in stress amplitude. The value of the constants
C and m of the present aluminum alloy A356-T6 were calculated from equation (7). Table 3 shows the experimental
data and fitting results.
Stress MPa) 100 130 130 170 170 220 220
(cycles) 5.89×10⁶ 5.79×10⁵
7.23×10⁵
1.86×10⁵
1.71×10⁵
4.8×10⁴ 3.9×10⁴
Size of
porosity (um) 115 125 140 190 170 250 210
Calculated
parameters
C and m
0.626×10⁻¹⁴ and 4.009
f
N
Table 3: Experimental data and fitting results
4 Conclusions
(1) The specimen shaped by vacuum pressurizing casting technique (VPCT) exhibits tensile properties superior to the traditional sand mould casting after T6 heat treatment.
(2) The S-N curve of rotary bending fatigue of A356 alloys shows that the limiting fatigue stress is no less than 90 MPa up to the life of 107 cycles.
(3) The fractography, microstructure and mechanical performances indicate that porosity defects in the samples introduce the fatigue crack initiations and promote the crack propagations.
(4) The quantitative relationship between the fatigue life, initial porosity size and applied stress is obtained. It shows that the fatigue life will decrease with an increase in initial crack size under a constant applied stress. The two constants in the Pairs-Erdogon’s law of aluminum alloy A356-T6 are calculated based on the experimental data.
References
[1] Skalleru D B, Iveland T and Harkegard G. Fatigue life assessment of aluminum alloys with casting defects. Eng Fract Mech., 1993 (44): 857-874.
[2] Couper M J, Nesson A E, and Griffith J R. Casting defects and the fatigue life of an aluminum casting alloy. Fatigue Fract Eng Mater Struct., 1990 (13): 213-227.
[3] Mo Defeng, He Guoqiu, Hu Zhengfei, et al. Effect of Porosity on Fatigue Property in Aluminum Cast Alloys. Journal of Materials Engineering, 2010 (7): 92-96.
[4] Mi Guofa, Liu Yanlei, Zhao Hengtao, et al. Numerical simulation and optimization of Al alloy cylinder body by low pressure die casting. China Foundry, 2008, 5(2): 99-103. [5] Unterreiter Guenter, Ludwig Andreas, and Wu Menghuai.
Numerical microstructure prediction for an aluminium casting and its experimental validation. China Foundry, 2011, 8(3): 331-336.
[6] Wu Wei, Dai Li, Che Xin, et al. Low cycle fatigue behavior of die cast Mg-Al-Mn-Ce magnesium alloy. China Foundry, 2013, 10(6): 380-384.
[7] Li Bo, Shen Yifu, and Hu Weiye. Casting defects induced fatigue damage in aircraft frames of ZL205A aluminum alloy - A failure analysis. Materials and Design, 2011 (32):
2570-2582.
[8] Wang Q-G, Apelian D, and Lados D A. Fatigue behavior of A356-T6 aluminum cast alloys. Part 1. Effect of casting defects. Journal of light metals, 2011 (1): 73-84.
[9] Stephanie S, Alexander G, Wilhelm M, et al. Influence of the microstructure on the fatigue damage behaviour of the aluminum cast alloy AlSi7Mg0.3. Materials science and
Engineering A, 2013, 565: 21-26.
[10] Sonsino C M and Ziese J. Fatigue strength and applications of cast aluminum alloys with different degrees of porosity. International Journal of Fatigue, 1993 (15): 75-83.
[11] Kwai S Chan, Peggy Joans, and Qigui Wang. Fatigue crack growth and fracture paths in sand cast B319 and A356 aluminum alloys. Materials science and Engineering A, 2003, 341: 18-34.
[12] Savaidis G, Savaidis A, and Samasphyros G T. On size and technological effects in fatigue analysis and prediction of engineering materials and components. International Journal of Mechanical Sciences. 2002 (44): 521-543.
[13] Akiko T, Taishi N, and Yoshihiko U. Fatigue Limit Prediction of Large Scale Cast Aluminum Alloy A356. Procedia Materials Science, 2014, 3: 924-929.
[14] Ammar H R, Samuel A M, and Amuel F H S. Porosity and the fatigue behavior of hypoeutectic and hypereutectic aluminum
casting alloys. International journal of fatigue, 2008 (30): 1024-1035.
[15] Gerard D A and Koss D A. The dependence of crack initiation on porosity during low cycle fatigue. Materials science and Engineering A, 1990, 129: 77-85.
[16] Liu Yongqin, Jie Wanqi, Gao Zhiming, et al. Investigation on the formation of microporosity in aluminum alloys. Journal of Alloys and Compounds, 2015, 629: 221-229.
[17] Lee P D, Chirazi A, and See D. Modeling microporosity in aluminum-silicon alloys: a review. Journal of Light Metals, 2001 (1): 15-30.
[18] Pelton A R, Decker J F, Vien L, et al. Rotary-bending fatigue characteristics of medical grade Nitinol wire. J Mech Behav Biomed Mater, 2013 (27): 19-32.
[19] Lu Liantao, Li Wei, Zhang Jiwang, et al. Analysis of rotary bending gigacycle fatigue properties of bearing steel GCr15. Acta Metallurgica Sinica, 2009 (45): 73-78.