www.atmos-chem-phys.net/17/1775/2017/ doi:10.5194/acp-17-1775-2017
© Author(s) 2017. CC Attribution 3.0 License.
Cleaning up the air: effectiveness of air quality policy for SO
2
and
NO
x
emissions in China
Ronald J. van der A1,2, Bas Mijling1, Jieying Ding1,3, Maria Elissavet Koukouli4, Fei Liu1, Qing Li5, Huiqin Mao5, and Nicolas Theys6
1Royal Netherlands Meteorological Institute (KNMI), De Bilt, the Netherlands 2Nanjing University of Information Science and Technology, Nanjing, P.R. China 3Delft University of Technology, Delft, the Netherlands
4Laboratory of Atmospheric Physics, Aristotle University of Thessaloniki, Thessaloniki, Greece 5Satellite Environment Center, Ministry of Environmental Protection, Beijing, P.R. China 6Belgian Institute for Space Aeronomy (BIRA-IASB), Brussels, Belgium
Correspondence to:Ronald J. van der A ([email protected])
Received: 24 May 2016 – Published in Atmos. Chem. Phys. Discuss.: 31 May 2016 Revised: 6 January 2017 – Accepted: 9 January 2017 – Published: 6 February 2017
Abstract. Air quality observations by satellite instruments are global and have a regular temporal resolution, which makes them very useful in studying long-term trends in at-mospheric species. To monitor air quality trends in China for the period 2005–2015, we derive SO2columns and NOx emissions on a provincial level with improved accuracy. To put these trends into perspective they are compared with pub-lic data on energy consumption and the environmental poli-cies of China. We distinguish the effect of air quality regu-lations from economic growth by comparing them relatively to fossil fuel consumption. Pollutant levels, per unit of fossil fuel, are used to assess the effectiveness of air quality regu-lations. We note that the desulfurization regulations enforced in 2005–2006 only had a significant effect in the years 2008– 2009, when a much stricter control of the actual use of the installations began. For national NOx emissions a distinct decreasing trend is only visible from 2012 onwards, but the emission peak year differs from province to province. Unlike SO2, emissions of NOxare highly related to traffic. Further-more, regulations for NOx emissions are partly decided on a provincial level. The last 3 years show a reduction both in SO2 and NOx emissions per fossil fuel unit, since the au-thorities have implemented several new environmental regu-lations. Despite an increasing fossil fuel consumption and a growing transport sector, the effects of air quality policy in China are clearly visible. Without the air quality regulations the concentration of SO2 would be about 2.5 times higher
and the NO2 concentrations would be at least 25 % higher
than they are today in China.
1 Introduction
Satellite instruments can monitor air quality from space by mapping, for example, aerosols and tropospheric ozone, but they are especially useful for emission estimates in observ-ing the relatively short-livobserv-ing gases nitrogen dioxide (NO2)
and sulfur dioxide (SO2). For these two trace gases
im-proved data sets have recently become available, enabling analysis of air quality time series on a national or provin-cial level with improved accuracy. Theys et al. (2015) pre-sented a new data set of SO2column densities derived from
the Ozone Monitoring Instrument (OMI) satellite instrument (Levelt et al., 2006). They conclude that the SO2
concentra-tions derived from OMI agree on average within 12 % with ground observations. This data set strongly improves on ear-lier SO2data sets from satellites, which motivated this study.
For NO2, instead of using concentration data, we directly
as-sess the emission data of nitrogen oxides (NOx=NO2+NO)
Figure 1.Location of power plants in China according to REAS v.2 (Kurokawa et al., 2013). The size of each dot indicates the emission of the power plants (power plants in close proximity are combined in a single dot). In addition, a list is given of the provinces mentioned in this study.
China is one of the largest emitters of SO2and NO2into
the atmosphere because its large economy depends heavily on fossil fuels as an energy source. China alone is responsi-ble for about 30 % of the total global emissions of SO2into
the atmosphere (Klimont et al., 2013), while over 90 % of the SO2emissions are caused by coal consumption in China
(Chen and Xu, 2010). Coal is mainly used by thermal power plants and in energy-intensive industry (e.g. steel, cement, and glass), and to a lesser extent residentially. SO2is also
re-leased by the use of oil and natural gas, but the sulfur content in these fuel types is much lower. Of these sources, power plants are responsible for about 30–40 % of all emissions and industry for another 50–60 % (He et al., 2012; ChinaFAQs project, 2012). According to the Multi-resolution Emission Inventory for China (MEIC) (http://www.meicmodel.org/) the source of SO2emissions in 2010 was 29.4 % from power
plants, 57.7 % from industry, 11.7 % from residential, and 1.2 % from transport. Figure 1 shows the location of the 600 largest thermal power plants on the map of China, in-cluding a list of provinces mentioned in this study. At a global scale, volcanic activity is another important source of atmospheric SO2. However, plumes of active volcanoes are
seldom observed over China.
NOx is released by more or less the same anthropogenic sources, i.e. the burning of coal or oil. The main difference to SO2is that traffic is a much more important source for NOx. NOx emission factors (i.e. emissions per fossil fuel unit) in the transport sector are generally much higher than emission
factors in energy and industry, which makes traffic one of the major sources of NOx in China. According to the MEIC in-ventory, 25 % of NO2in 2010 was released by traffic, 32 %
by power plants, 4 % by residential sources and 39 % by in-dustry, with the cement industry being the largest emitter in this sector.
To reduce SO2in China, the authorities have implemented
several environmental regulations. The most important reg-ulation was the desulfurization of coal-fired power plants in 2005/2006 (Xu, 2011). This was later followed in the 12th five-year plan (2011–2015) by stricter control on the im-plementation of the regulations; additional filtering efforts; switching to low-sulfur coal and petrol; phasing out obso-lete capacity in coal-using industry; phasing out small-scale coal mining; and gradually using more oil, gas, and renew-able energies instead of coal from 2011 onward. An overview of all regulations related to SO2is shown in Table 1, which
includes the year in which the implementation began. The regulation of NOx was started much later than for SO2. The 12th five-year plan mentioned the intention to
re-duce NO2by 10 % (target) (ChinaFAQs project, 2012); from
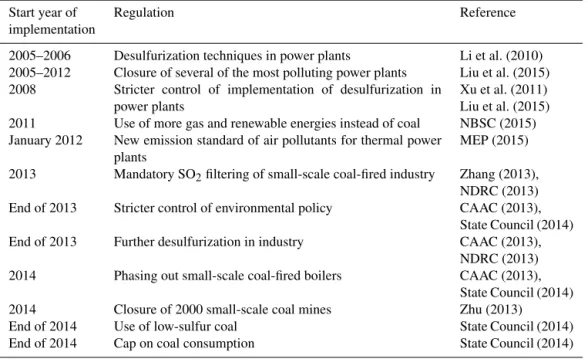
equip-Table 1.Environmental regulations of the Chinese national government to reduce SO2in the air.
Start year of Regulation Reference
implementation
2005–2006 Desulfurization techniques in power plants Li et al. (2010) 2005–2012 Closure of several of the most polluting power plants Liu et al. (2015) 2008 Stricter control of implementation of desulfurization in
power plants
Xu et al. (2011) Liu et al. (2015) 2011 Use of more gas and renewable energies instead of coal NBSC (2015) January 2012 New emission standard of air pollutants for thermal power
plants
MEP (2015)
2013 Mandatory SO2filtering of small-scale coal-fired industry Zhang (2013), NDRC (2013) End of 2013 Stricter control of environmental policy CAAC (2013),
State Council (2014) End of 2013 Further desulfurization in industry CAAC (2013),
NDRC (2013) 2014 Phasing out small-scale coal-fired boilers CAAC (2013),
State Council (2014) 2014 Closure of 2000 small-scale coal mines Zhu (2013)
End of 2014 Use of low-sulfur coal State Council (2014)
End of 2014 Cap on coal consumption State Council (2014)
Table 2.Environmental regulations of the Chinese national government to reduce NOxemissions.
Year of Regulation Reference
implementation
2011–2015 Installation of selective catalytic reduction (SCR) equipment at power plants; in 2013 the SCR equipment was installed in about 50 % of all power plants
Liu et al. (2016b), CAAC (2013)
2007 China 3 (Euro 3) emissions standards for cars, nationwide Wu et al. (2017) 2011 China 4 (Euro 4) emissions standards for gasoline cars, nationwide Wu et al. (2017) 2015 China 4 (Euro 4) emissions standards for diesel cars, nationwide Wu et al. (2017)
ment in power plants are expected to reduce the emissions of the power plant by at least 70 % (ICAC, 2009). The SCR in-stallation is the most significant measure taken to reduce the NOxemissions, and it largely coincides with the peak year of observed NO2concentrations (Liu et al., 2016b). At the same
time, China has implemented several new national emission standards for cars during the time period of our study (see Table 2). The change from China 3 to China 4 standard for cars in the period 2011–2015 reduces the maximum allowed amount of NOxemissions for on-road vehicles by 50 % (Wu et al., 2017). More strict regulations for on-road vehicles (e.g. a ban on older polluting cars) were introduced on a city level, e.g. in Beijing, rather than nationwide. To our knowledge no regulations for ship emissions have been announced. Strong regulations have also been enforced during specific events like the Olympic Games in 2008, the Shanghai World Expo in 2010, the Nanjing Youth Olympic Games in 2014, and the APEC meeting in 2014, but those regulations were mostly of a temporary nature as shown by, for example, Mijling et al. (2013) for the Olympic Games in 2008.
To study the efficiency of the environmental policies, we analysed satellite observations of SO2and tropospheric NO2
of the last 11 years. SO2 satellite observations over China
have been studied earlier by Lee et al. (2011), Li et al. (2011), He (2012), Yang et al. (2013), Fioletov et al. (2015), and Krotkov et al. (2016). Satellite observations are very use-ful for SO2trend studies, as recently McLinden et al. (2016)
showed that bottom-up inventories are underestimating SO2
emissions worldwide by about 0–10 %. NO2 satellite
ob-servations over China have been evaluated by, for exam-ple, Richter et al. (2005), van der A et al. (2006), Zhang et al. (2012), and Krotkov et al. (2016). All these studies showed a strong increase in NO2 over East China. On a
city scale or regional level, trends are analysed and reported by Gu et al. (2013), Schneider et al. (2015), and Duncan et al. (2016). Although some cities have already showed a de-creasing trend, notably in the Pearl River Delta, an overall decrease in NO2concentrations in China has only recently
for variability in NO2, several authors have evaluated NOx emissions instead. Emission estimates of NOx over China have been analysed by Stavrakou et al. (2008), Kurokawa et al. (2009), and more recently by Mijling et al. (2013) and by Liu et al. (2016a).
In these studies, whether of concentrations or emissions, linear trends of the air pollutants are often used. Here, how-ever, we will relate changes derived on a provincial level for China to the energy consumption and the environmental policies of the country. This gives insight into the efficiency of the applied air quality policies and regulations. We apply this to NOx emissions instead of concentrations for the pe-riod 2007 until 2015. The comparison of SO2 trends with
those of NOx emissions enables us to distinguish environ-mental policies specifically applied on coal-based industry and power plants with general environmental measures and trends in traffic.
2 Observational data
2.1 Satellite observations of SO2
SO2is observed in the UV spectral range of satellite
observa-tions of SCIAMACHY (on Envisat), GOME-2 (on METOP-A) and OMI (on EOS-AURMETOP-A). SO2retrieval algorithms have
been developed earlier for GOME-1 by Eisinger and Bur-rows (1998), for SCIAMACHY by Lee et al. (2008), and for GOME-2 and OMI by Krotkov et al. (2006). Recently a new retrieval algorithm has been developed (Theys et al., 2015) that improves the precision of the SO2data for OMI
by a factor of 2, allowing us to derive more accurate trends based on OMI. The retrieval method is based on a differen-tial optical absorption spectroscopy (DOAS) scheme to de-termine the slant columns from measured spectra in the 312– 326 nm spectral range, which are then background-corrected and converted to vertical columns using an air mass fac-tor (AMF). The AMF is calculated with the radiative trans-fer model LIDORT (LInearized Discrete Ordinate Radia-tive Transfer model). More details about the retrieval proce-dure are described in Theys et al. (2015). The operational algorithm of NASA for SO2 from OMI has also recently
been improved. This algorithm and the algorithm of Theys et al. (2015) have a very comparable performance as shown by Fioletov et al. (2016). For this study, the algorithm of Theys et al. (2015) has been applied to the observations of the OMI instrument (Levelt et al., 2006) for its whole mission from 2004 onwards.
To improve the quality of the OMI SO2 data we exclude
observations with a cloud fraction of more than 50 % or with a fitting chi-square higher than 1. The solar zenith angle is limited to 75◦
and the viewing angle to 50◦
. Since the OMI instrument has been suffering from the so-called row anomaly since 2007 (KNMI, 2012), we filter the affected
rows (24–49, 54–55) in the same way for all years in the time series.
As we focus on anthropogenic SO2, the SO2 data for
15 June–9 July 2011 have been removed because of contami-nation with volcanic SO2from the eruption of the Nabro
vol-cano in Africa and the transport of its plume to China (Brenot et al., 2014).
As a first step in our study we have made monthly means for the whole data set by averaging and gridding the data to a resolution of 1/8◦
by 1/8◦
. The gridding algorithm takes into account the area of each satellite footprint overlapping the grid cell. The resulting data set is a time series of monthly means for the time period October 2004 to December 2015.
For comparison we also use the official ESA SCIA-MACHY/Envisat SO2 version product SGP 5.02; and the
standard data from the GOME-2/Metop-A version GDP 4.7, as developed within the EUMETSAT Satellite Application Facility for Atmospheric Composition and UV radiation (O3MSAF) project and distributed by http://atmos.caf.dlr.de/ gome2/. The data of these instruments are noisier than the OMI data sets because of the lower spatial coverage, different fit window, and the lower signal-to-noise ratio of the SCIA-MACHY and GOME-2 instruments. Therefore, their quality-controlled monthly mean SO2data have been recalculated by
spatially averaging, for each grid cell, the data from the eight surrounding neighbouring cells, hence creating a smoothed SO2field. For details on the methodology and findings, refer
to Koukouli et al. (2016).
2.2 NOxemission estimates from satellite observations
For NOx emission data we use the results of an update (version 4) of the DECSO (Daily Emission estimates Con-strained by Satellite Observation) algorithm developed by Mijling and van der A (2012). DECSO calculates emissions by applying a Kalman filter for the inversion of satellite data and a regional chemical transport model (CTM) for the for-ward model calculation. It takes transport from the source into account with a semi-Lagrangian approach. The CTM we use is CHIMERE v2013 (Menut et al., 2013) with meteoro-logical information from the European Centre for Medium-Range Weather Forecasts (ECMWF) with a horizontal reso-lution of approximately 25 km×25 km. The DECSO
algo-rithm is applied to OMI NO2 observations derived by the
DOMINO v.2 algorithm (Boersma et al., 2011). The latest improvements of the DECSO algorithm resulting in version 4 are described by Ding et al. (2015, 2016a). The monthly average emission data over China we use are available at 0.25◦
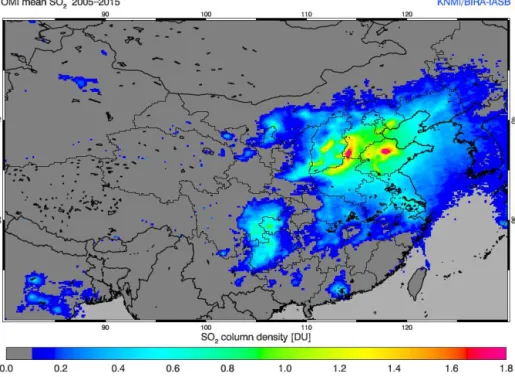
Figure 2.Average SO2concentrations for the period 2005 to 2015 as observed by the OMI satellite instrument. Data below 0.1 DU are masked (grey).
3 Temporal analysis over China
3.1 Sources of SO2and NOxin China
The multi-annual mean of SO2for 2005–2015 is shown in
Fig. 2. As the lifetime of SO2 is relatively short (typically
4–48 h) (Lee et al., 2011; Fioletov et al., 2015); the observed SO2concentrations are a good proxy for the location of SO2
emissions. Regions with large SO2concentrations are south
Hebei, the province of Shandong (around the city of Zibo) and the region around Chongqing. South Hebei is a region with many power plants just east of the mountainous coal-mining area in Shanxi. The hotspot in the Shandong province is related to a strongly industrialized area with substantial coal-using industry. Both coal mines and heavy industry are located in the Chongqing region.
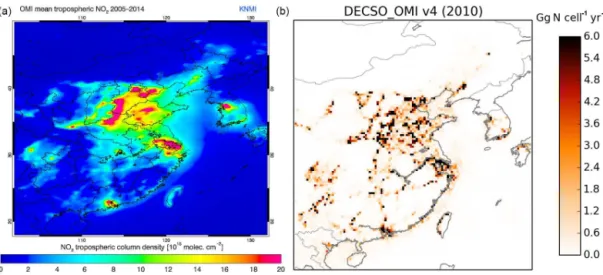
Rather than located at hotspots, high NO2concentrations
are more distributed over the east of China, mainly because traffic is an important source of NOxemissions (see Fig. 3a). The underlying NOx emissions are shown in Fig. 3b. Like the SO2concentrations, NOxemission spots can be found at the location of large power plants. Also clearly visible are the megacities of China, ship tracks along the coast, and sources along the large rivers.
3.2 SO2trends over China
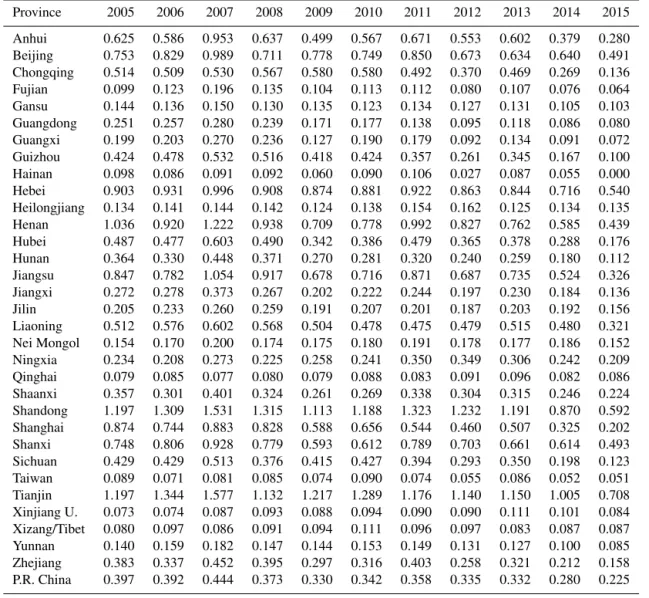
To construct time series of SO2 we have averaged the data
to annual means of the vertical columns derived from OMI. From these annual mean SO2 data we constructed time
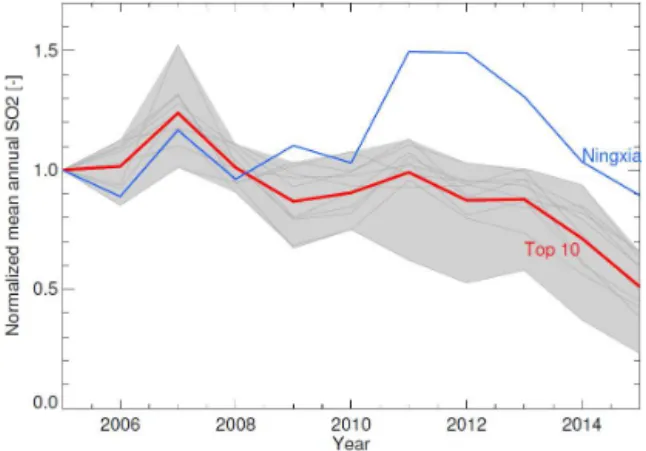
se-ries for each province (see Table A1). Figure 4 shows the mean normalized time series for the 10 provinces with the highest total SO2column densities (i.e. Tianjin, Shandong,
Hebei, Shanxi, Henan, Beijing, Jiangsu, Shanghai, Anhui, and Liaoning), together responsible for 60 % of all ambient SO2in China. The individual time series are drawn as thin
grey lines. The minimum and maximum of these time series for each year are shown in the grey shaded area to indicate the variability. The time series of Shanghai is the lowest grey line of the 10 series; thus the reductions have been strongest in this province since 2005. Apart from Ningxia province, all provincial time series show very similar patterns. In general, the SO2concentrations were at a maximum in the year 2007,
when the start of a decreasing trend is visible in China. De-spite some fluctuations the SO2 concentrations remain
rel-atively constant from 2010 until 2013, whereafter they are decrease again.
A different trend is observed for Ningxia, a province in the mid-northern region of the country with a relative low pop-ulation density and large coal resources. Here an increasing trend emerges for the years starting from 2010, when several new coal power plants were put into operation. A list of the largest power plants (with a capacity of more than 600 MW) and the start year of their operation is shown in Table 3. From 2012 onward, the more stringent SO2emission regulations
Figure 3. (a)The averaged tropospheric NO2concentrations over China measured by OMI in the period 2005–2014.(b)The NOxemissions in the year 2010 derived from OMI satellite observations.
Table 3.Main power plants in Ningxia province (> 600 MW). Data collected from www.sourcewatch.org.
Power plant Capacity (MW) In operation since Remark
CPI Linhezhen 700 unknown
Daba-1 1200 < 2000
Daba-2 1100 unknown An extension of Daba-1
Ningxia Zhongning-2 660 2005–2006
Guodian Shizuishan-2 1980 2006
Ningdong Maliantai 660 2006
Huadian Ningxia Lingwu units 1 and 2 1200 2007
Guodian Dawukou 1100 2010 Extension of the original 440 MW plant
Guohua Ningdong 660 2010
Ningxia Liupanshan 660 2010
Huadian Ningxia Lingwu units 3 and 4 2120 2010–2011
Shenhua Yuanyang Lake 1320 2010–2011
Shuidonggou 1200 2011
Ningdong Younglight 660 2013
3.3 NOxemission trends over China
National NOx emission trends show a different pattern than those of SO2. We observe an increasing trend until about
2012, with the exception of the year 2009, which is related to regulations started at the Olympic Games in 2008 (Mijling et al., 2009) and the global economic crisis, which briefly slowed down Chinese economic growth. Total NOx emis-sions in East China reached their peak levels in 2012, and have stopped increasing since this year. While the economy kept growing after 2012, the emission of NOx slowly creased again as a result of the air quality regulations de-scribed in Sect. 1. According to the DECSO emission inver-sion, in 2015 the NOxemissions were 4.9 Tg N yr−1, which is 22.8 % lower than in the peak year, 2012. However, the 2015 emissions were still 14.1 % higher than in the refer-ence year, 2007. The trends per province (see Table A2)
show very similar patterns, with only the starting year (the year with maximum NOxemissions) of the decrease in emis-sions varying over the provinces. Events like the Olympic Games in Beijing in 2008 and the World Expo in Shanghai in 2010, when temporary strict air quality regulations were enforced, can be recognized in this table as years with sig-nificantly lower emissions for these provinces. In Fig. 5a, the normalized (to the year 2007) time series of annual NOx emissions for East China (102–132◦
E, 18–50◦
N) is shown in similar way to SO2 in Fig. 4. The mean, minimum and
Figure 4. Time series (red line) of the annual mean of the 10 provinces with the highest SO2 concentrations derived from the OMI satellite observations. The time series are normalized to their value in 2005. The grey area indicates the maximum range of the in-dividual values of the times series of each of the 10 provinces. The thin grey lines show the individual time series of those provinces. The province of Ningxia has a distinct deviating trend, here shown in blue.
where air pollution regulations, e.g. for traffic, received a lot of attention at an early stage, like Beijing and Shang-hai, reached their maximum before 2011. Most industrial-ized regions show their peak in the years 2011–2013. Some of the less developed and populated provinces show a maxi-mum in 2014, which means that their decrease in NOx emis-sions is very recent. Regional variations are mainly due to the fact that regulations for the NOxemission reductions, for instance in traffic or power plants, are determined and im-plemented on a provincial level (Liu et al., 2016b). For the province of Ningxia we see a pattern occuring that is very similar to that of SO2, which shows for this
low-population-density province that traffic plays a small role and the trend is determined by the operation of newly built power plants. 3.4 Air pollution in relation to fossil fuel consumption
To relate the observed SO2 and NOx reduction to environ-mental regulations we have to take into account the coal and oil consumption in the same time period. The total coal con-sumption in standard coal equivalent (SCE) units per year for China and the total oil consumption (also in SCE units) are shown in Fig. 6, based on data of NBSC (2015). Accord-ing to Guan et al. (2012) and Hong et al. (2016) the sum of coal consumption of all provinces is more accurate than the number provided for the whole of China; thus we use the provincial totals for coal consumption. For NOx emissions the transport sector plays an important role; ships especially are one of the largest NOxemitters per fuel unit in the trans-port sector. The total freight transtrans-port almost doubles every 6 years in China.
Since the burning of coal and oil constitutes the dominant sources of SO2and NOxemissions, we can consider the total
emissions of these air pollutants as the product of the national use of coal and oil (activity) and the average emission factor of one unit of coal/oil. The effectiveness of environmental regulation will be reflected in a decrease in this emission factor. Therefore, we divide the annual SO2 column
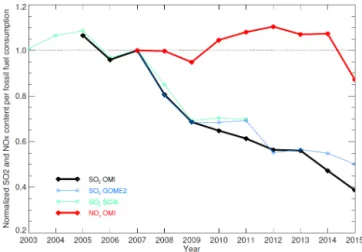
mea-sured from satellites and the annual NOx emissions by the annual coal and oil consumption in China. In this way we get a measure of the emitted SO2or NOx per unit (SCE) of fossil fuel consumption reflecting the Chinese environmen-tal policy. The results are shown in Fig. 7. One might argue that SO2is more related to coal than oil, but division by only
coal yields the same results. In our analysis we omit gas con-sumption since this is very limited in China and hence does not affect the results significantly.
We focus here mainly on the results for OMI, because of the instrument’s high spatial resolution and lack of in-strumental degradation. However, SO2 data of the
SCIA-MACHY and GOME-2 instrument are also added in Fig. 7 to be able to further look into the past (starting in 2003) and to verify the results of OMI. The SO2data of SCIAMACHY
and GOME-2 are averaged over the summer months (April– September). The remaining monthly means are excluded from the analysis due to a lower accuracy at higher latitudes, and a large part of the higher latitudes is missing due to snow cover. For OMI each data point is averaged over 12 months and the total area of China, which reduces the root-mean-square error to a negligible level. Biases among all instru-ments are removed by normalizing the values to those in ref-erence year 2007. Up to 2009, the results agree fairly well. After 2009, we see the results of GOME-2 and OMI for SO2
slowly diverge in time, which might be a result of the instru-ment degradation of the UV spectra of GOME-2 after 2009 (Munro et al., 2016).
Changing weather conditions from year to year can af-fect the results for SO2 concentrations, and when the
weather conditions are different during the overpass of SCIAMACHY and GOME-2 (around 09:30 LT, local time) than those at the overpass of OMI (around 13:30 LT), this can lead to differences between the instruments. The global cov-erage of SCIAMACHY is once every 6 days and for GOME-2 and OMI almost daily. The limited number of samples for SCIAMACHY makes these data more sensitive to weather conditions. Note that, due to the nature of the inversion algo-rithm, the NOx emission data are in general not sensitive to meteorological variability.
For SO2 we see a large decrease in the years 2008 and
2009, while the desulfurization programme of the 11th five-year plan had already started in 2005/2006, when the authori-ties began to reduce SO2emissions by installing
desulfuriza-tion devices in many power plants (Lu et al., 2010). In 2006 SO2monitoring devices were also installed in the chimneys
of the power plants. This resulted in a decrease in SO2
emis-sions from 2006, while the much larger decrease in SO2in
Af-Figure 5. (a)The annual total NOxemission estimates for the last 9 years for the top 10 highest NOx-emitting provinces in East China. Emis-sions are derived with DECSO V4 using OMI observations. The thin grey lines show the individual time series of those provinces.(b)Peak year of the NOxemissions per province.
Figure 6.In black the annual coal consumption. In red the annual oil consumption for China.
ter 2009, the SO2content per consumed coal unit only slowly
decreases until 2011. From 2012 onwards we see a stronger annual decrease in SO2. This coincides with the 12th
five-year programme; when new measures were taken to upgrade the coal quality, to modernize the industry, and to put more effort on law enforcement. The enforcement of laws in the last few years concerning the prohibition of flue gas bypass and the use of desulfurization devices in the steel industry played an especially important role.
For the NOxemissions the total annual emissions are used and divided in the same way as for SO2 by the total coal
and oil consumption. Here, however, we should keep in mind that the transport sector (especially by shipping) emits much more NOxper fuel unit than the power and industrial sectors (see, e.g., Zhao et al., 2013). Thus, the percentage of the to-tal fuel used by transport is relevant for the graph of NOx. In the early years we see, in general, a small increase in NOx
Figure 7.Time series of the ratio of the mean SO2columns and the fossil fuel consumption in China based on observations of OMI (black), SCIAMACHY (green), and GOME-2 (blue). The ratios of the annual NOxemissions and the fossil fuel consumption are based on observations of OMI (red). All time series are normalized to the year 2007.
the energy sector and has a higher emission factor. Statis-tics of the NBSC (2015) show that transport is growing by a factor of 2 every 5–6 years (Wu et al., 2017). After 2012 the gradual increase in NOx per fuel slowly stops, and the year 2015 shows a sharp decline in NOxper fossil fuels unit. This can be directly related to the rapidly growing installa-tion of SCR equipment at power plants since 2012 and to a lesser extent to the introduction of new emission standards for cars, as shown by Liu et al. (2016). This strong reduction in NOxfor 2015 and the equally strong reduction for SO2in
2014 and 2015 are a result of very effective recent environ-mental regulations in the last years in China. By comparing the efficiency level in 2015 with earlier levels, we can con-clude from Fig. 7 that, without these air quality regulations, SO2concentrations would today be about 2.5 times higher.
For NOxper fossil fuel we were expecting a gradual growth after 2012 because of the continuing relative growth of the transport sector. Keeping this in mind we compare the years 2015 with 2012 and conclude that without air quality regula-tions the NO2concentrations would be at least 25 % higher
in China today.
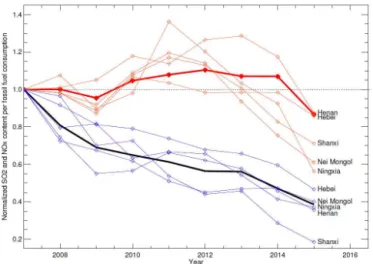
On a provincial scale we can, in principle, do similar anal-yses, but unfortunately the provincial energy consumption related to coal and oil has a very high uncertainty due to in-consistencies in interprovincial imports and exports (Hong et al., 2016). We see this reflected in a high variability in the annual provincial data and sometimes missing data. The data have high uncertainties especially for oil consumption (Guan et al., 2012; Hong et al., 2016). Therefore, we have only analysed the five provinces with dominating coal consump-tion as shown in Fig. 8. In this graph we excluded Guizhou province because of its difficult-to-interpret coal consump-tion in 2011 as a result of large power shortages (NBSC, 2015; Sun and Zhou, 2011). For SO2 per fossil fuel unit
we see that all provinces follow the national trend. For NOx per fossil fuel we see more variation per province, depend-ing on the role of transport. Most of these coal-consumption-dominated provinces start their decreasing trend from 2011, reflecting the national programme on SCR installations start-ing that same year. It is intereststart-ing to see that the commis-sioning of new power plants in 2011 causes a strong in-crease in both SO2and NOxin Ningxia province (see Figs. 4 and 5a). However, when compensating for fossil fuel usage, one can see that the same national air quality regulations are applied here, as the trend in Fig. 8 shows the same pattern as for other provinces. This shows the strength of the presented method to assess the efficiency of air pollution regulations.
4 Discussion
The current developments in data products derived from satellite observations provide high-quality time series of the air pollutants NOxand SO2. Although the mean of observed
SO2columns is not linearly related to the SO2emissions
be-Figure 8.Same graph as Fig. 7 but with time series for the provinces Hebei, Henan, Nei Mongol, Ningxia, and Shanxi included. Time series per province of the ratio of the mean SO2columns and the fossil fuel consumption are drawn in blue. The ratios of the annual NOx emissions and the fossil fuel consumption per province are shown in red. All time series are normalized to the year 2007 and based on OMI observations.
cause of the influence of the weather, it can still be argued that these satellite data products, whether concentrations or emissions, provide a fair comparison over the various regions from year to year. By comparing these time series with fossil fuel energy consumption we find that the economic growth is removed from the equation and we can monitor the effec-tiveness of air quality policies. We foresee that this method will become a valuable tool for policy makers concerning air quality regulations.
For China we see patterns in the trends of SO2that are
sim-ilar for all provinces. In 2006 a nationwide implementation of desulfurization installations started. However, the effects are only visible in 2008 and 2009, when a strict control by the Chinese authorities on the actual use of the desulfuriza-tion installadesulfuriza-tions started. In 2009, we see the effect of the air quality regulations for SO2and NOx resulting from the global economic recession at the end of 2008. The increasing relative contribution of the transport sector to the NOx emis-sion slowly increases the amount of NOxper fossil fuel unit after 2009. After 2011 we see a steadily decreasing SO2
pol-lution per fossil fuel unit caused by various Chinese environ-mental regulations. In the last year of our time series, 2015, a clear effect becomes visible of very recent regulations for NOx emissions from power plants and heavy industry. The fit of linear trends often used in earlier studies is therefore no longer applicable to the Chinese situation.
influ-ences that affect concentrations. By the novel method of di-viding these NOx emissions by the fossil fuel consumption and thereby showing the decreasing trend in emission factors in China, we also exclude the effect of economic changes, which has always been the driving factor in the trend of emis-sions in China in the past decades. We have given a comple-mentary new overview of the main national air quality reg-ulations in China from which changes in the emission fac-tors of NOxand SO2can be understood and clarified. These
trends in emission factors of NOxand SO2based on satellite
observations might also be applied to verification of existing emission factors.
The availability of high-quality satellite data for the last 10 years is especially interesting for China, where the situa-tion is rapidly changing. For instance, in Europe and Japan, desulfurization started much earlier, when these satellite data were not yet available. On the other hand, in India SO2and
NOx emissions are still growing and possible new regula-tions can be monitored in the years to come, with even bet-ter quality, using forthcoming sensors such as TROPOMI on board Sentinel-5 Precursor.
Despite the growing use of coal and oil in the last 10 years in China we have recently seen reduced emissions per fuel unit. This decreasing trend in both SO2and NOxfor China is likely to continue in the coming years for which the Chinese national government has announced less use of coal, more environmental regulations for SO2and NOx, and stricter re-inforcement of control of environmental policies.
5 Data availability
The SCIAMACHY and OMI SO2 data used in this
Appendix A
Table A1.Annual SO2column densities (DU/grid cell) per province observed by OMI.
Province 2005 2006 2007 2008 2009 2010 2011 2012 2013 2014 2015
Table A2. Annual NOx emissions (Gg N year−1) per province in the domain of DECSO (in parentheses the fraction of provincial area considered) derived from OMI observations.
Province 2007 2008 2009 2010 2011 2012 2013 2014 2015
Anhui 167 169 187 224 242 292 288 282 215
Beijing 91 62 90 107 88 80 89 74 64
Chongqing 54 57 70 75 87 95 96 100 70
Fujian 96 114 100 114 161 162 153 167 137
Gansu (61 %) 31 38 37 42 61 73 60 78 52
Guangdong 383 383 331 341 371 413 360 374 331
Guangxi 118 148 118 145 152 224 224 200 157
Guizhou 107 130 142 154 131 194 191 180 122
Hainan 8 13 11 17 23 22 25 37 30
Hebei 427 423 403 515 563 543 544 511 436
Heilongjiang (74 %) 33 36 30 25 43 54 40 49 31
Henan 334 347 370 445 470 481 491 433 315
Hubei 135 140 144 186 248 263 233 270 199
Hunan 109 112 124 162 163 216 184 218 187
Jiangsu 374 344 344 421 470 433 428 445 365
Jiangxi 51 58 65 73 85 105 111 150 112
Jilin 30 22 18 20 45 50 43 48 43
Liaoning 122 128 124 169 205 225 178 199 173
Nei Mongol (83 %) 98 116 117 156 215 215 169 142 111
Ningxia 30 34 32 41 75 72 66 61 36
Shaanxi 118 118 113 181 216 222 196 208 158
Shandong 464 510 493 629 689 677 731 712 580
Shanghai 96 103 101 95 109 75 83 93 84
Shanxi 292 284 253 328 397 395 373 313 260
Sichuan (51 %) 155 158 179 204 232 254 271 280 205
Taiwan 100 106 98 106 113 118 106 114 111
Tianjin 77 86 99 136 152 114 102 97 88
Yunnan (36 %) 83 109 105 97 118 159 144 176 126
Zhejiang 243 253 247 270 327 281 294 292 240
Competing interests. The authors declare that they have no conflict of interest.
Acknowledgements. This research was funded by the MarcoPolo project of the European Union Seventh Framework Programme (FP7/2007-2013) under grant agreement no. 606953 and by the GlobEmission project (contract no. 4000104001/11/I-NB) of the Data User Element programme of the European Space Agency.
Edited by: G. Frost
Reviewed by: two anonymous referees
References
Boersma, K. F., Eskes, H. J., Dirksen, R. J., van der A, R. J., Veefkind, J. P., Stammes, P., Huijnen, V., Kleipool, Q. L., Sneep, M., Claas, J., Leitão, J., Richter, A., Zhou, Y., and Brunner, D.: An improved tropospheric NO2column retrieval algorithm for the Ozone Monitoring Instrument, Atmos. Meas. Tech., 4, 1905– 1928, doi:10.5194/amt-4-1905-2011, 2011.
Boersma, K. F., Vinken, G. C. M., and Tournadre, J.: Ships go-ing slow in reducgo-ing their NOx emissions: changes in 2005– 2012 ship exhaust inferred from satellite measurements over Europe, Environ. Res. Lett., 10, 074007, doi:10.1088/1748-9326/10/7/074007, 2015.
Brenot, H., Theys, N., Clarisse, L., van Geffen, J., van Gent, J., Van Roozendael, M., van der A, R., Hurtmans, D., Coheur, P.-F., Clerbaux, C., Valks, P., Hedelt, P., Prata, F., Rasson, O., Sievers, K., and Zehner, C.: Support to Aviation Control Service (SACS): an online service for near-real-time satellite monitoring of vol-canic plumes, Nat. Hazards Earth Syst. Sci., 14, 1099–1123, doi:10.5194/nhess-14-1099-2014, 2014.
CAAC: Clean Air Alliance of China, State Council air pollution prevention and control action plan, issue II, October 2013, avail-able at: http://en.cleanairchina.org/product/6346.html (English translation), (last access: 8 October 2015), 2013.
Chen, W. and Xu, R.: Clean coal technology development in China, Energ. Policy, 38, 2123–2130, doi:10.1016/j.enpol.2009.06.003, 2010.
ChinaFAQs Project: China Adopts World-Class Pollutant Emissions Standards for Coal Power Plants, available at: http://www.chinafaqs.org/library/chinafaqs-china-adopts (last access: 8 October 2015), 2012.
de Foy, B., Lu, Z., and Streets, D. G.: Satellite NO2 re-trievals suggest China has exceeded its NOx reduction goals from the twelfth Five-Year Plan, Scientific Reports, 6, 35912, doi:10.1038/srep35912, 2016.
De Ruyter de Wildt, M., Eskes, H., and Boersma, K. F.: The global economic cycle and satellite-derived NO2 trends over shipping lanes, Geophys. Res. Lett., 39, L01802, doi:10.1029/2011GL049541, 2012.
Ding, J., van der A, R. J., Mijling, B., Levelt, P. F., and Hao, N.: NOx emission estimates during the 2014 Youth Olympic Games in Nanjing, Atmos. Chem. Phys., 15, 9399–9412, doi:10.5194/acp-15-9399-2015, 2015.
Ding, J., van der A, R. J., Mijling, B., and Levelt, P. F.: Space-based NOxemission estimates over remote regions improved in
DECSO, Atmos. Meas. Tech. Discuss., doi:10.5194/amt-2016-295, in review, 2016a.
Ding, J., van der A, R. J., and Mijling, B.: DECSO NOxemissions (version 4), available at: http://www.globemission.eu/region_ asia/datapage.php, 2016b.
Duncan, B. N., Lamsal, L. N., Thompson, A. M., Yoshida, Y., Lu, Z., Streets, D. G., Hurwitz, M. M., and Pickering, K. E.: A space-based, high-resolution view of notable changes in urban NOx pollution around the world (2005–2014), J. Geophys. Res. 121, 976–96, 2016.
Eisinger, M. and Burrows, J. P.: Tropospheric sulfur dioxide ob-served by the ERS-2 GOME instrument, Geophys. Res. Lett., 25, 4177–4180, 1998.
Faber, J., Nelissen, D., Hon, G., Wang, H., and Tsimplis, M.: Regulated slow steaming in maritime transport – an assess-ment of options, costs and benefits CE Delft (the Netherlands: Delft), available at: www.cedelft.eu/publicatie/regulated_slow_ steaming_in_maritime_transport/1224 (last access: 9 December 2016), 117 pp., 2012.
Fioletov, V. E., McLinden, C. A., Krotkov, N., and Li, C.: Lifetimes and emissions of SO2 from point sources es-timated from OMI, Geophys. Res. Lett., 42, 1969–1976, doi:10.1002/2015GL063148, 2015.
Fioletov, V. E., McLinden, C. A., Krotkov, N., Li, C., Joiner, J., Theys, N., Carn, S., and Moran, M. D.: A global catalogue of large SO2 sources and emissions derived from the Ozone Monitoring Instrument, Atmos. Chem. Phys., 16, 11497–11519, doi:10.5194/acp-16-11497-2016, 2016.
Gu, D., Wang, Y., Smeltzer, C., and Liu, Z.: Reduction in NOx emis-sion trends over China: regional and seasonal variations, Environ. Sci. Technol., 47, 12912–12919, 2013.
Guan, D., Liu, Z., Geng, Y., Lindner, S., and Hubacek, K.: The giga-tonne gap in China’s carbon dioxide inventories, Nature Climate Change, 2, 672–675, doi:10.1038/nclimate1560, 2012.
Hong, C., Zhang, Q., He, K., Guan, D., Li, M., Liu, F., and Zheng, B.: Variations of China’s emission estimates response to un-certainties in energy statistics, Atmos. Chem. Phys. Discuss., doi:10.5194/acp-2016-459, in review, 2016.
He, K.: Multi-resolution Emission Inventory for China (MEIC): model framework and 1990–2010 anthropogenic emissions, in International Global Atmospheric Chemistry Conference, 17–21 September, Beijing, China, available at: http://adsabs. harvard.edu/abs/2012AGUFM.A32B..05H (last access: 4 Febru-ary 2015), 2012.
He, H., Li, C., Loughner, C. P., Li, Z., Krotkov, N. A., Yang, K., Wang, L., Zheng, Y., Bao, X., Zhao, G., and Dickerson, R. R.: SO2over central China: Measurements, numerical simula-tions and the tropospheric sulfur budget, J. Geophys. Res., 117, D00K37, doi:10.1029/2011JD016473, 2012.
ICAC: Institute of Clean Air Companies, Selective Cat-alytic Reduction (SCR) control of NOx emissions from fossil fuel-fired electric power plants, available at: https://c.ymcdn.com/sites/icac.site-ym.com/resource/resmgr/ Standards_WhitePapers/SCR_WhitePaper_final_2009.pdf (last access: 22 November 2016), 2009.
Klimont, Z., Smith, S. J., and Cofala, J.: The last decade of global anthropogenic sulfur dioxide: 2000–2011 emissions, Environ. Res. Lett., 8, 014003, doi:10.1088/1748-9326/8/1/014003, 2013. KNMI: Background information about the Row Anomaly in OMI, available at: http://www.knmi.nl/omi/research/product/ rowanomaly-background.php (last access: 8 October 2015), 2012.
Koukouli, M. E., Balis, D. S., van der A, R. J., Theys, N., Hedelt, P., Richter, A., Krotkov, N., Li, C., and Taylor, M.: Anthropogenic sulphur dioxide load over China as observed from different satellite sensors, Atmos. Environ., 145, 45–59, doi:10.1016/j.atmosenv.2016.09.007, 2016.
Krotkov, N. A., Carn, S. A., Krueger, A. J., Bhartia, P. K., and Yang, K.: Band residual difference algorithm for retrieval of SO2from the aura ozone monitoring instrument (OMI), IEEE T. Geosci. Remote, 44, 1259–1266, doi:10.1109/TGRS.2005.861932, 2006. Krotkov, N. A., McLinden, C. A., Li, C., Lamsal, L. N., Celarier, E. A., Marchenko, S. V., Swartz, W. H., Bucsela, E. J., Joiner, J., Duncan, B. N., Boersma, K. F., Veefkind, J. P., Levelt, P. F., Fioletov, V. E., Dickerson, R. R., He, H., Lu, Z., and Streets, D. G.: Aura OMI observations of regional SO2and NO2 pollu-tion changes from 2005 to 2015, Atmos. Chem. Phys., 16, 4605– 4629, doi:10.5194/acp-16-4605-2016, 2016.
Kurokawa, J. I., Yumimoto, K., Uno, I., andOhara, T.: Adjoint in-verse modeling of NOxemissions over eastern China using satel-lite observations of NO2vertical column densities, Atmos. Env-iron., 43, 1878–1887, 2009.
Kurokawa, J., Ohara, T., Morikawa, T., Hanayama, S., Janssens-Maenhout, G., Fukui, T., Kawashima, K., and Akimoto, H.: Emissions of air pollutants and greenhouse gases over Asian re-gions during 2000–2008: Regional Emission inventory in ASia (REAS) version 2, Atmos. Chem. Phys., 13, 11019–11058, doi:10.5194/acp-13-11019-2013, 2013.
Lee, C., Richter, A., Weber, M., and Burrows, J. P.: SO2Retrieval from SCIAMACHY using the Weighting Function DOAS (WF-DOAS) technique: comparison with Standard DOAS retrieval, Atmos. Chem. Phys., 8, 6137–6145, doi:10.5194/acp-8-6137-2008, 2008.
Lee, C., Martin, R. V., van Donkelaar, A., Lee, H., Dickerson, R. R., Hains, J. C., Krotkov, N., Richter, A., Vinnikov, K., and Schwab, J. J.: SO2 emissions and lifetimes: Estimates from inverse modeling using in situ and global, space-based (SCIAMACHY and OMI) observations, J. Geophys. Res., 116, D06304, doi:10.1029/2010JD014758, 2011.
Levelt, P. F., van den Oord, G. H. J., Dobber, M. R., Mälkki, A., Visser, H., de Vries, J., Stammes, P., Lundell, J., and Saari, H.: The ozone monitoring instrument, IEEE T. Geosci. Remote, 44, 1093–1101, doi:10.1109/TGRS.2006.872333, 2006.
Li, C., Zhang, Q., Krotkov, N. A., Streets, D. G., He, K., Tsay, S.-C., and Gleason, J. F.: Recent large reduction in sulfur dioxide emissions from Chinese power plants observed by the Ozone Monitoring Instrument, Geophys. Res. Lett., 37, 1–6, doi:10.1029/2010GL042594, 2010.
Lin, J.-T. and McElroy, M. B.: Detection from space of a reduction in anthropogenic emissions of nitrogen oxides during the Chi-nese economic downturn, Atmos. Chem. Phys., 11, 8171–8188, doi:10.5194/acp-11-8171-2011, 2011.
Liu, F., Zhang, Q., Tong, D., Zheng, B., Li, M., Huo, H., and He, K. B.: High-resolution inventory of technologies, activities,
and emissions of coal-fired power plants in China from 1990 to 2010, Atmos. Chem. Phys., 15, 13299–13317, doi:10.5194/acp-15-13299-2015, 2015.
Liu, F., Beirle, S., Zhang, Q., Dörner, S., He, K., and Wagner, T.: NOx lifetimes and emissions of cities and power plants in polluted background estimated by satellite observations, Atmos. Chem. Phys., 16, 5283–5298, doi:10.5194/acp-16-5283-2016, 2016a.
Liu, F., Zhang, Q., van der A, R. J., Zheng, B., Tong, D., Yan, L., and He, K. B.: Recent reduction in NOxemissions over China from satellite observations and emission inventories, Env. Res. Lett., submitted, 2016b.
Lu, Z., Streets, D. G., Zhang, Q., Wang, S., Carmichael, G. R., Cheng, Y. F., Wei, C., Chin, M., Diehl, T., and Tan, Q.: Sulfur dioxide emissions in China and sulfur trends in East Asia since 2000, Atmos. Chem. Phys., 10, 6311–6331, doi:10.5194/acp-10-6311-2010, 2010.
McLinden, C. A., Fioletov, V., Shephard, M. W., Krotkov, N., Li, C., Martin, R. V., Moran, M. D., and Joiner, J.: Space-based de-tection of missing sulfur dioxide sources of global air pollution, Nat. Geosci, 9, 496–500, doi:10.1038/ngeo2724, 2016. Menut, L., Bessagnet, B., Khvorostyanov, D., Beekmann, M.,
Blond, N., Colette, A., Coll, I., Curci, G., Foret, G., Hodzic, A., Mailler, S., Meleux, F., Monge, J.-L., Pison, I., Siour, G., Turquety, S., Valari, M., Vautard, R., and Vivanco, M. G.: CHIMERE 2013: a model for regional atmospheric composition modelling, Geosci. Model Dev., 6, 981–1028, doi:10.5194/gmd-6-981-2013, 2013.
MEP: Ministry of Environmental Protection, available at: http:// english.mep.gov.cn/Plans_Reports/, last access: 8 October 2015. Mijling, B. and van der A, R. J.: Using daily satellite ob-servations to estimate emissions of short-lived air pollutants on a mesoscopic scale, J. Geophys. Res., 117, D17302, doi:10.1029/2012JD017817, 2012.
Mijling, B., van der A, R. J., Boersma, K. F., Van Roozendael, M., De Smedt, I., and Kelder, H. M.: Reduction of NO2 detected from space during the 2008 Beijing Olympic Games, Geophys. Res. Lett., 36, L13801, doi:10.1029/2009GL038943, 2009. Mijling, B., van der A, R. J., and Zhang, Q.: Regional
nitro-gen oxides emission trends in East Asia observed from space, Atmos. Chem. Phys., 13, 12003–12012, doi:10.5194/acp-13-12003-2013, 2013.
Munro, R., Lang, R., Klaes, D., Poli, G., Retscher, C., Lind-strot, R., Huckle, R., Lacan, A., Grzegorski, M., Holdak, A., Kokhanovsky, A., Livschitz, J., and Eisinger, M.: The GOME-2 instrument on the Metop series of satellites: instrument de-sign, calibration, and level 1 data processing – an overview, At-mos. Meas. Tech., 9, 1279–1301, doi:10.5194/amt-9-1279-2016, 2016.
NBSC: National Bureau of Statistics China, available at: http://data. stats.gov.cn, last access: 29 December 2015.
NDRC: National Development and Reform Commission, avail-able at: http://www.ndrc.gov.cn/zcfb/zcfbtz/201308/t20130827_ 555124.html (last access: 1 November 2015), reported on 16 Au-gust 2013.
Schneider, P., Lahoz, W. A., and van der A, R.: Recent satellite-based trends of tropospheric nitrogen dioxide over large ur-ban agglomerations worldwide, Atmos. Chem. Phys., 15, 1205– 1220, doi:10.5194/acp-15-1205-2015, 2015.
State Council: State Council announcement on 15 May 2014 of environmental regulations), available at: http://www.gov. cn/zhengce/content/2014-05/26/content_8824.htm (last access: 1 November 2015), 2014.
Stavrakou, T., Müller, J. F., Boersma, K. F., De Smedt, I., and van der A, R. J.: Assessing the distribution and growth rates of NOx emission sources by inverting a 10-year record of NO2 satellite columns, Geophys. Res. Lett., 35, L10801, doi:10.1029/2008GL033521, 2008.
Sun, L. and Zhou, N. (Eds.): Guizhou power supply tight, Xinhua News Agency, available at: http://news.xinhuanet.com/fortune/ 2011-10/22/c_111115420.htm (last access: 9 December 2016), 22 October 2011.
Theys, N., De Smedt, I., van Gent, J., Danckaert, T., Wang, T., Hen-drick, F., Stavrakou, T., Bauduin, S., Clarisse, L., Li, C., Krotkov, N., Yu, H., Brenot, H., and Van Roozendael, M.: Sulfur dioxide vertical column DOAS retrievals from the Ozone Monitoring In-strument: global observations and comparison to ground-based and satellite data, J. Geophys. Res.-Atmos., 120, 2470–2491, doi:10.1002/2014JD022657, 2015.
van der A, R. J., Peters, D. H. M. U., Eskes, H., Boersma, K. F., Van Roozendael, M., De Smedt, I., and Kelder, H. M.: Detection of the trend and seasonal variation in tropospheric NO2over China, J. Geophys. Res., 111, D12317, doi:10.1029/2005JD006594, 2006.
Valks, P. J. M.: GOME-2/Metop-A SO2 data (version GDP 4.7), available at: http://atmos.caf.dlr.de/gome2/, 2016.
Wu, Y., Zhang, S., Hao, J., Liu, H., Wu, X., Hu, J., Walsh, M. P., Wallington, T. J., and Zhang, K. M. S.: Stevanovic, On-road vehicle emissions and their control in China: A review and outlook, Sci. Total Environ., 574, 332–349, doi:10.1016/j.scitotenv.2016.09.040, 2017.
Xu, Y.: Improvements in the Operation of SO2 Scrubbers in China’s Coal Power Plants, Environ. Sci. Technol., 45, 380–385, doi:10.1021/es1025678, 2011.
Yang, K., Dickerson, R. R., Carn, S. A., Ge, C., and Wang, J.: First observations of SO2from the satellite Suomi NPP OMPS: Widespread air pollution events over China, Geophys. Res. Lett., 40, 4957–4962, doi:10.1002/grl.50952, 2013.
Zhang, Q., Geng, G., Wang, S., Richter, A., and He, K.: Satellite remote sensing of changes in NO×emissions over China during 1996–2010, Chinese Sci. Bull., 57, 2857–2864, 2012.
Zhang, R.: Heating causes pollution spike in Northern China, CCTV.com, available at: http://english.cntv.cn/program/china24/ 20131108/101015.shtml (last access: 9 December 2016), 11 Au-gust 2013.
Zhao, B., Wang, S. X., Liu, H., Xu, J. Y., Fu, K., Klimont, Z., Hao, J. M., He, K. B., Cofala, J., and Amann, M.: NOx emissions in China: historical trends and future perspectives, Atmos. Chem. Phys., 13, 9869–9897, doi:10.5194/acp-13-9869-2013, 2013. Zhu, N.: China to shut coal mines in safety overhaul, Xinhua News