ACPD
13, 201–254, 2013Observations of RONO2: NOxsinks
and HNO3 sources E. C. Browne et al.
Title Page
Abstract Introduction
Conclusions References
Tables Figures
◭ ◮
◭ ◮
Back Close
Full Screen / Esc
Printer-friendly Version
Interactive Discussion
Discussion
P
a
per
|
Dis
cussion
P
a
per
|
Discussion
P
a
per
|
Discussio
n
P
a
per
|
Atmos. Chem. Phys. Discuss., 13, 201–254, 2013 www.atmos-chem-phys-discuss.net/13/201/2013/ doi:10.5194/acpd-13-201-2013
© Author(s) 2013. CC Attribution 3.0 License.
Atmospheric Chemistry and Physics Discussions
This discussion paper is/has been under review for the journal Atmospheric Chemistry and Physics (ACP). Please refer to the corresponding final paper in ACP if available.
Observations of total RONO
2
over the
boreal forest: NO
x
sinks and HNO
3
sources
E. C. Browne1, K.-E. Min2,*, P. J. Wooldridge1, E. Apel3, D. R. Blake4,
W. H. Brune5, C. A. Cantrell3, M. J. Cubison6,**, G. S. Diskin7, J. L. Jimenez6, A. J. Weinheimer3, P. O. Wennberg8, A. Wisthaler9, and R. C. Cohen1,2
1
Department of Chemistry, University of California Berkeley, Berkeley, CA, USA
2
Department of Earth and Planetary Science, University of California Berkeley, Berkeley, CA, USA
3
Atmospheric Chemistry Division, National Center for Atmospheric Research, Boulder, CO, USA
4
Department of Chemistry, University of California Irvine, Irvine, California, USA
5
Department of Meteorology, Pennsylvania State University, University Park, PA, USA
6
Cooperative Institute for Research in the Environmental Sciences (CIRES) and Department of Chemistry and Biochemistry, University of Colorado, Boulder, CO, USA
7
NASA Langley Research Center, Hampton, Virginia, USA
8
Division of Geology and Planetary Sciences, California Institute of Technology, Pasadena, CA, USA
9
ACPD
13, 201–254, 2013Observations of RONO2: NOxsinks
and HNO3 sources E. C. Browne et al.
Title Page
Abstract Introduction
Conclusions References
Tables Figures
◭ ◮
◭ ◮
Back Close
Full Screen / Esc
Printer-friendly Version
Interactive Discussion
Discussion
P
a
per
|
Dis
cussion
P
a
per
|
Discussion
P
a
per
|
Discussio
n
P
a
per
|
*
now at: NOAA Earth System Research Laboratory and Cooperative Institute for Research in Environmental Sciences, University of Colorado, Boulder, USA
**
now at: Tofwerk AG, Thun, Switzerland
Received: 11 December 2012 – Accepted: 19 December 2012 – Published: 4 January 2013
Correspondence to: R. C. Cohen ([email protected]) and E. C. Browne ([email protected])
ACPD
13, 201–254, 2013Observations of RONO2: NOxsinks
and HNO3 sources E. C. Browne et al.
Title Page
Abstract Introduction
Conclusions References
Tables Figures
◭ ◮
◭ ◮
Back Close
Full Screen / Esc
Printer-friendly Version
Interactive Discussion
Discussion
P
a
per
|
Dis
cussion
P
a
per
|
Discussion
P
a
per
|
Discussio
n
P
a
per
|
Abstract
In contrast with the textbook view of remote chemistry where HNO3formation is the pri-mary sink of nitrogen oxides, recent theoretical analyses show that formation of RONO2 (ΣANs) from isoprene and other terpene precursors is the primary net chemical loss of nitrogen oxides over the remote continents where the concentration of nitrogen
ox-5
ides is low. This then increases the prominence of questions concerning the chemical lifetime and ultimate fate of ΣANs. We present observations of nitrogen oxides and organic molecules collected over the Canadian boreal forest during the summer that show that ΣANs account for∼20 % of total oxidized nitrogen and that their instanta-neous production rate is larger than that of HNO3. This confirms the primary role of
10
reactions producing ΣANs as a control over the lifetime of NOx (NOx=NO+NO2) in remote, continental environments. However, HNO3 is generally present in larger con-centrations thanΣANs indicating that the atmospheric lifetime ofΣANs is shorter than the HNO3 lifetime. We investigate a range of proposed loss mechanisms that would explain the inferred lifetime of ΣANs finding that in combination with deposition, two
15
processes are consistent with the observations: (1) rapid ozonolysis of isoprene ni-trates where at least∼40 % of the ozonolysis products release NOx from the carbon backbone and/or (2) hydrolysis of particulate organic nitrates with HNO3as a product. Implications of these ideas for our understanding of NOx and NOy budget in remote and rural locations are discussed.
20
1 Introduction
In remote, continental regions, isoprene, terpenes and other biogenic volatile organic compounds (BVOCs) rival CH4 and CO as controls over the free radical chemistry of the atmospheric boundary layer, affecting global distributions of oxidants (OH, O3, NO3) and oxidant precursors (e.g. NOx, HCHO) (e.g. Fuentes et al., 2000). In turn, these
25
ACPD
13, 201–254, 2013Observations of RONO2: NOxsinks
and HNO3 sources E. C. Browne et al.
Title Page
Abstract Introduction
Conclusions References
Tables Figures
◭ ◮
◭ ◮
Back Close
Full Screen / Esc
Printer-friendly Version
Interactive Discussion
Discussion
P
a
per
|
Dis
cussion
P
a
per
|
Discussion
P
a
per
|
Discussio
n
P
a
per
|
long-lived (e.g. CH4, CH3Br) organic compounds thus impacting climate. Consequently, the oxidative chemistry of BVOC has been the subject of extensive research. Recent advances in laboratory and field measurements have focused on the products of BVOC oxidation and have inspired renewed examination of how the mechanisms of BVOC oxidation affect atmospheric composition. In particular, the impact of BVOC on the
5
HOx budget has been highlighted (e.g. Thornton et al., 2002; Lelieveld et al., 2008; Hofzumahaus et al., 2009; Stavrakou et al., 2010; Stone et al., 2011; Whalley et al., 2011; Mao et al., 2012; Paulot et al., 2012; Taraborrelli et al., 2012).
Oxidation of BVOC by OH results in peroxy radicals, which may react with NOx (NOx=NO+NO2), with other peroxy radicals (RO2 or HO2), or – in some cases –
10
may isomerize (potentially regenerating OH). The reaction of peroxy radicals with NO2 results in the formation of peroxy nitrates (RO2NO2) – a class of molecules which gen-erally act as temporary reservoirs of NOx and serve to transport NOxon regional and global scales. Reaction of peroxy radicals with NO generally acts to propagate the ozone production cycle (R1a), however, a minor channel of the reaction (R1b) which
15
proceeds with the efficiency α (also known as the branching ratio), results in the for-mation of organic nitrates (RONO2).
RO2+NO→RO+NO2 (1−α) (R1a)
RO2+NO→RONO2 (α) (R1b)
20
Calculations with box and chemical transport models (CTMs) have shown that organic nitrates play a significant role in the NOxand O3budgets (e.g. Trainer et al., 1991; Chen et al., 1998; Horowitz et al., 1998, 2007; Liang et al., 1998; von Kuhlmann et al., 2004; Fiore et al., 2005; Wu et al., 2007; Paulot et al., 2012). In Browne and Cohen (2012) we have shown that at NOx concentrations typical of remote and rural environments,
25
ACPD
13, 201–254, 2013Observations of RONO2: NOxsinks
and HNO3 sources E. C. Browne et al.
Title Page
Abstract Introduction
Conclusions References
Tables Figures
◭ ◮
◭ ◮
Back Close
Full Screen / Esc
Printer-friendly Version
Interactive Discussion
Discussion
P
a
per
|
Dis
cussion
P
a
per
|
Discussion
P
a
per
|
Discussio
n
P
a
per
|
et al., 2007; Ito et al., 2009; Paulot et al., 2012). The lifetime and fate ofΣANs remains one of the outstanding questions about their chemistry; compared to other aspects of the NOy, HOx and VOC chemistry, there has been limited research on products of ΣANs oxidation. Even for those nitrates whose oxidation products and yields have been measured, these measurements have occurred under conditions where the resulting
5
peroxy radicals react primarily with NO and not with HO2 or RO2 (which are the ex-pected reactions in the low NOx conditions of the boreal forest). As recently pointed out by Elrod and co-workers (Darer et al., 2011; Hu et al., 2011), ΣANs may also be removed via hydrolysis in aerosol with an assumed product of NO−3. This uncertainty in the fate ofΣANs results in large uncertainties in global ozone budgets. For instance,
10
recent modeling studies have found that the ozone response to increasing isoprene emissions (as predicted in a warmer climate) is highly sensitive to the fate of isoprene nitrates (Ito et al., 2009; Weaver et al., 2009).
Here, we use observations, collected aboard the NASA DC-8 aircraft, of a suite of ni-trogen oxides, organic molecules, and oxidants (OH and O3) from the July 2008 NASA
15
ARCTAS (Arctic Research of the Composition of the Troposphere from Aircraft and Satellites) campaign over the Canadian boreal forest, to examine the extent to which the organic nitrate products of BVOC oxidation control the lifetime of NOx in the re-mote continental boundary layer. We find that the production ofΣANs is dominated by biogenic molecules and is generally larger than the production of HNO3. Using the
con-20
centration measurements in conjunction with the production rates, our measurements also provide a constraint on the ratio of the ΣANs lifetime to the HNO3 lifetime over the boreal forest. We examine the loss processes of ΣANs find that both deposition and chemical loss processes (including oxidation of isoprene nitrates and hydrolysis of ΣANs in aerosol) are important. We find that the ozonolysis of isoprene nitrates is the
25
ACPD
13, 201–254, 2013Observations of RONO2: NOxsinks
and HNO3 sources E. C. Browne et al.
Title Page
Abstract Introduction
Conclusions References
Tables Figures
◭ ◮
◭ ◮
Back Close
Full Screen / Esc
Printer-friendly Version
Interactive Discussion
Discussion
P
a
per
|
Dis
cussion
P
a
per
|
Discussion
P
a
per
|
Discussio
n
P
a
per
|
the atmosphere (e.g. deposition, hydrolysis) has important consequences for regional and global NOx, O3, and OH.
2 ARCTAS measurements
The NASA ARCTAS experiment was designed to study processes influencing Arc-tic chemistry and climate and has been described in detail previously by Jacob
5
et al. (2010). In this analysis we use measurements from the summer portion of the campaign over the Canadian boreal forest (June–July 2008). These measurements were made aboard the NASA DC-8 aircraft which contained instrumentation for an extensive suite of gas and aerosol measurements.
NO2, total peroxy nitrates (ΣPNs), and total organic nitrates (ΣANs) were measured
10
aboard the DC-8 using Thermal Dissociation-Laser Induced Fluorescence (TD-LIF). The instrument has been described in detail elsewhere (Day et al., 2002; Wooldridge et al., 2010) and the specific configuration used during ARCTAS has been described in Browne et al. (2011). Briefly, a two-cell TD-LIF with supersonic expansion (Thornton et al., 2000; Cleary et al., 2002; Day et al., 2002; Wooldridge et al., 2010) was deployed
15
for ARCTAS. We use a 7 kHz, Q-switched, frequency doubled Nd:YAG laser to pump a tunable dye laser (pyrromethene 597 in isopropanol) tuned to a 585 nm absorption in the NO2spectrum. We reject prompt scatter using time gated detection and eliminate scattered light at<700 nm using bandpass filters. Fluorescence is imaged onto a red sensitive photomultiplier tube and counts are recorded at 4 Hz. The dye laser is tuned
20
on and off an isolated rovibronic feature in the NO2 spectrum, spending 9 s on the peak of the NO2 absorbance and 3 s in an off-line position in the continuum of the NO2 absorption. The difference between the two signals is directly proportional to the NO2concentration. We calibrate at least every two hours during a level flight leg using a 4.5 ppm NO2reference standard diluted to∼2–8 ppbv in zero air.
25
ACPD
13, 201–254, 2013Observations of RONO2: NOxsinks
and HNO3 sources E. C. Browne et al.
Title Page
Abstract Introduction
Conclusions References
Tables Figures
◭ ◮
◭ ◮
Back Close
Full Screen / Esc
Printer-friendly Version
Interactive Discussion
Discussion
P
a
per
|
Dis
cussion
P
a
per
|
Discussion
P
a
per
|
Discussio
n
P
a
per
|
between the measurement of total peroxy nitrates (ΣPNs) and total organic nitrates (ΣANs) which are detected by thermal conversion to NO2in heated quartz tubes.ΣPNs were converted to NO2at∼200
◦
C andΣANs at∼375◦C, which is sufficient to disso-ciateΣANs as well as any semivolatile aerosol phase organic nitrates (Rollins et al., 2010b). We do not detect non-volatile nitrates (i.e. NaNO3). The resulting NO2of both
5
heated channels (NO2+ ΣPNs or NO2+ ΣPNs+ ΣANs) was measured in cell 2. The duty cycle of cell 2 was evenly split between the measurement ofΣPNs and of ΣANs and alternated between the two either every 12 s or every 24 s. The 9 s average from each on-line block was reported to the data archive which is publically available at http://www-air.larc.nasa.gov/missions/arctas/arctas.html.
10
ΣPNs are calculated from the difference in signal between the ambient temperature and 200◦C channel and likewise, ΣANs are calculated from the difference in signal between the 375◦C (NO2+ ΣPNs+ ΣANs) and the 200
◦
C (NO2+ ΣPNs). The detection limit (defined as signal to noise of 2 for the 9 s average) of theΣANs signal is directly related to the magnitude of the NO2+ ΣPNs (NP) signal and during ARCTAS was on
15
average<20 pptv for a 200 pptv NP signal. TheΣANs signal also requires interpolation of the NP signal which we calculate using a weighted sum of a linear interpolation of the NP signal (weight∼1/3) and an interpolation of the ratio of NP to NO2signal scaled to the measured NO2. The uncertainty in theΣANs measurement depends both on the magnitude and the variability of the NP signal. On average, the NP signal varied by
20
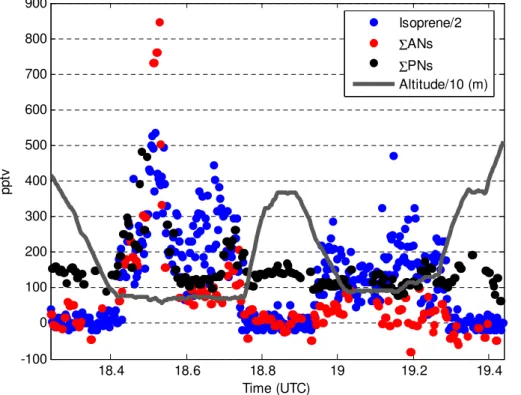
less than 20 % on the timescale of theΣANs measurements. An example time series of theΣANs andΣPNs data is shown in Fig. 1.
In the analysis below we use measurements only between 10 and 18 local solar time which enables us to neglect the possible interference from ClNO2(Thaler et al., 2011) since ClNO2is rapidly photolyzed during daylight hours.
25
ACPD
13, 201–254, 2013Observations of RONO2: NOxsinks
and HNO3 sources E. C. Browne et al.
Title Page
Abstract Introduction
Conclusions References
Tables Figures
◭ ◮
◭ ◮
Back Close
Full Screen / Esc
Printer-friendly Version
Interactive Discussion
Discussion
P
a
per
|
Dis
cussion
P
a
per
|
Discussion
P
a
per
|
Discussio
n
P
a
per
|
3 ΣANs concentration and production
In the continental boundary layer over the boreal forest (between 50◦ and 67.5◦N) we observed that ΣANs were 22 % (median) of NOy (Fig. 2) in background conditions which were sampled on flights 17, 19, 20, and 23. Periods of boundary layer sampling were determined by visually inspecting the potential temperature and ratio of potential
5
temperature to IR surface temperature. The boundary layer heights determined by this method (∼1.5–2.4 km a.g.l.) are consistent with boundary layer heights measured over Northern Saskatchewan in July 2002 (Shashkov et al., 2007). The background condi-tions were defined to exclude recent anthropogenic and biomass burning influences by only using conditions where CO was less than 180 ppbv and NOx was less than
10
200 pptv. Remaining biomass burning influences were removed by visually inspecting the HCN and CH3CN concentration time series and excluding plumes. The mean con-centrations of CO, CH3CN, and HCN used in our analysis are lower than the means of the background ARCTAS measurements described in Simpson et al. (2011). In this analysis we define NOy as the sum of the measured individual components of NOy
15
(NO, NO2, ΣPNs, ΣANs, gas phase nitric acid, and submicron aerosol nitrate). The observation thatΣANs are of order 20 % of NOyis consistent with almost all past mea-surements ofΣANs from TD-LIF in continental locations (Day et al., 2003; Rosen et al., 2004; Cleary et al., 2005; Perring et al., 2009, 2010; Farmer et al., 2011), however, in this data set we find that the instantaneous production rate ofΣANs is larger than the
20
HNO3production rate – a situation that has not been reported previously.
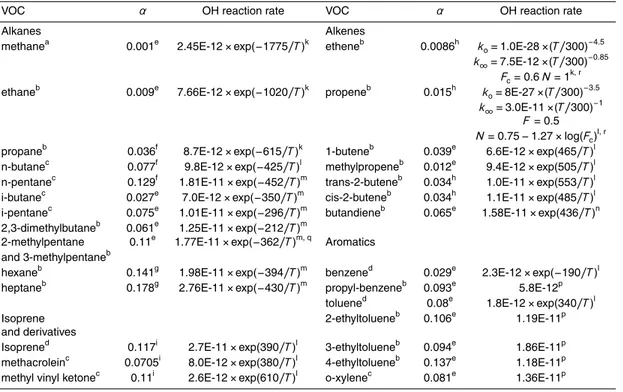
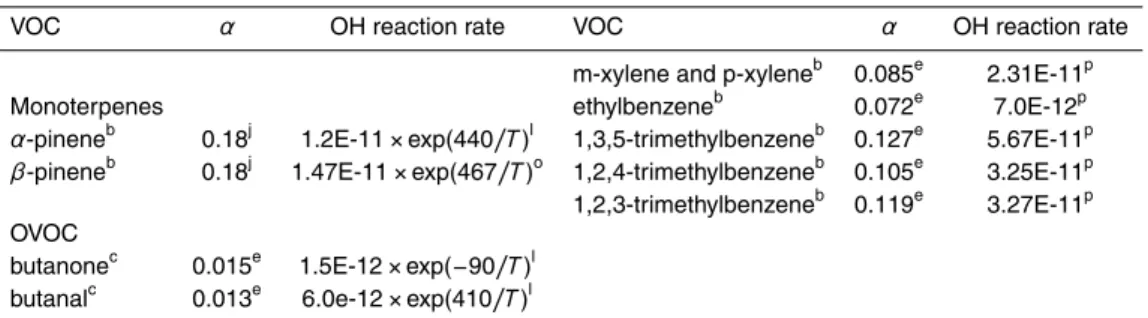
Using the measured VOCs, OH, HO2, and NO concentrations (Table 1), we calculate the instantaneous production rate ofΣANs (P(ΣANs) Eq. 1) via OH oxidation of VOCs by assuming that peroxy radicals are in steady-state (Eqs. 2–3) which results in Eq. (4):
P(ΣANs)=X i
αikRO2i+NO[RO2]i[NO] (1)
25
d[RO2]i
ACPD
13, 201–254, 2013Observations of RONO2: NOxsinks
and HNO3 sources E. C. Browne et al.
Title Page
Abstract Introduction
Conclusions References
Tables Figures
◭ ◮
◭ ◮
Back Close
Full Screen / Esc
Printer-friendly Version
Interactive Discussion
Discussion
P
a
per
|
Dis
cussion
P
a
per
|
Discussion
P
a
per
|
Discussio
n
P
a
per
|
−X
j
kRO2i+RO2j[RO2]i[RO2]j−kisom[RO2]i ≈0 (2)
[RO2]i ≈
kOH+VOCi[OH][VOC]i kRO2i+NO[NO]+kRO2i+HO2[HO2]+
P
jkRO2i+RO2j[RO2]j+kisom
(3)
P(ΣANs)≈X i
γiαikOH+VOCi[OH][VOC]i (4)
where
5
γi = kRO2i+NO[NO]
kRO2i+NO[NO]+kRO2i+HO2[HO2]+
P
jkRO2i+RO2j[RO2]j+kisom
(5)
Here, kisom refers to the rate of a unimolecular isomerization reaction of RO2. This class of reactions has recently been shown to be important when the lifetime of RO2 is long, such as in low NOx conditions (e.g. Peeters et al., 2009; Peeters and M ¨uller, 2010; Crounse et al., 2011).γ (Eq. 5) represents the fraction of RO2that reacts with
10
NO and depends on the identity of the RO2. We calculate specific γ values for per-oxy radicals derived from monoterpenes (α- and β-pinene), isoprene, methacrolein, and methyl vinyl ketone. All other peroxy radicals (which, as shown below, account for only 3 % of theΣANs production) are assumed to behave like methyl vinyl ketone peroxy radicals. Each of theseγ values are calculated using the RO2+HO2rate
calcu-15
lated from the parameterization used in the Master Chemical Mechanism (MCM) v3.2 (Jenkin et al., 1997; Saunders et al., 2003) available at http://mcm.leeds.ac.uk/MCM. We use measured isomerization rates for isoprene peroxy radicals (Crounse et al., 2011) and methacrolein peroxy radicals (Crounse et al., 2012). Although there are the-oretical predictions that peroxy radicals derived from monoterpenes undergo a fast ring
20
ACPD
13, 201–254, 2013Observations of RONO2: NOxsinks
and HNO3 sources E. C. Browne et al.
Title Page
Abstract Introduction
Conclusions References
Tables Figures
◭ ◮
◭ ◮
Back Close
Full Screen / Esc
Printer-friendly Version
Interactive Discussion
Discussion
P
a
per
|
Dis
cussion
P
a
per
|
Discussion
P
a
per
|
Discussio
n
P
a
per
|
parent and thus implicitly assume the isomerization reaction of monoterpene-derived RO2is unimportant for our calculation. We also assume that the isomerization reaction is negligible for the remaining RO2species. Allγ values use the same rate coefficients for RO2+NO (from MCM v3.2) and for RO2+RO2 (the IUPAC CH3O2+C2H5O2 re-action rate available at http://www.iupac-kinetic.ch.cam.ac.uk/, Atkinson et al., 2006).
5
In these calculations, when the measured NO is less than 0 pptv, we assign it a value of 1 pptv. Due to the more complete data coverage, we use the LIF measurements of OH and HO2, however the LIF and CIMS data agree well (Ren et al., 2012) and we see no significant difference when using the CIMS data (Appendix A2). Details regard-ing the VOCs, OH oxidation rates, branchregard-ing ratios, and uncertainties regardregard-ing rate
10
coefficients are described in Appendix A.
The instantaneous production of HNO3 is calculated using the measured OH and NO2. We use the rate constant from Mollner et al. (2010) with the temperature depen-dence from Henderson et al. (2012).
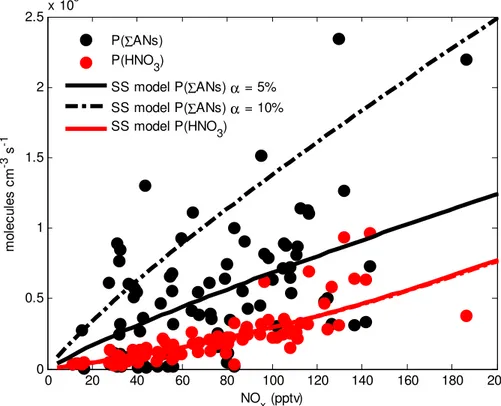
The total calculated P(ΣANs), shown in Fig. 3, is similar to or greater than the
calcu-15
lated nitric acid production. Biogenic species account for the majority (97 %) of P(ΣANs) (Fig. 4) with isoprene (64 %), methyl vinyl ketone (9 %), andαandβ-pinene (25 %) con-tributing the most production. Due to the rapid isomerization of the methacrolein peroxy radical, very few methacrolein nitrates are formed (<1 % of P(ΣANs)). The conclusion that the P(ΣANs) rate is faster than the P(HNO3) rate holds for both the isoprene
ni-20
trate branching ratio of 11.7 % from Paulot et al. (2009) as shown in Fig. 3 and the lower value of 7 % from Lockwood et al. (2010) (details in Appendix A). The time se-ries ofΣANs and isoprene shown in Fig. 1 illustrates how increases inΣANs roughly correspond to increases in the precursors (e.g. isoprene).
Since onlyα and β-pinene were measured aboard the DC-8 aircraft, it is likely that
25
ACPD
13, 201–254, 2013Observations of RONO2: NOxsinks
and HNO3 sources E. C. Browne et al.
Title Page
Abstract Introduction
Conclusions References
Tables Figures
◭ ◮
◭ ◮
Back Close
Full Screen / Esc
Printer-friendly Version
Interactive Discussion
Discussion
P
a
per
|
Dis
cussion
P
a
per
|
Discussion
P
a
per
|
Discussio
n
P
a
per
|
have shown thatα- andβ-pinene represent only a fraction of the monoterpenes (e.g. R ¨ais ¨anen et al., 2009; Hakola et al., 2012). Vertical profile measurements from the sur-face to∼800 m in the boreal forest of Finland also indicate steep vertical gradients in monoterpenes and isoprene (Spirig et al., 2004), indicating that production ofΣANs is likely much faster at altitudes lower than those sampled by the DC-8 aircraft (minimum
5
of∼500 m). Since the composition of monoterpenes is dependent on the ecosystem, we do not attempt to scale the monoterpene measurement. Rather, we note that if the monoterpene concentration is doubled, the monoterpene contribution toΣANs produc-tion increases to 39 % reducing the isoprene contribuproduc-tion to 51 %. The median of the ratio of P(ΣANs) to P(HNO3) also increases from 1.96 to 2.6.
10
Despite this larger production rate of ΣANs than of HNO3, the median concentra-tion ofΣANs (108 pptv) is less than the median concentration of the sum of gas phase HNO3 and particulate NO
−
3 (180 pptv). One possible explanation of this apparent dis-crepancy is that entrainment may have a significant effect on the concentrations. The observed concentration differences during flight segments where the DC-8 crossed
15
the boundary layer indicate that entrainment will dilute both HNO3 and ΣANs. ΣANs have a slightly faster dilution: the median concentration difference above and within the boundary layer is 1.0×10⁹molecules cm−3 forΣANs and 7.0×10⁸molecules cm−3 for HNO3. As an upper limit estimate we assume that the average boundary layer height is 1.5 km and is growing at 10 cm s−1. Even with this dilution correction the production rate
20
ofΣANs is greater than that of HNO3in 50 % of the boundary layer data. In contrast, in 90 % of the data the concentration ofΣANs is less than that of HNO3. Since we use an upper limit estimate of the effect of entrainment and considering the production rate of ΣANs is likely larger than calculated here due to the presence of unmeasured BVOCs (particularly within the forest canopy) we conclude that factors other than entrainment
25
are responsible for the production rate-concentration discrepancy between HNO3and ΣANs.
ACPD
13, 201–254, 2013Observations of RONO2: NOxsinks
and HNO3 sources E. C. Browne et al.
Title Page
Abstract Introduction
Conclusions References
Tables Figures
◭ ◮
◭ ◮
Back Close
Full Screen / Esc
Printer-friendly Version
Interactive Discussion
Discussion
P
a
per
|
Dis
cussion
P
a
per
|
Discussion
P
a
per
|
Discussio
n
P
a
per
|
et al., 2010; Rollins et al., 2010a). For 77 % of the one minute data for which there are both gas phase HNO3 and ΣANs measurements, the concentration of ΣANs is less than the concentration of gas phase HNO3. Therefore, the possible contribution from ΣANs to the AMS NO−3 signal does not affect our conclusions that HNO3 is generally present in higher concentrations thanΣANs.
5
We conclude that the larger production rate yet smaller concentration ofΣANs than of HNO3 implies a shorter lifetime of ΣANs than of HNO3. We note that the lifetime of ΣANs represents the loss of the nitrate functionality and thus will be longer than the average lifetime of individual nitrates because oxidation of some nitrates results in products that are more highly functionalized ANs.
10
4 Lifetime of HNO3
The lifetime of HNO3 in the boundary layer is primarily determined by deposition that, for gas phase HNO3, is generally assumed to occur with unit efficiency at a mass trans-fer rate set by turbulence. Assuming an approximate boundary layer height of∼2 km (we observed boundary layer heights that ranged from 1.5 km to 2.6 km) and a
deposi-15
tion velocity of 4 cm s−1, we calculate a lifetime of∼14 h (loss rate of 2×10⁻⁵s−1) for HNO3 for midday conditions. The deposition velocity of HNO3 over forests has been reported to range from 2 cm s−1to 10 cm s−1(Horii et al., 2005 and references therein), with a strong variation associated with time of day and season. Given the uncertainty and time of day dependence also associated with the boundary layer height, we use
20
this lifetime as a guide for thinking about the daytime lifetime ofΣANs, which our mea-surements indicate is shorter than that of HNO3, and do not focus on the exact number. The depositional loss of aerosol phase NO−3 is generally on the order of days, however, due to its low contribution to total HNO3, we consider only the gas-phase loss. Other losses, photolysis and oxidation by OH, are quite slow with median lifetimes of several
25
ACPD
13, 201–254, 2013Observations of RONO2: NOxsinks
and HNO3 sources E. C. Browne et al.
Title Page
Abstract Introduction
Conclusions References
Tables Figures
◭ ◮
◭ ◮
Back Close
Full Screen / Esc
Printer-friendly Version
Interactive Discussion
Discussion
P
a
per
|
Dis
cussion
P
a
per
|
Discussion
P
a
per
|
Discussio
n
P
a
per
|
5 Lifetime ofΣANs
Using the ARCTAS data we are unable to constrain the exact ΣANs lifetime since to do so would require knowledge of the photochemical age of the airmass, the history of ΣANs production (which is likely to have significant vertical gradients), and the exact chemical speciation of theΣANs. However, with the constraint imposed by the HNO3
5
data and with some reasonable assumptions we can identify the most likelyΣANs loss processes.
5.1 Deposition
Deposition is likely a significant term in theΣANs budget, however, the deposition ve-locity ofΣANs will be less than that of HNO3. The measured Henry’s law coefficients
10
of some of the more soluble individual hydroxy nitrates (∼103–105M atm−1, Shepson et al., 1996; Treves et al., 2000) are orders of magnitude lower than that of HNO3 (1×10¹⁴M atm−1at pH∼6.5, Seinfeld and Pandis, 2006). Still, these measured Henry’s law coefficients of hydroxy nitrates indicate that wet deposition is a significant loss process and a recent study indicates that foliar uptake of organic nitrates is possible
15
(Lockwood et al., 2008). The only direct simultaneous measurements of ΣANs and HNO3 deposition are those of Farmer and Cohen (2008) who estimated a ΣANs dry deposition velocity of 2.7 cm s−1compared to 3.4 cm s−1for HNO3above a ponderosa pine forest. Similar results have been obtained more recently at the same forest (K.-E. Min, personal communication, 2012). Although the exact magnitude of the depositional
20
loss likely depends on the specific composition of ΣANs, as well as the partitioning between gas and aerosol, we assume that a similar result exists for the boreal for-est since recent measurements of speciated organic nitrates using chemical ionization mass spectrometry at the ponderosa pine forest (Beaver et al., 2012) indicate a similar composition ofΣANs as assumed here from the instantaneous production rate.
There-25
ACPD
13, 201–254, 2013Observations of RONO2: NOxsinks
and HNO3 sources E. C. Browne et al.
Title Page
Abstract Introduction
Conclusions References
Tables Figures
◭ ◮
◭ ◮
Back Close
Full Screen / Esc
Printer-friendly Version
Interactive Discussion
Discussion
P
a
per
|
Dis
cussion
P
a
per
|
Discussion
P
a
per
|
Discussio
n
P
a
per
|
HNO3, thus implying the existence of other sinks of ΣANs. In other words, chemistry must be an important sink ofΣANs.
5.2 Photolysis
The OH oxidation of both isoprene and monoterpenes produces hydroxy nitrates as first generation products. These molecules account for at least 89 % of the instantaneous
5
production rate ofΣANs (Fig. 4) for the conditions considered here. Although there are no direct measurements of the photolysis rates of these specific molecules, by analogy to other compounds we estimate that photolysis is a negligible sink for them. Roberts and Fajer (1989) report that the cross section of nitrooxy ethanol is approximately a fac-tor of three smaller than methyl nitrate. Similarly, photolysis rates of alkyl nitrates are
10
on the order of several days (e.g. Roberts and Fajer, 1989; Talukdar et al., 1997) and are thus too slow to be important. In contrast,α-nitrooxy ketones have been shown to have a cross section approximately five times larger than alkyl nitrates (Roberts and Fajer, 1989; Barnes et al., 1993). Our calculations suggest these are too small a frac-tion of the total to affect the overall lifetime. To estimate an upper limit, we use the
15
fastest reported photolysis rate from Suarez-Bertoa et al. (2012), which is for 3-methyl-3-nitrooxy-2-butanone. This rate was calculated assuming solar conditions appropriate for 1 July at noon at 40◦N. To achieve a rate appropriate for the ARCTAS conditions we use the median rates of methyl and ethyl nitrate photolysis measured during ARCTAS and scale these to the rate of 3-methyl-3-nitrooxy-2-butanone using the measurements
20
of Roberts and Fajer (1989) and Suarez-Bertoa et al. (2012). We take the average of the rate calculated from methyl nitrate and from ethyl nitrate and assume that 9 % of the nitrates (the methyl vinyl ketone contribution in Fig. 4) areα-nitrooxy ketones. This results in an overall photolysis rate forΣANs of 2.5×10⁻⁶s−1(lifetime of∼110 h), a rate that even when combined with deposition is too slow to account for the inferredΣANs
25
ACPD
13, 201–254, 2013Observations of RONO2: NOxsinks
and HNO3 sources E. C. Browne et al.
Title Page
Abstract Introduction
Conclusions References
Tables Figures
◭ ◮
◭ ◮
Back Close
Full Screen / Esc
Printer-friendly Version
Interactive Discussion
Discussion
P
a
per
|
Dis
cussion
P
a
per
|
Discussion
P
a
per
|
Discussio
n
P
a
per
|
5.3 Oxidation
The overall gas-phase chemical removal rate ofΣANs can be represented as:
kox-loss=
X
i
kANi+OX[OX] [ANi]
[ΣANs]χi (6)
wherekANi+OXthe rate constant of that oxidant with the specific nitrate, [OX] represents the concentration of oxidant (OH, O3, or NO3), [ANi] represents the concentration of
5
a specific nitrate, andχi the fraction of the reaction that results in loss of the nitrate functionality (referred to as NOx recycling). To simplify our calculation, we neglect the possibility that the oxidation of nitrates results in the formation of dinitrates which would result in a small positive term in Eq. (6). We also ignore oxidation by NO3since we only use daytime measurements above the forest canopy.
10
We estimate the composition of ΣANs as a mixture of the small, long-lived, alkyl nitrates measured in the whole air samples (which account for a median of 30 % of the ΣANs measured by TD-LIF) and molecules that can be estimated from the in-stantaneous production rate of ΣANs (Fig. 4). The small nitrates have very long life-times and are a negligible term in the overall loss rate. We use the OH oxidation
15
rates of isoprene-derived nitrates (assuming 60 % δ-hydroxy isoprene nitrates and 40 %β-hydroxy isoprene nitrates) and methyl vinyl ketone-derived nitrates from Paulot et al. (2009). Recently, Lockwood et al. (2010) have measured the ozone oxidation rate of three of the eight possible isoprene nitrate isomers. The three isomers include one δ-hydroxy isomer and two β-hydroxy isomers. We assume that the δ-hydroxy
20
isoprene nitrate rate constant from Lockwood et al. (2010) is representative of all δ-hydroxy isomers. The rate constants for twoβ-hydroxy isomers differ by approximately a factor of three and we bound the possible range of reaction rates using these two rates. This results in an ozonolysis rate ranging from 7.4×10⁻¹⁷cm3molecules−1s−1 to 1.7×10⁻¹⁶cm3molecules−1s−1. Results using the branching ratio between the δ
ACPD
13, 201–254, 2013Observations of RONO2: NOxsinks
and HNO3 sources E. C. Browne et al.
Title Page
Abstract Introduction
Conclusions References
Tables Figures
◭ ◮
◭ ◮
Back Close
Full Screen / Esc
Printer-friendly Version
Interactive Discussion
Discussion
P
a
per
|
Dis
cussion
P
a
per
|
Discussion
P
a
per
|
Discussio
n
P
a
per
|
andβ-hydroxy nitrate channels as determined by Lockwood et al. (2010) are included in Appendix B.
We are unaware of any experimental constraints on the oxidation rate of monoter-pene nitrates by OH and we estimate an OH oxidation rate constant of 4.8× 10⁻¹²cm3molecules−1s−1 based on a weighting of the MCM v3.2 rates for α-pinene
5
andβ-pinene nitrates as described in Browne et al. (2013). The monoterpene nitrates in our calculations are based on the production from the observed concentrations of α- andβ-pinene, the only two monoterpenes measured aboard the aircraft. These ni-trates will predominantly be saturated molecules and thus ozonolysis of these nini-trates should be too slow to be important. As discussed in Sect. 3, it is likely that the
contribu-10
tion of monoterpene nitrates is underestimated. It is therefore possible that some of the monoterpene-derived nitrates may be unsaturated molecules. We discuss the impact of this possibility in Appendix B and conclude that since the release of NO2from these molecules following oxidation is likely low, the effect on the oxidation rate is minimal.
The NOx recycling (χ) following OH oxidation depends on the fate of the resulting
15
nitrooxy peroxy radical (R(NO3)O2) which may react with NO, HO2, or other RO2. We assume that reactions with HO2generate a more highly functionalized nitrate and that the NOxrecycling (the loss of the nitrate functionality) occurs with the same efficiency through both the R(NO3)O2+NO and R(NO3)O2+RO2 channels. We use the same assumptions for the R(NO3)O2+HO2rate as in the calculation ofγin Sect. 3, however,
20
we assume that no isomerization reactions occur. We find that RO2+RO2 reactions account for at most 1 % of the RO2 reactions. Uncertainties regarding these estima-tions are discussed in Appendix B. NOx recycling from the RO2+NO reaction have been constrained by laboratory experiments to be ∼55 % for isoprene nitrates and 100 % for MVK nitrates (Paulot et al., 2009). We are unaware of any measurements of
25
ACPD
13, 201–254, 2013Observations of RONO2: NOxsinks
and HNO3 sources E. C. Browne et al.
Title Page
Abstract Introduction
Conclusions References
Tables Figures
◭ ◮
◭ ◮
Back Close
Full Screen / Esc
Printer-friendly Version
Interactive Discussion
Discussion
P
a
per
|
Dis
cussion
P
a
per
|
Discussion
P
a
per
|
Discussio
n
P
a
per
|
monoterpene nitrates to NOxrecycling is negligible making a more accurate estimate unnecessary.
NOx recycling following ozonolysis of unsaturated nitrates (isoprene nitrates) de-pends on the initial branching of the ozonide to the two possible pairs of a carbonyl molecule and an energy-rich Criegee biradical and the subsequent fate of the Criegee
5
biradical (stabilization or decomposition). To our knowledge, no experimental con-straints on this process exist for any unsaturated organic nitrate. The MCM v3.2 as-sumes equal branching between the two possible carbonyl/Criegee biradical pairs; we calculate NOx recycling (40 %) using the MCM v3.2 products of the ozonolysis of iso-prene nitrates, the assumption that a stabilized Criegee biradical reacts only with
wa-10
ter, and the relative abundances of the different isoprene nitrate isomers from Paulot et al. (2009) (ignoring the minor 3,4 and 2,1 isomers). Using the relative abundances of the different isoprene nitrate isomers from Lockwood et al. (2010) results in a NOx recycling of 37 %.
Our calculation of theΣANs loss rate can be summarized by expanding Eq. (6) to:
15
kox-loss=
X
i
kANi+OH[OH] [ANi]
[ΣANs]βi(1−FRO2i+HO2)+
X
i
kANi+O3[O3] [ANi]
[ΣANs]δi (7)
FRO2+HO2=
kRO2i+HO2[HO2] kRO2i+NO[NO]+kRO2i+HO2[HO2]+
P
jkRO2i+RO2j[RO2j]
(8)
Here, β represents the fraction of NOx recycled following the reaction of the peroxy radical with RO2 or NO, FRO2+HO2 (Eq. 8) represents the fraction of the time that the
20
peroxy radical reacts with HO2(and thus does not recycle NOx), andδ represents the NOx recycling from ozonolysis. Uncertainties regarding this calculation are described in Appendix B.
Using the assumptions above, we calculate a chemical ΣANs lifetime of ∼9–18 h (Table 2) which ranges from slightly shorter to slightly longer than our estimated HNO3
25
ACPD
13, 201–254, 2013Observations of RONO2: NOxsinks
and HNO3 sources E. C. Browne et al.
Title Page
Abstract Introduction
Conclusions References
Tables Figures
◭ ◮
◭ ◮
Back Close
Full Screen / Esc
Printer-friendly Version
Interactive Discussion
Discussion
P
a
per
|
Dis
cussion
P
a
per
|
Discussion
P
a
per
|
Discussio
n
P
a
per
|
a detailed representation of oxidativeΣANs loss results in a calculatedΣANs lifetime in the range of the assumed lifetime of HNO3. In these calculations, the majority of ΣANs loss occurs via isoprene nitrate ozonolysis, which has recently been reported to be much faster than previously assumed (Lockwood et al., 2010). Additional measure-ments of this rate and the products are important to constraining our understanding of
5
ΣANs and their role in the NOx budget.
5.4 Hydrolysis of particulate organic nitrates
5.4.1 Loss ofΣANs
Although we calculate aΣANs loss rate due to oxidation and deposition that is similar to the assumed loss rate of HNO3, the recent suggestion that organic nitrates may
un-10
dergo hydrolysis in aerosols to produce HNO3 as a product (Sato, 2008; Darer et al., 2011; Hu et al., 2011) is also a viable hypothesis to explain the measurements. Evi-dence for organic nitrate losses in ambient (Day et al., 2010) and chamber generated particles (Liu et al., 2012) analyzed with IR spectroscopy is consistent with this mech-anism. This chemistry results in the depletion ofΣANs and an enhancement in HNO3;
15
both effects would contribute to the ratio ofΣANs to HNO3production and concentra-tion that we report here.
Bulk solution studies of hydrolysis of organic nitrates indicate that primary and sec-ondary nitrates are stable at atmospherically relevant pH, but that the lifetime of tertiary hydroxy organic nitrates is surprisingly short (0.019–0.67 h), even in neutral solutions
20
(Darer et al., 2011; Hu et al., 2011). Since these are bulk solution studies, there are some difficulties associated with extending the rates to aerosol processes. Namely, the question arises as to whether the nitrates are present in the organic or aqueous phase of the aerosol and if the availability of liquid water is sufficient for the reaction. Some of these issues have been recently discussed by Liu et al. (2012) who, using a smog
25
ACPD
13, 201–254, 2013Observations of RONO2: NOxsinks
and HNO3 sources E. C. Browne et al.
Title Page
Abstract Introduction
Conclusions References
Tables Figures
◭ ◮
◭ ◮
Back Close
Full Screen / Esc
Printer-friendly Version
Interactive Discussion
Discussion
P
a
per
|
Dis
cussion
P
a
per
|
Discussion
P
a
per
|
Discussio
n
P
a
per
|
of the organic aerosol composition, they calculated a lifetime of ∼6 h for particulate organic nitrates when the relative humidity was greater than 20 %.
Since the vapor pressures of first generation isoprene nitrates are generally too high to partition into aerosol (Rollins et al., 2009), we begin the estimation of the hydrolysis rate by assuming that only monoterpene nitrates are present in organic aerosol.
Al-5
though Henry’s law coefficients of small (≤5 carbons) hydroxy nitrates have been mea-sured to be quite large, approximately∼103–105M atm−1(Shepson et al., 1996; Treves et al., 2000), it is reasonable to assume that as a ten carbon compound, a monoterpene nitrate may have a lower Henry’s law coefficient. We therefore assume that these ni-trates partition only into organic aerosol and that the organic aerosol contains sufficient
10
liquid water for this reaction to occur (median RH of 63 % and minimum of 34 %). We use absorptive partitioning theory to determine the fraction of the monoterpene nitrate in the particle phase (Pankow, 1994; Donahue et al., 2006):
C∗ i =
CigCOA Cia =
MWi·106·ζi·pi
760·R·T (9)
Here C∗i represents the effective saturation concentration (µg m−3) of the organic
ni-15
trate,Cia is the concentration of the organic nitrate in the condensed phase (µg m−3), Cgi the concentration of the organic nitrate in the gas phase (µg m−3), and COA is the concentration of organic aerosol (µg m−3). In the second equalityRis the universal gas constant (8.206×10⁻⁵atm m3K−1mol−1), MWi is the molecular weight of the organic nitrate (assumed here to be a hydroxy monoterpene nitrate – 215 g mol−1), ζi is the
20
molality based activity coefficient (assumed to be 1), pi is the vapor pressure of the organic nitrate (Torr), and 760 and 106 are unit conversion factors. We calculate an estimated bound on the partitioning of monoterpene nitrates to the aerosol using vapor pressures of 4×10⁻⁶Torr (C∗
i =of 48 µg m −3
at 286 K – the median temperature during ARCTAS) derived from chamber measurements of nitrate products of the NO3+
β-25
ACPD
13, 201–254, 2013Observations of RONO2: NOxsinks
and HNO3 sources E. C. Browne et al.
Title Page
Abstract Introduction
Conclusions References
Tables Figures
◭ ◮
◭ ◮
Back Close
Full Screen / Esc
Printer-friendly Version
Interactive Discussion
Discussion
P
a
per
|
Dis
cussion
P
a
per
|
Discussion
P
a
per
|
Discussio
n
P
a
per
|
measurements of the NO3+limonene reaction (Fry et al., 2011). The organic aerosol loading is from the AMS measurement and can be subdivide into two distinct regimes: one with a median loading of∼1 µg m−3 (at ambient temperature and pressure) and one with a median loading of ∼6.6 µg m−3. The enhanced loading regime (60 % of the data) was associated with higher concentrations of acetone, a known oxidation
5
product of monoterpenes, suggesting that monoterpenes are an important source of SOA. This is consistent with measurements in southern Ontario reporting high con-centrations of biogenic SOA (Slowik et al., 2010). The concentration of the biogenic species (α-pinene,β-pinene, isoprene, MVK, and MACR) were all higher in the regime of enhanced organic aerosol loading than in the lower loading regime. The isoprene
ox-10
idation products showed higher enhancements (e.g. 181 % equivalent to 278 pptv for MVK) than did isoprene (18 % – 53 pptv). The concentration enhancement of acetone (117 % – 1.23 ppbv) was also larger than that of the monoterpenes (105 % – 122 pptv), however, the long lifetime and multiple sources of acetone make a direct attribution to monoterpene oxidation impossible. Nevertheless, it is clear that the enhanced loading
15
regime represents a larger biogenic influence and is more aged than the lower loading regime.
The fraction of the monoterpene nitrate in the aerosol (Faero) is calculated using Eq. (10).
Faero= Cia
Cai +Cig = 1+ C∗
i COA
!−1
(10)
20
We calculate the loss rate ofΣANs through hydrolysis (khyd-loss) using Eq. (11):
khyd-loss=
X
i
khydFaero,iFtertiary,i [ANi]
[ΣANs] (11)
ACPD
13, 201–254, 2013Observations of RONO2: NOxsinks
and HNO3 sources E. C. Browne et al.
Title Page
Abstract Introduction
Conclusions References
Tables Figures
◭ ◮
◭ ◮
Back Close
Full Screen / Esc
Printer-friendly Version
Interactive Discussion
Discussion
P
a
per
|
Dis
cussion
P
a
per
|
Discussion
P
a
per
|
Discussio
n
P
a
per
|
nitrates and 92 % for β-pinene nitrates from MCM v3.2. We note that the fraction of ΣANs predicted to be derived from monoterpenes based on the instantaneous produc-tion rate changes insignificantly between the low and enhanced loadings and we use the value from Fig. 4. However, in the low loading regime the small alkyl nitrates rep-resent a larger fraction of ΣANs (61 %) than in the enhanced loading regime (23 %).
5
Thus, the absolute fraction of ΣANs from monoterpene nitrates is higher in the en-hanced loading regime.
Based on the work by Elrod and co-workers (Darer et al., 2011; Hu et al., 2011) showing an order of magnitude variation in the tertiary nitrate hydrolysis lifetime, it appears that the identity of the organic nitrate influences the hydrolysis rate. Although
10
these bulk solution rates may not be strictly applicable to aerosol processes, it is also likely that the lifetime reported by Liu et al. (2012) for 1,2,4 – trimethylbenzene-derived organic nitrates may not apply to biogenic systems. Therefore, we calculate the overall ΣANs hydrolysis rate (khyd-loss) for three different combinations of hydrolysis rates (khyd) andC∗
values as shown in Table 3.
15
In the enhanced loading regime these rates range from 2 % to 20 % of the oxida-tive lifetime (assuming the faster ozonolysis rate). It should be emphasized that the hydrolysis loss rate calculated here is reflective of the hydrolysis loss rate averaged over all the individual organic nitrates; in other words, the loss rate of an individual nitrate might be faster or slower than this rate. In fact, the rate calculated here is the
20
result of only∼2 % (C∗=48 µg m−3) or∼7 % (C∗=7 µg m−3) of theΣANs undergoing hydrolysis in the enhanced loading regime and for<1 % of theΣANs (regardless ofC∗ value) undergoing hydrolysis in the low loading regime. Any changes to this fraction will result in proportional changes to the overall hydrolysis rate. Consequently, due to the chemical complexity of this process our range of rates should not be taken as upper
25
ACPD
13, 201–254, 2013Observations of RONO2: NOxsinks
and HNO3 sources E. C. Browne et al.
Title Page
Abstract Introduction
Conclusions References
Tables Figures
◭ ◮
◭ ◮
Back Close
Full Screen / Esc
Printer-friendly Version
Interactive Discussion
Discussion
P
a
per
|
Dis
cussion
P
a
per
|
Discussion
P
a
per
|
Discussio
n
P
a
per
|
This loss process ofΣANs is important in that unlike the oxidative pathway, hydrolysis represents a sink ofΣANs that removes NOxfrom the atmosphere.
5.4.2 Production of HNO3
In addition to being a sink ofΣANs the hydrolysis reaction may also be an important source of HNO3. As shown in Table 3, the ratio of this HNO3 source to the known
5
source from the reaction of OH with NO2and ranges from a median of 0.13 to greater than 1 in the enhanced loading regime. We believe that this upper limit is likely incom-patible with the HNO3budget and is likely the result of extrapolating bulk solution rates to aerosol environments; however, we do find evidence of this HNO3source in the vari-ation of the ratio of HNO3 to NO2with NOx. In the boundary layer when the lifetime of
10
HNO3 is short, HNO3 is in photochemical steady state and the ratio of HNO3 to NO2 should be proportional to the OH concentration (Day et al., 2008). We estimate the life-time of HNO3to be∼14 h, a value short enough that HNO3should be in diurnal steady state. However, as NOx decreases the ratio of HNO3 to NO2 increases while the OH concentration decreases (Fig. 5a). These higher HNO3 to NO2 ratios are associated
15
with higher ΣANs concentrations (Fig. 5a) as well as with higher monoterpene con-centrations (and thus presumably higher aerosolΣANs concentration-not shown) con-sistent with an additional source of HNO3fromΣANs. This trend of increasing values as NOxdecreases is also the same trend as the ratio of P(ΣANs) to P(HNO3) (where P(HNO3)=kOH+NO2[OH][NO2]) as shown in Fig. 5b using results from the steady-state
20
model in Browne and Cohen (2012). The similarity in magnitude between the HNO3to NO2ratio and the P(ΣANs) to P(HNO3) ratio is expected if the hydrolysis ofΣANs con-stitutes the major loss process ofΣANs (i.e. that the ratio of hydrolysis to oxidation may be higher than our calculations here suggest). These results suggest that the ARCTAS HNO3concentration is consistent with a source of HNO3other than the reaction of OH
25
with NO2and that this source is likely the hydrolysis ofΣANs.
ACPD
13, 201–254, 2013Observations of RONO2: NOxsinks
and HNO3 sources E. C. Browne et al.
Title Page
Abstract Introduction
Conclusions References
Tables Figures
◭ ◮
◭ ◮
Back Close
Full Screen / Esc
Printer-friendly Version
Interactive Discussion
Discussion
P
a
per
|
Dis
cussion
P
a
per
|
Discussion
P
a
per
|
Discussio
n
P
a
per
|
for a temperature dependent OH source (Day et al., 2008) and of an elevated within canopy OH concentration (Farmer and Cohen, 2008) in a ponderosa pine forest. How-ever, these results are also consistent with a source of HNO3 from rapidΣANs hydrol-ysis. For instance, the temperature dependent OH source may result from an increase in biogenic VOC emissions with temperature resulting in a largerΣANs production and
5
consequently a larger HNO3 source. Likewise, the rapid hydrolysis of ΣANs with low vapor pressures formed from sesquiterpenes and monoterpenes in the forest canopy would result in a within canopy source of HNO3. This reinterpretation of the HNO3 data as resulting from an additional production pathway (via hydrolysis ofΣANs) rather than through an elevated concentration of OH is also more consistent with OH
mea-10
surements made in the same forest a few years later (Mao et al., 2012) that report a within-canopy OH gradient and temperature dependence smaller than that inferred from the previous studies. However, we note that these studies were conducted in dif-ferent years and it is possible that the ecosystem and its within-canopy chemistry have changed in between those years.
15
It is interesting to consider the ultimate fate of the NO−3 possibly produced by the organic nitrate hydrolysis. In 57 % of the background measurements the molar ratio of sulfate to ammonium (as measured by the AMS) is greater than one-half, indicating that it is unfavorable for NO−3 to be present in the aerosol and thatΣANs hydrolysis is possibly a source of gas phase HNO3. However, this is a simplistic approximation to
20
an extremely complex problem. The thermodynamics of an aerosol that is an organic-inorganic mixture are much more complex (Zuend et al., 2011) than purely organic-inorganic aerosols and are subject to uncertainties regarding the composition of aerosol and the interaction of ions with various functional groups present on organic species. Further studies on organic nitrate hydrolysis in aerosols are needed to better constrain the
25
atmospheric impacts, however it appears that the hydrolysis of organic nitrates may contribute (quite significantly) to HNO3production.
ACPD
13, 201–254, 2013Observations of RONO2: NOxsinks
and HNO3 sources E. C. Browne et al.
Title Page
Abstract Introduction
Conclusions References
Tables Figures
◭ ◮
◭ ◮
Back Close
Full Screen / Esc
Printer-friendly Version
Interactive Discussion
Discussion
P
a
per
|
Dis
cussion
P
a
per
|
Discussion
P
a
per
|
Discussio
n
P
a
per
|
of how the hydrolysis of organic nitrates from biogenic species differs in aerosol versus bulk solution, the aerosol liquid water content necessary for this reaction, and specific rates for monoterpene nitrates.
6 Implications
As shown in Fig. 3, the calculatedΣANs production for most of the data is similar to
5
the steady-state model results from Browne and Cohen (2012) if we assume a branch-ing ratio somewhere between 5 % and 10 % forΣANs formation from the entire VOC mixture. For the ARCTAS data we calculate that the biogenic VOCs account for∼53 % of the VOC reactivity (median value not including CO and CH4). Assuming that the biogenic VOCs are the only sources ofΣANs with an average branching ratio of 11 %
10
(similar to isoprene), results in an overall branching ratio of∼6 %. This suggests that the NOx lifetime and ozone production efficiency in the boreal forest are similar to those calculated in Browne and Cohen (2012) and that the steady-state model pro-vides a useful framework for understanding the NOx budget under low NOx conditions on the continents.
15
However, as discussed in Browne and Cohen (2012), the net regional and global impact ofΣANs on NOxlifetime and ozone production depends on the degree to which ΣANs serve as a permanent versus temporary NOxsink. Modeling studies have found that different assumptions regarding NOxrecycling from isoprene nitrates result in large sensitivities in NOx and O3 (e.g. von Kuhlmann et al., 2004; Paulot et al., 2012; Fiore
20
et al., 2005; Horowitz et al., 2007; Wu et al., 2007) and that these uncertainties affect predictions of ozone in a future climate (e.g. Ito et al., 2009; Weaver et al., 2009). The analysis presented here suggests thatΣANs have a short atmospheric lifetime due to a combination of deposition and chemical loss, but we find the data is ambiguous about the relative fraction of theΣANs chemical loss that acts to release NOx or to produce
25
ACPD
13, 201–254, 2013Observations of RONO2: NOxsinks
and HNO3 sources E. C. Browne et al.
Title Page
Abstract Introduction
Conclusions References
Tables Figures
◭ ◮
◭ ◮
Back Close
Full Screen / Esc
Printer-friendly Version
Interactive Discussion
Discussion
P
a
per
|
Dis
cussion
P
a
per
|
Discussion
P
a
per
|
Discussio
n
P
a
per
|
dominated by isoprene emissions versus in forests dominated by monoterpene emis-sions since first generation monoterpene nitrates have lower vapor pressures than first generation isoprene nitrates.
Due to the lumped treatment ofΣANs in most condensed chemical mechanisms, it is likely that these mechanisms will be unable to reproduce the ARCTAS results, and
5
consequently are misrepresenting the NOxlifetime and ozone production. For instance, some condensed mechanisms instantaneously convert isoprene nitrates to HNO3, re-sulting in zero NOx recycling. The ozonolysis of isoprene nitrates is also ignored in many mechanisms; this is incompatible with our results that the majority of NOx re-cycling during ARCTAS results from ozonolysis. Lastly, many condensed mechanisms
10
ignore monoterpene nitrates or lump them into a long lived nitrate. Our results suggest that, at least in the boreal forest, monoterpene nitrates are an important NOxsink and that their particle phase hydrolysis may represent a source of HNO3.
Finally, it is interesting to note that since the loss of ΣANs through hydrolysis de-pends on the specific isomer of the nitrate, there are interesting implications for the
15
loss of monoterpene nitrates formed from OH versus from NO3 chemistry. Based on the assumption that tertiary radicals are more stable than primary radicals and thus have a higher nitrate yield, the oxidation of α- or β-pinene and limonene by NO3 is more likely to result in a primary nitrate and oxidation by OH is more likely to result in a tertiary nitrate. Thus, nitrates formed by OH oxidation may have a shorter
atmo-20
spheric lifetime than those formed from NO3chemistry.
7 Conclusions
We present the first measurements ofΣANs over the remote boreal forest of Canada and show that ΣANs are present in significant concentrations. Using measurements of VOCs we calculate the instantaneous production rate ofΣANs and find that, as
ex-25
ACPD
13, 201–254, 2013Observations of RONO2: NOxsinks
and HNO3 sources E. C. Browne et al.
Title Page
Abstract Introduction
Conclusions References
Tables Figures
◭ ◮
◭ ◮
Back Close
Full Screen / Esc
Printer-friendly Version
Interactive Discussion
Discussion
P
a
per
|
Dis
cussion
P
a
per
|
Discussion
P
a
per
|
Discussio
n
P
a
per
|
underestimate the total source of monoterpenes then monoterpenes play an even larger role, than the 25 % we calculate. We also find that the instantaneous produc-tion rate ofΣANs is, in general, faster than that of gas phase HNO3production, despite a lower overall concentration, implying thatΣANs have a shorter lifetime than HNO3. We estimate that depositional loss of ΣANs is important and that and the combined
5
loss to reaction with O3and OH occurs at a rate similar to the assumed deposition rate of HNO3. Oxidation of isoprene nitrates, in particular by O3, is primarily responsible for the rapid loss rate. We emphasize that this oxidative loss rate represents the loss of the nitrate functionality and that oxidative reactions of individual nitrates are faster since some of their products are more highly functionalized nitrates.
10
We also provide evidence that particulate organic nitrates undergo rapid hydrolysis contributing to HNO3 production. Although, we are unable to constrain the magnitude of this source precisely, all reasonable assumptions imply that it is significant both as a loss ofΣANs and is a source of HNO3. Furthermore, there is evidence of its existence in the variation of the HNO3 to NO2 ratio as a function of NOx. We conclude that
15
the rapid loss of ΣANs required to explain these observations is a balance between processes which recycle NOx (oxidation) and those which remove it (hydrolysis and deposition).
Appendix A
A1 Calculation ofΣANs production
20
ACPD
13, 201–254, 2013Observations of RONO2: NOxsinks
and HNO3 sources E. C. Browne et al.
Title Page
Abstract Introduction
Conclusions References
Tables Figures
◭ ◮
◭ ◮
Back Close
Full Screen / Esc
Printer-friendly Version
Interactive Discussion
Discussion
P
a
per
|
Dis
cussion
P
a
per
|
Discussion
P
a
per
|
Discussio
n
P
a
per
|
A2 Uncertainties in the calculation ofΣANs production
The calculated production ofΣANs is sensitive to the assumptions about reaction rates, organic nitrate branching ratios, the assumption that the VOC measurements are repre-sentative of the entire VOC mix, and possible errors in measurements. We have inves-tigated several possibilities (outlined in Table A2) and find that our conclusion is robust.
5
In Table A2 we show the median value of the ratio of the instantaneous production of ΣANs to HNO3for ten different possibilities (including our base case that was presented in the text). In the unique RO2+RO2rate case we take the rate of RO2+RO2reactions from MCM v3.2 RO2+CH3O2 rates for methyl vinyl ketone, methacrolein, isoprene, and monoterpenes. We weight the methyl vinyl ketone and isoprene rates by the initial
10
branching of the different peroxy radicals. The monoterpene rate is calculated assum-ing an even split betweenα- andβ-pinene and weighting the different peroxy radicals. No significant difference is observed using these rates. If we increase the isomerization rate of the isoprene peroxy radical by an order of magnitude (Isomerization×10 case), we also observe no significant difference.
15
Recent measurements of the isoprene nitrate branching ratio range from 7 % to 12 % (Paulot et al., 2009; Lockwood et al., 2010). In our base calculation we use the branch-ing ratio of 11.7 % reported by Paulot et al. (2009). In the 7 % IN case below, we use the yield of 7 % measured by Lockwood et al. (2010) and find that although the contribution from isoprene decreases, P(ΣANs) is still larger than P(HNO3).
20
It is also likely that there are VOCs contributing to organic nitrate production that were not measured during ARCTAS, and thus the base calculation is biased low. For in-stance, only the monoterpenesα-pinene andβ-pinene are measured. Measurements from the boreal forest in Finland indicate substantial contributions from other monoter-penes as well as contributions from sesquitermonoter-penes (Spirig et al., 2004; R ¨ais ¨anen et al.,
25