Getting the most out of RNA-seq data analysis
Texto
Imagem

Documentos relacionados
for April for the di ff erent scenarios shown in Table 1 used for the CMAM model and the ACE data (details same as Fig.. ACE CO profiles
ART theory are compared for di ff erent snow types and it was observed that presently grain size model using two channel method (one in visible and another in NIR
Ratio of calculated to measured CCN number concentrations as a function of organic mass fraction for seven di ff erent data sets and di ff erent assumptions of hygroscopicity and
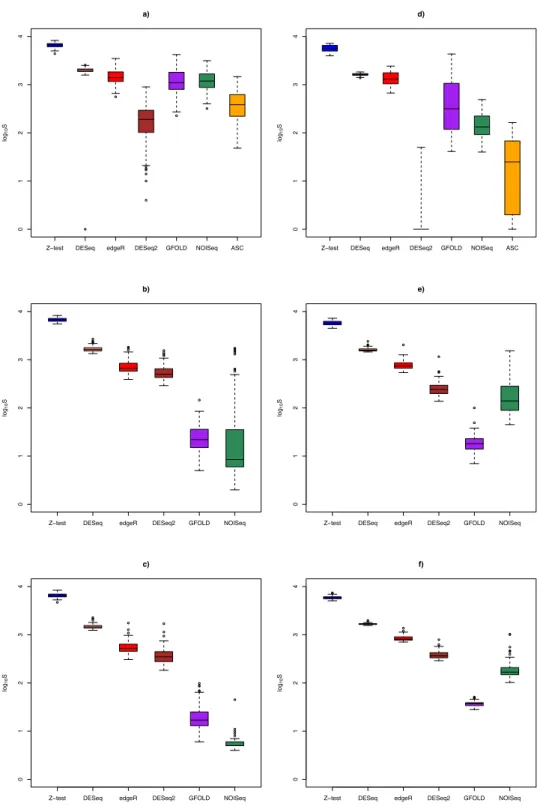
It should be clear but worth emphasizing that when using a numerical measure to identify stably expressed genes, the outcome depends on multiple factors: the background sample set
The purposes of this paper are: (1) to investigate the e ff ect of di ff erent scenarios of antecedent soil moisture organisation on the runo ff in a distributed hydrologic model at
To test the utility of RNA CoMPASS to identify pathogens within biological specimens we used RNA-seq data sets from two distinct B-cell types, lymphoblastoid cell lines (LCLs)
We expect di ff erences to be associated with (i) the di ff erent vertical sensitivity of the two sensors, (ii) with the a priori assumptions, (iii) the auxiliary data (e.g.
We used di ff erent available products (satellite data, field measurements, models and flux towers) to estimate C stocks and fluxes in the country at three di ff erent time
