Trip Rates for Condominium Construction
Project
Wirach Hirun #1 #
Department of Civil and Environmental Engineering,Kasetsart University Chalermprakiat Sakon Nakhon Province Campus 59 Moo 1 Chiangkear subdistrict, Muang district, Sakon Nakhon province, Thailand.
1
wirach@hotmail.com
Abstract—The number of large scale condominium construction projects had dramatically increased
in Bangkok. Many projects had occurred in either densely populated areas or in central business districts, where traffic conditions were usually highly congested. To prevent traffic problems, a traffic impact study must be prepared and submitted for review by concerned public authorities. Unit trip generation rates were important data in traffic impact analysis. Without accurate unit trip generation rates, public agencies could not obtain accurate information on the traffic that will be generated. This study aimed to study trip rates and the factors affecting them for condominium construction project in Bangkok. The data were collected from 30 condominium construction sites located in 15 districts of Bangkok. The analysis used the linear regression method and was divided into three cases: 1) trip rates for all vehicles, 2) trip rates for classified vehicles, and 3) trip rates for all types of condominium. All case analyses considered weekdays, Saturday, and Sunday. The results found that trip rates related to the number of dwellings in the condominium. The trip rates for all vehicle types on weekdays, Saturday, and Sunday were 4.202, 2.483, and 1.246 vehicles per 100 dwelling units per day respectively. The trip rates for six-wheeled and ten-wheeled trucks on weekdays and Saturday were 2.046 and 0.975 vehicles per 100 dwelling units per day respectively. The trip rate for four-wheeled trucks and passenger cars on weekdays was 1.960. Regarding condominium types, the trip rate for low rise condominiums for all vehicle types on weekdays was 5.315 while the trip rates for high rise condominiums for weekdays, Saturday, and Sunday were 3.965, 2.667, and 1.261 respectively.
Keyword-Trip rate, Traffic impact, Trip generation, Traffic evaluation, Condominium construction
I.INTRODUCTION
The number of land development projects in Bangkok has dramatically increased. Among these projects, condominiums are one of the most popular land development projects in Bangkok. A number of large scale condominium construction projects have occurred in either densely populated areas or central business districts, where traffic conditions are usually highly congested. This has caused severe impacts to varying degrees on traffic at or around the project areas during both construction and operation phases.
Especially during construction, many types of traffic enter and exit construction sites, including medium trucks, heavy trucks, and passenger cars. Heavy trucks carry materials to the site while medium trucks carry workers. The sales office is always located nearby as well, so customers visit the site.
Traffic impact assessment (TIA) is a powerful tool for engineers and planners to determine the possible effects of a project on the traffic system [1]. Thus, to evaluate the impacts of traffic of the construction project on roadway congestion, a traffic impact study and strategies to mitigate these traffic impacts must be prepared, and developers are required to submit a traffic impact assessment report for review by concerned public authorities as part of the project approval process.
To determine the traffic impact of a project on the transportation and traffic along the road network within its influence/impact areas, it is important to know how much traffic will be generated. Generated traffic can be directly collected for existing projects, while it must be predicted for future projects. Prediction requires a known proxy variable from the project and use equation, called the unit trip generation rate, to calculate generated traffic.
II.LITERATURE REVIEW
Trip rates are stated in vehicle trip ends and given for different land uses. The most well-known sources of trip generation equations and rates worldwide are Trip Generation Manual and Trip Generation Handbook, published by The Institute of Transportation Engineers (ITE). Some national road and traffic authorities have also attempted to explore the trip rates for their countries, such as the Philippines [2], Australia and New Zealand [3], and United Arab Emirates. [4].
These manuals have served as fundamental reference material for trip generation rates for all kinds of land uses and facilities used in transportation engineering and planning practice. The ITE manual also contains trip rates stated in terms of typical weekdays, Saturday, and Sunday. Trip generation rates are also given in terms of “trips per day.” For the purposes of estimating trip generation, an independent variable is defined as a physical, measurable, and predictable unit describing the study site or trip generator (e.g. GFA, employees, seats, dwelling units). The most commonly used parameters in the ITE database are gross floor area (GFA), gross leasable area (GLA), number of seats, number of employees, and dwelling units. [2]
Fig. 1. Example of ITE trip generation rates and equation [2]
There are two methods for estimating trip generation rates. The first is weighted average and the second is a regression analysis derived linear equation. In general, the trip generation rate derived from the weighted average is simpler to use and easier to understand. However, the regression linear equation is more accurate in estimating the trip generation rate. The ITE has developed trip generation rates using simple regression models.
III.METHODOLOGY
A. Study Area and Site Selection
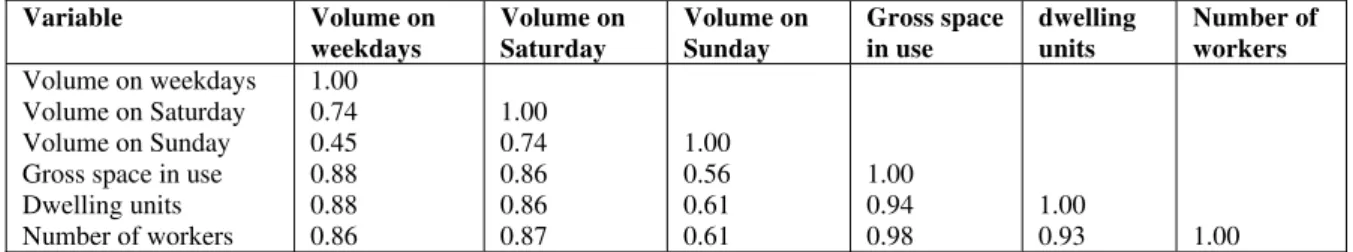
The sample size for trip generation studies need not be large. The minimum number of sites required for establishing and validating trip generation rates by the linear regression method is three. It is, however, preferable to have data on at least five sites [2]. Although the minimum number of sites required from ITE is not large, this research attempts to explore the factors affecting trip rates for condominium construction projects, so 30 sites located both in CBD and elsewhere were the sample size of this research. The characteristics of the samples are show in Table 1.
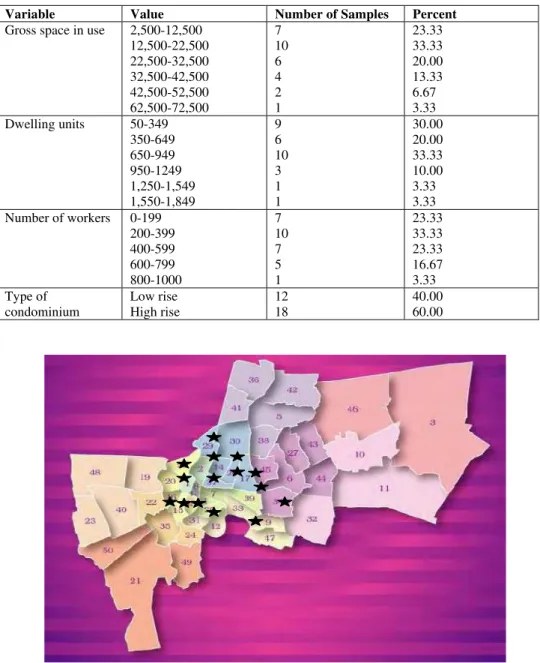
TABLE I Characteristics of Sample Size
Variable Value Number of Samples Percent Gross space in use 2,500-12,500
12,500-22,500 22,500-32,500 32,500-42,500 42,500-52,500 62,500-72,500
7 10 6 4 2 1
23.33 33.33 20.00 13.33 6.67 3.33 Dwelling units 50-349
350-649 650-949 950-1249 1,250-1,549 1,550-1,849
9 6 10 3 1 1
30.00 20.00 33.33 10.00 3.33 3.33 Number of workers 0-199
200-399 400-599 600-799 800-1000
7 10 7 5 1
23.33 33.33 23.33 16.67 3.33 Type of
condominium
Low rise High rise
12 18
40.00 60.00
Fig. 2. Locations of selected condominium construction sites
B. Data Collection
Since construction sites must have records of entering and exiting vehicles for security purposes, and the recorded data are appropriate for this research, these data were collected using the interview method. The interview survey gathered entry and exit information for one week, condominium types (high rise and low rise), number of workers, number of dwelling units, and gross space in use. The data was collected by four trained surveyors during May – July 2013.
C. Data Analysis
IV.RESULT D. Independent Variable Selection
ITE provided suggestions for independent variable selection which included: 1) logical relationship to site trip generation, 2) value measured directly for the survey site, 3) those used in similar trip generation land uses, and 4) confidence that the available site data were accurate. To identify logical relationships, a correlation coefficient was used.
The correlation coefficient is a measure of linear association between two variables. Values of the correlation coefficient are always between -1 and +1 [5]. A correlation coefficient of +1 means that the two variables are perfectly related in a positive linear sense, a correlation coefficient of -1 means that the two variables are perfectly related in a negative linear sense, and a correlation coefficient of 0 means that there is no linear relationship between the two variables.
The correlation between each of the independent variables with the dependent variable is shown in Table 2. A correlation matrix shows the correlation between each pair of variables. The diagonal of the matrix has values of 1 because a variable always has a perfect correlation with itself. The magnitude of the correlation coefficient determines the strength of the correlation. The guideline below helps to determine the type of correlation between the variables: 0 < |r| < 0.3 weak correlation, 0.3 < |r| < 0.7 moderate correlation, |r| > 0.7 strong correlation [6]
The results indicate that the variables gross space in use, dwelling units, and number of workers accord with volume on weekdays and volume on Saturday in a positive linear sense with strong correlation. Meanwhile, dwelling units and number of workers achieve stronger correlations with volume on Sunday than gross space in use. Although dwelling units and number of workers have the same performance, dwelling units accords with the suggestion of ITE that dwelling units are more accurate than number of workers and is used in similar trip generation land uses. Moreover, dwelling unit data is easier to collect than number of workers. For this reason, the number of dwelling units is also the independent variable for the analysis.
E. Descriptive Statistics
Average trip rates data was calculated as shown in Table 3. From the table the average trip rate for all vehicle types has been calculated as 7.061 veh./100 dwelling units/day for weekdays, 4.173 for Saturday, and 4.004 for Sunday.
TABLE II
Pearson Correlation Coefficient of Variables
Variable Volume on
weekdays Volume on Saturday Volume on Sunday Gross space in use dwelling units Number of workers Volume on weekdays
Volume on Saturday Volume on Sunday Gross space in use Dwelling units Number of workers
1.00 0.74 0.45 0.88 0.88 0.86 1.00 0.74 0.86 0.86 0.87 1.00 0.56 0.61 0.61 1.00 0.94 0.98 1.00
0.93 1.00
TABLE III
Descriptive Statistics of Trip Rates
Category Day Average rate Range of
Rates
Standard deviation All vehicle types
Six and ten-wheeled trucks
Four-wheeled trucks and Passenger cars
Low rise condominiums
High rise condominiums
F. Regression Model Development
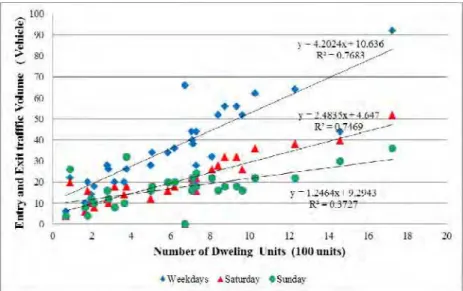
A regression model for all types of vehicle was developed as shown in Figures 3-7 and Table 4. Three types of model were developed: 1) model for all vehicles, 2) model for classified vehicles, and 3) model for all types of condominiums. These models were evaluated using R-squared, t-statistic, and F-statistic. The predictive equation from the regression model is
i
i
e
X
Y
=
β
0+
β
1+
where
Y = Trips produced by the condominium construction project (veh./day) β0 = Constant
β1 = Coefficient of Xi
Xi = Dwelling units (100 units)
ei = Random error
The R-squared of the regression is the fraction of the variation in the dependent variable that is accounted for (or predicted) by the independent variables. The coefficient of determination R-squared ranges in value from 0 to 1. A value of R-squared equal to 1 shows a perfect correlation in the sample — there is no difference between the estimated y value and the actual y value. At the other extreme, if the coefficient of determination is 0, the regression equation is not helpful in predicting a y value. The t values indicate that each slope coefficient is useful in estimating the dependent variable. The F statistic is used to determine whether the observed relationship between the dependent and independent variables occurs by chance.
The t values of most of the developed equations suggest that the coefficient is useful in estimating the trip rates for condominium construction projects. Except for the model of four-wheeled trucks and passenger cars and low rise condominiums for Saturday and Sunday, the coefficient is not significant.
Moreover, F statistics confirm the validity of the regression output. The model obtained very small significance for F. This means that there was only a very small chance that the regression output was merely a random occurrence. The F statistics confirms that the model is not valid for four-wheeled trucks and passenger cars for the Sunday model and low rise condominiums for the Saturday and Sunday models.
For the significant model, the R-squared of the model is more than 0.60 except for high rise condominiums on Sunday, for which it equals 0.54. The R-squared suggests that the model has a moderate level for prediction. However, for some models such as all vehicle types on weekdays, six-wheeled and ten-wheeled trucks on weekdays, and high rise condominiums, obtained high R-squared (more than 0.70). This means that 70% of the trips produced are influenced by dwelling units while 30% are explained by other factors.
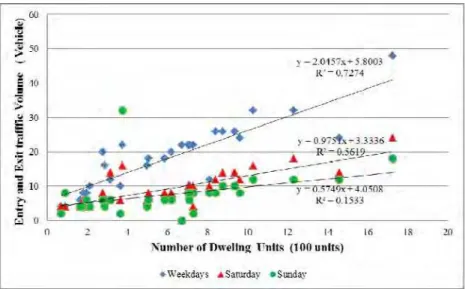
Fig. 4. Six-wheeled and ten-wheeled trucks; entry and exit volume versus dwelling units
Fig. 5. Four-wheeled trucks and passenger cars; entry and exit volume versus dwelling units
Fig.7. Entry and exit volume versus dwelling units of high rise condominium projects
TABLE IV
Regression Coefficient and Statistical Test
Category Day Variable Coefficient Std. Error t-Stat Sig. All vehicle types
Six and ten-wheeled trucks
Four-wheeled trucks and Passenger cars
Low rise condominiums
High rise condominiums
TABLE V
Statistics Test of Regression Model
Category Day R Square F-Stat Significance F
All vehicle types
Weekdays 0.77 92.847 0.000 Saturday 0.74 82.637 0.000 Sunday 0.37 16.634 0.000
Six and ten-wheeled trucks
Weekdays 0.73 74.720 0.000 Saturday 0.56 35.911 0.000 Sunday 0.15 5.068 0.032
Four-wheeled trucks and passenger cars
Weekdays 0.61 43.631 0.000 Saturday 0.69 63.928 0.000 Sunday 0.06 1.877 0.182*
Low rise condominiums
Weekdays 0.78 36.011 0.000 Saturday 0.32 4.760 0.054* Sunday 0.07 0.746* 0.408*
High rise condominiums
Weekdays 0.79 59.303 0.000 Saturday 0.93 213.817 0.000
Sunday 0.54 18.711 0.001
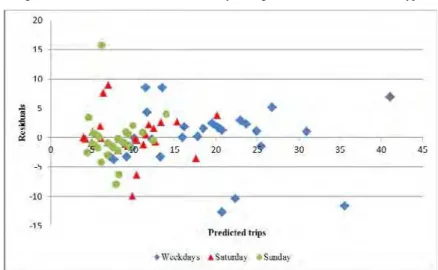
G. Examining regression model assumption
Linear regression analysis rests on basic assumptions about the population from which the data have been derived. The results of the analysis are only reliable when these assumptions are satisfied. These assumptions are:
• Independence – Errors in the conditional distributions are correlated. The explanatory variables are independent of each other, i.e., knowing the value of one or more of the independent variables does not tell us anything about the others. The Durbin-Watson statistics were used to verify independence.
• Normality – Errors are normally distributed with zero mean and a constant standard deviation. The individual data points of Y (the response variable) for each of the explanatory variables are normally distributed about the line of means (regression line). The Kolmogorov-Smirnov statistics were used to verify normality of error.
• Homoscedasticity – Errors in the conditional distributions should have constant variance. The variance of the data points about the line of means is the same for each explanatory variable.
Diagnostic procedures are intended to check how well the assumptions of linear regression are satisfied. The results of examining Independence and Normality are presented in Table 6. All models have Kolmogorov-Smirnov statistics according with significance at a 5% level and the Durbin-Watson statistics value is between 1.5 and 2.5. The results indicate that all developed models satisfy Independence and Normality assumptions.
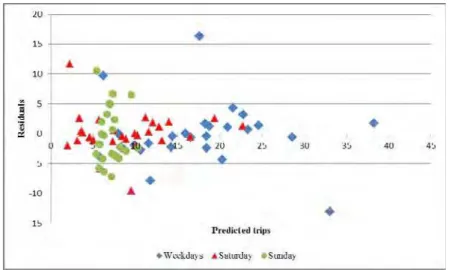
The examination of Homoscedasticity is presented in Figures 8-12. The results reveal that the residuals are more or less evenly spread out in a random manner along the horizontal line. Thus the assumption of homogeneous variance is also satisfied.
The above three assumptions of regression analysis are satisfied by the formulated regression model, which indicates the strong validity of the formulated regression model.
V.DISCUSSION
The linear regression models for trip rates were developed. The number of dwelling units is also the independent variable for the model. From the developed model, trip rates for condominium projects have been developed. The trip rates during condominium construction projects were presented in Table 7 and Table 8. Due to data robustness, models of four-wheeled trucks and passenger cars for Saturday and Sunday model and low rise condominiums were not developed. However, the other developed models have the ability to predict traffic rates.
TABLE VI
Statistics Parameters for Examining Regression Model Assumption
Category Day Durbin-Watson K-S
All vehicle types
Weekdays 2.410 0.135 Saturday 2.248 0.157
Sunday 1.841 0.144
Six and ten-wheeled trucks
Weekdays 1.687 0.146 Saturday 2.060 0.108
Sunday 1.266 0.199
Four-wheeled trucks and passenger cars
Weekdays 2.474 0.158 Saturday 1.688 0.193
Sunday 1.652 0.176
Low rise condominiums
Weekdays 1.388 0.162 Saturday 2.406 0.198
Sunday 2.088 0.145
High rise condominiums
Weekdays 1.288 0.170 Saturday 2.171 0.114
Sunday 1.304 0.169
Fig. 8. The examination of homoscedasticity for regression model of all vehicle types
Fig. 10. The examination of homoscedasticity for regression model of four-wheeled trucks and passenger cars
Fig. 11. The examination of homoscedasticity for regression model of low rise condominiums
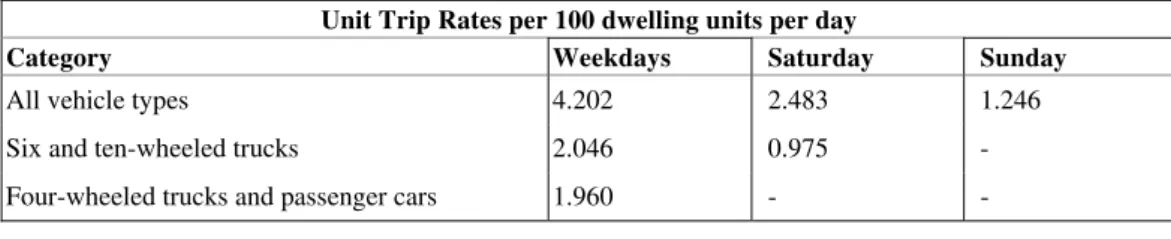
Table VII
Trip Rates for Condominium Construction Project Categorized by Vehicle Type
Unit Trip Rates per 100 dwelling units per day
Category Weekdays Saturday Sunday
All vehicle types 4.202 2.483 1.246
Six and ten-wheeled trucks 2.046 0.975 -
Four-wheeled trucks and passenger cars 1.960 - -
Table VIII
Trip Rates for Condominium Construction Project Categorized by Condominium Type
Unit Trip Rates per 100 dwelling units per day
Category Weekdays Saturday Sunday
Low rise 5.315 - -
High rise 3.965 2.667 1.261
VI.CONCLUSION
The number of large scale condominium construction projects has dramatically increased. Many projects have occurred in either densely populated areas or in central business districts, where traffic conditions are usually highly congested. To prevent traffic problems, a traffic impact study must be prepared and submitted for review by concerned public authorities. Unit trip generation rates are important data in traffic impact analysis. Without accurate unit trip generation rates, public agencies cannot obtain accurate information on the traffic that will be generated. This research attempts to determine a model that can effectively predict trip generation rates during condominium construction in Bangkok.
The 30 selected construction sites located both in CBD and other locations were the sample size of this research. Rates of entry and exit on the construction site for one week, condominium types (high rise and low rise), number of dwelling units, and gross space in use were collected by trained surveyors. Linear regression models involving one dependent variable and one independent variable were used for analysis. An independent variable which has a logical relation to trip characteristics was selected using the correlation coefficient and other factors. The number of dwelling units was chosen as the independent variable for the analysis.
Diagnostic procedures were used to check how well the assumptions of linear regression were satisfied, including independence, normality and homoscedasticity. The diagnostic results indicate that regression analysis is satisfied by the formulated regression model. This indicates the strong validity of the formulated regression model.
From the developed model, the trip rate for condominium projects has been developed. The trip rates of condominium construction projects for all vehicle types on weekdays, Saturday, and Sunday were 4.202, 2.483, and 1.246 vehicles per 100 dwelling units per day respectively. Trip rates for six-wheeled and ten-wheeled trucks on weekdays and Saturday were 2.046 and 0.975 vehicles per 100 dwelling units per day respectively. The trip rate for four-wheeled trucks and passenger cars on weekdays was 1.906. Low rise condominiums provided trip rates for all vehicle types on weekdays equal to 5.315, while trip rates for high rise condominiums on weekdays, Saturday and Sunday were 3.965, 2.667, and 1.261 respectively.
REFERENCES
[1] Jose Regin F. Regidor and Rene Val R. Teodoro, “Traffic Impact Assessment for Sustainable Traffic Management and Transportation Planning in Urban Areas,” presented at the Eastern Asia Society for Transportation Studies conferences, Bangkok, Thailand, September 21-24, 2005
[2] G. W. Juette and L. E. Zeffanella, “Development of Philippine Trip Generation Rates,” presented at the Eastern Asia Society for Transportation Studies conferences, Dalian, China, September 24-27, 2007.
[3] Mousavi, A., Bunker, J.M., & Lee, B. Trip generation in Australia: Practical issues. Road and Transport Research: a journal of Australian and New Zealand research and practice, 21(4), 2012, pp. 24-37.
[4] Abdelgader Elshabani and Darius Kanga. (October 2013). How to Successfully Institutionalize Traffic Impact Studies: The Dubai Experience. IEEE Trans. Plasma Sci. [Online]. 21(3). pp. 876-880. Available: http://www.ite.org/Membersonly/annualmeeting/2001/AB01H2301.pdf
[5] Gymmy Joseph Kattor, Abdul Malik K.V. and Pretina George. Analysis of Trip Attraction Characteristics of Commercial Land Use in Medium Sized Towns in Kerala. International Journal of Innovative Technology and Exploring Engineering (IJITEE). Volume 3, Issue 2, July 2013.pp. 61-67.
![Fig. 1. Example of ITE trip generation rates and equation [2]](https://thumb-eu.123doks.com/thumbv2/123dok_br/18179197.330893/2.892.188.705.349.784/fig-example-ite-trip-generation-rates-equation.webp)