OTÁVIO JOSÉ BERNARDES BRUSTOLINI
Differential Gene Expression (DGE) by RNA sequencing
analysis and development of software for integrating different
DGE methods
Tese apresentada à Universidade Federal de Viçosa, como parte das exigências do Programa de Pós-Graduação em Bioquímica Agrícola, para obtenção do título de Doctor Scientiae.
VIÇOSA
Fichi citilográfici prepiridi peli Biblioteci Centril di Universidide Federil de Viçosi - Câmpus Viçosi
T
Brustolini, Otávio José Bernardes, 1978-B912d
2014 analysis and development of software for integratingDifferential Gene Expression (DGE) by RNA sequencing different DGEmethods. / Otávio José Bernardes Brustolini. -Viçosa, MG, 2014.
viii, 74f. : il. ; 29 cm.
Orientador : Elizabeth Pacheco Batista Fontes. Tese (doutorado) - Universidade Federal de Viçosa. Referências bibliográficas: f.5.
1. Tomate - Doenças e pragas. 2. Begomovirus. 3. Mosca Branca. 4. Expressão gênica. 5. RNA-seq transcriptoma. I. Universidade Federal de Viçosa. Departamento de Bioquímica e Biologia Molecular. Programa de Pós-graduação em Bioquímica Agrícola. II. Título.
CDD 22. ed 572.8
OTÁVIO JOSÉ BERNARDES BRUSTOLINI
DIFFERENTIAL GENE EXPRESSION (DGE) BY RNA
SEQUENCING ANALYSIS AND DEVELOPMENT OF SOFTWARE
FOR INTEGRATING DIFFERENT DGE METHODS
Tese apresentada à Universidade Federal de Viçosa, como parte das exigências do Programa de Pós-Graduação em Bioquímica Agrícola, para obtenção do título de Doctor Scientiae.
APROVADA: 28 de fevereiro de 2014
________________________________ ____________________________ Fabyano Fonseca e Silva Benilton de Sa Carvalho
______________________________ ______________________
Humberto Josué de Oliveira Ramos Juliana Lopes Rangel Fietto
(Coorientador)
_________________________________
Elizabeth Pacheco Batista Fontes
Acknowledgments
Contents
RESUMO ... IV ABSTRACT ... VII
CHAPTER I ... 1
GLOBAL GENE EXPRESSION IN TOMATO PLANTS TOLERANT TO BEGOMOVIRUS INFECTION ... 1
ABSTRACT ... 1
1 - INTRODUCTION ... 3
2 – MATERIALS AND METHODS ... 7
2.1 - Tomato plant transformation ... 7
2.1 – RNA Sequencing ... 7
2.2 – Data sets ... 8
2.2 – Mapping the reads to a reference ... 9
2.3 – Normalization ... 11
2.4 – Deferential Expression Detection ... 13
2.4 – Downstream analysis ... 16
2.5 - In vivo labeling of leaf proteins... 17
2.6 - Polysome fractionation ... 18
2.7 - Infectivity assays... 18
2.8 - Quantitation of viral DNA in infected plants ... 19
3 – RESULTS ... 20
3.1 - Best statistical and computational program adjustments for the analysis of our RNA-seq data ... 20
3.2 - The virus infection is the trigger of the NIK-mediated antiviral signaling ... 24
3.3 - Ectopic expression of the gain-of-function T474D mutant causes a general down-regulation of translation-related genes ... 28
3.4 - Constitutive activation of NIK impairs translation and confers broad-spectrum tolerance against begomoviruses ... 41
4 – Discussion ... 49
5 – References ... 53
CHAPTER II ... 62
READS: A FRIENDLY RNA-SEQ PLATFORM TO PERFORM MULTIPLE COUNTING METHODS FOR DIFFERENTIAL GENE EXPRESSION (DGE) ... 62
ABSTRACT ... 62
1 - INTRODUCTION ... 64
2 - IMPLEMENTATION ... 66
3 - RESULTS ... 67
4 - CONCLUSION ... 69
Resumo
BRUSTOLINI, Otávio José Bernardes, D.Sc., Universidade Federal de Viçosa, fevereiro de 2014. Expressão Diferencial Gênica (EDG) por sequenciamento de RNA e o desenvolvimento de um sistema que integra esses métodos.Orientadora: Elizabeth Pacheco Batista Fontes.
Co-orientadores: Humberto Josué de Oliveira Ramos e Luciano Gomes Fietto.
Abstract
BRUSTOLINI, Otávio José Bernardes, D.Sc., Universidade Federal de Viçosa, February, 2014. Differential Gene Expression (DGE) by RNA sequencing analysis and development of software for integrating different DGE methods. Adviser: Elizabeth Pacheco Batista Fontes. Co-Advisers: Humberto
Josué de Oliveira Ramos and Luciano Gomes Fietto.
CHAPTER I
Global Gene Expression in Tomato Plants Tolerant to
Begomovirus Infection
Abstract
1 - Introduction
Tomato (Solanum lycopersicum) is one of the most consumed and cultivated crop worldwide. Among many threats to this culture, the begomoviruses represent a serious constraint to the tomato plantation. The begomoviruses are whitefly-transmitted single-stranded DNA viruses, which belong to the Geminiviridae family (Rojas et al., 2005). The Begomoviridae genus encompasses more than 200 species, which collectively cause severe diseases in major crops worldwide, inflicting significant economic losses in many dicotyledonous crops (Fauquet et al., 2008). Current climate changes are expected to alter more the whitefly distribution along the globe posing a major threat to agriculture worldwide. Despite unsuccessful attempts to develop plants resistant to begomovirus infections (Day et al., 1991; Hashmi et al., 2011; Lin et al., 2012), a variety of studies have succeeded in enhancing plant tolerance to begomovirus infection (Edelbaum et al., 2009; Santos et al., 2009; Vu et al, 2013). The ectopic expression of the host protein NSP-interacting kinase (NIK), which was identified as a virulence target of the begomovirus nuclear shuttle protein (NSP), has been employed as a molecular strategy to enhance tolerance to tomato-infecting begomoviruses (Fontes et al., 2004; Carvalho et al., 2008). The resulting tomato lines displayed delayed infection that nevertheless could not be controlled at later stages.
oligomerization of single-pass transmembrane receptor kinases has been proposed to be either induced or stabilized by ligands as the critical early event that triggers signaling and transduction from the receptor (Wang et al., 2005; Hubbard and Miller, 2007). As a single-pass transmembrane receptor kinase, NIK is expected to dimerize or multimerize in order to activate a defense response, although the molecular bases for the ligand are totally unknown. Probably, NIK interacts with itself and/or co-receptors to promote transphosphorylation and subsequent activation of the kinase (Santos et al., 2010). The three homologs of NIK in Arabidopsis thaliana (AtNIK1, AtNIK2, AtNIK3) have been found to interact with NSP through their kinase domain (Fontes et al., 2004). Thus, this interaction prevents the signal transduction that evokes the defense response cascade. It has also been shown that the NSP-NIK interaction is also conserved among begomovirus NSPs and NSP-NIK homologs from different hosts (Mariano et al., 2004). The tomato orthologs of NIK, SlNIKs, have also been shown to interact with the NSP of the tomato-infecting begomovirus ToYSV (Tomato yellow spot virus; Sakamoto et al., 2012). They have also found that SlNIK1 and SlNIK3 have analogous functions and structural conservation with those counterparts in Arabidopsis; same protein-protein interactions, similar expression profiles and predominate in tissues that support high efficiency of begomovirus infection.
kinase domain of NIK and prevents phosphorylation of Thr-474, leading to the suppression of the kinase activity and the establishment of an environment that is more favorable to begomovirus infection. Consistent with this mechanism, overexpression of Arabidopsis (At) NIK1 in begomovirus-infected tobacco leaves titrates the virally produced NSP inhibitor and overcomes NSP-mediated inhibition (Carvalho et al., 2008). Similarly, the overexpression of AtNIK1 in tomato plants attenuates begomovirus infection. However, the effectiveness of the NIK-mediated signaling pathway against begomovirus infection is limited because the viral NSP functions as a NIK suppressor. Furthermore, activation of the antiviral pathway seems to be dependent on the onset of infection.
In order to enhance the effectiveness of the NIK-mediated defense pathway against virus infection, an AtNIK1 mutant was constructed in which the Thr-474 residue was replaced with a phosphomimic aspartate residue, leading to the hyperactivation of the kinase activity. The resulting mutant receptor, designated as T474D, displayed a 1.5-fold increase in substrate phosphorylation activity and an enhanced capacity to relocate rpL10 to the nucleus (Santos et al., 2009). The NSPs from the Arabidopsis-infecting begomovirus CaLCuV (Cabbage leaf curly virus) was shown to bind stably to the kinase domain of NIK (Fontes et al., 2004). Replacing T474 with aspartate does not prevent NSP binding to NIK but decreases the NSP-mediated inactivation of the kinase activity. These in vitro results suggest that the hyperactive NIK T474D mutant may be a more effective target for engineering resistance against begomovirus.
To understand the molecular nature of the defense response triggered by NIK1 in tomato plants, we have designed an experiment with tomato plants expressing the gain-of-function receptor T474D. To examine whether the virus infection alone triggered NIK-mediated defense signaling, the transgenic lines T474D-6 and NIK1-4, the latter of which overexpresses wild-type AtNIK1, were challenged with the begomovirus ToYSV. A global comparison of the expressed sequences among the mock-treated and infected wild-type (WT), NIK and T474D lines was performed using the high-throughput RNA sequencing (RNA-seq) Illumina protocol.
expression and the exploration of non-model-organism transcriptomes (Anders et al., 2013). Recent studies have also reported that RNA-seq has become more accurate over a larger dynamic range of gene expression technics including microarrays (Trapnell et al., 2013; Marioni et al., 2008; Fu et al., 2009). The RNA-seq differential analysis methods focus on tackling one of two major challenges. The first one consists on accurately deriving gene and isoform expression values from raw sequencing reads, which requires statistical computations at isoform-level resolution. The second one is accounting for variability in measurements across biological replicates of an experiment (Trapnell et al., 2013). The most used strategy is to count the number of reads that fall into annotated genes and perform statistical analysis on the table of counts to discover quantitative changes in expression levels between experimental groups (Anders et al., 2013).
2 – Materials and Methods
2.1 - Tomato plant transformation
The clone pK7F-NIK1T474D has been previously described (Santos et al., 2009). It harbors a GFP gene fused in-frame after the last codon of the respective mutant cDNA under the control of the CaMV 35S promoter. In the mutant cDNA T474D, the threonine residue at position 474 within the activation loop of NIK1 was mutated to an aspartate residue. Leaf discs from in vitro-grown tomato plants (Solanum lycopersicum, cultivar Moneymaker) were transformed with pK7F-NIK1T474D via Agrobacterium-mediated plant transformation (strain LBA4404). The transformed shoots were selected on MS medium supplemented with 6-benzylaminopurine (500 mg.L-1), cefotaxime (300 mg.L-1), and kanamycin sulfate (50 mg.L-1). The regenerated shoots were rooted, transferred into soil and grown under standardized greenhouse conditions to generate seeds. The transgenic lines were confirmed using PCR. The analysis of transgene expression was performed by RT-PCR and real-time RT-PCR using transgene-specific primers, and actin was used as an endogenous control to normalize all values. The transgenic line 35S:NIK1-4 (NIK1-OX), which overexpresses the NIK1 receptor, has been previously described (Carvalho et al., 2008).
2.1 – RNA Sequencing
10 days post-inoculation, total RNA from systemically infected leaves, as diagnosed by PCR, and mock-inoculated leaves from wild-type, 35S::NIK1-4 and 35S::T474D lines was isolated using TRIzol (Invitrogen). For the RNA sequencing experiments, we used two biological replicates of a pool of 10 plants at 10 days after inoculation when we detected high levels of viral DNA in systemic leaves but symptoms were not visible as yet.
Total RNA from wild-type mock-inoculated and ToYSV-infected plants, 35S::NIK1-4 (NIK1-OX) mock-inoculated and infected plants and 35S::T474D (T474D) mock-inoculated and infected-plants was isolated using TRIzol (Invitrogen).
The RNA sequencing was obtained using single end approach by Illumina Genome Analyzer IIx in the Fasteris facilities. The GEX-NIaIII protocol was used with the following quality filter parameters: maximum of 1 base below a quality of 5 in the first 30 bases, a minimum average quality of 10, no “N” calls allowed and not more than 35 identical bases (low information reads). The data were stored in a comma-separated values (csv) spreadsheet file.
2.2 – Data sets
Table1. Sequence depth of the libraries and treatments
Treatments Library Total Reads
Mock WT GHY.1 1 304 801
GHY.2 9 153 036
Infected WT GHY.3 834 934
GHY.4 776 138
Mock NIK1-OX GHY.5 4 187 108
GHY.6 3 065 855
Infected NIK1-OX GHY.7 4 192 870 GHY.8 4 306 404
Mock T474D GHY.9 4 367 471
GHY.10 2 935 660
Infected T474D GHY.11 4 507 533 GHY.12 3 483 973
The annotation files were obtained at the Phytozome database web site (http://www.phytozome.net) provided by the International Tomato Annotation Group (ITAG) at the release 2.3 (Tomato Genome Consortium 2012). One cDNA file in FASTA format containing 34727 sequences, and one genome file in FASTA format with the 12 chromosomes sequences and 1 mitochondria DNA sequence were the annotation source.
2.2 – Mapping the reads to a reference
two main categories, 'seed methods' and 'Burrows-Wheeler transform methods' (Garber et al., 2011a). Seed methods, such as mapping and assembly with quality MAQ (Ruan, and Durbin, 2008) and Stampy programs (Lunter and Goodson, 2011), find matches for short subsequences, termed 'seeds', assuming that at least one seed in a read will perfectly match the reference. Each seed is used to narrow candidate regions in which more sensitive methods (such as Smith-Walterman algorithmic) can be applied to extend seeds to full alignments. In contrast, the second approach includes Burrows-Wheeler (BWA) and Bowtie alignments (Langmead et al., 2009), which compact the reference into a data structure that is very efficient when searching for perfect matches. If allowing mismatches, the performance of Burrows-Wheeler methods decreases exponentially with the number of mismatches as they iteratively perform perfect searches (Garber et al., 2011b). Another type of aligners is considered the spliced events. Those algorithmics predict exons and junctions and attempt to recognize the splicing events involving new exons. Reads can be aligned to the entire genome, including intron-spanning reads that require large gaps for proper placement. Several methods exist, collectively referred to as 'spliced aligners', which fall into two main categories: 'exon first' and 'seed and extend'. Exon-first methods such as MapSplice (Wang et al., 2010), SpliceMap (Au et al., 2010) and TopHat (Trapnell et a;., 2009) use a two-step process. First, they map reads continuously to the genome using the unspliced read aligners. Second, unmapped reads are split into shorter segments and aligned independently. The genomic regions surrounding the mapped read segments are searched for possible spliced connections. Exon-first aligners are very efficient because only a small portion of the reads requires an intensive computation. Alternatively, seed-extend methods, such as 'genomic
junction algorithms are always optimized to one specific group of organism, such as mammalian; thus, the bias of this detection could strain the downstream analysis and the biological interpretation. In addition, the small length of the reads probably would increase the false positive of the mapped reads.
Therefore, to understand how the mapping algorithms influence our analysis, we have applied three 'unspliced aligners': Bowtie (Burrows-Wheeler transform), Stampy and MAQ (seed method), and two 'spliced aligners' Tophat (exon first) and PALMapper (seed-extend). We also compared those results with the classic Smith-Walterman (SW) algorithmic (implemented in this work) direct to the ITAG 2.3 cDNA data set.
2.3 – Normalization
The term normalization has been widely used in many biology fields as synonym of any data corrections or transformation. Although in many earlier statistical reports, it has been directly related to a data transformation or correction in order to fit a normal distribution, or even a more sophisticated adjustment in which the data are brought to a symmetrical distribution (Dutka and Hanson, 1989; Grigelionis, 1990), this term remains in the gene expression literature as a method of correction regardless of the data dispersion. Therefore, normalization has been reported as an important step in gene expression quantification, and an understanding how these methods work could provide meaningful biological insights (Dillies et al., 2012).
fragments mapped across samples (Marioni et al., 2008; Mortazavi et al., 2008). Therefore,, these sources of variability differ both in the type of bias adjustment and in the statistical strategy that must be adopted for normalization (Kadota et al., 2012). However, as data accumulate, there is still no clear indication of how the choice of normalization method impacts the downstream analysis (Dillies et al., 2012). In addition, although effective and relevant methods have been derived and implemented to normalize RNA-seq data, they are not always properly used in practice. A small number of publications have compared normalization methods (Bullard et al., 2010), providing useful yet preliminary results that must be confirmed with additional data to yield clear and robust guidelines to the community (Dillies et al., 2012). Comparisons among the available normalization methods for gene expression analysis have either made use of simulation studies or real calibration data (Shedden et al., 2005; McCall and Irizarry, 2008; Qin et al., 2006; Jeanmougin et al., 2010). These studies rely on both the qualitative characteristics of normalized data and the impact of the normalization method on the results from a differential expression (DE) analysis. In addition, there are few investigations about the impact of the normalization method on the false-positive rate and on the detection power of DE analysis (Kadota et al., 2012).
Additional effects on differential expression analysis have also been reported, such as GC-content and gene length (Risso et al., 2011). Although the GC-content and gene length of each gene do not change from sample to sample, so they can be expected to have little effect on differential expression analyses, precedents in the literature have demonstrated that sample-specific effects for GC-content can still be detected (Risso et al., 2011; Hansen et al., 2012). Unlike the GC content, there is no strong evidence that gene length could have any effect on differential expression analysis, although a minor influence of gene length has been detected by Hansen et al., (2012).
Total Count (TC), Upper Quartile (UQ) (Bullard et al., 2010), Relative log Expression (RLE) (Anders and Huber, 2010) and Trimmed Mean of M values (TMM) (Robinson and Oshlack, 2010), and the last one was the normalization method implemented direct in DESeq package. The GC-content and gene length correction factors were performed by the Bioconductor package EDASeq (Risso et al., 2011). This package mainly focuses on biases related to GC-content and the existence of strong sample-specific GC-GC-content effects on RNA-Seq read counts, which could substantially bias differential expression analysis. These methods are compared to state-of-the-art normalization procedures in terms of bias and mean squared error for expression fold-change estimation and in terms of type I error and p-value distributions for tests of differential expression.
2.4 – Deferential Expression Detection
distributional law between replicate RNA samples. This implies that the read counts follow a negative binomial probability law.
sequencing process is low compared to microarray hybridization (Marioni et al., 2008), measurements can vary substantially because of differences in library construction protocols and most importantly because of intrinsic variability in biological samples (Levin et al., 2010). As with any biological measurement, biological replicates provide the only measurement of intrinsic, nontechnical transcript expression variability and, thus, are critical for differential expression analysis (Garber et al., 2011b).
In order to deal with this intrinsic variability on RNA-seq experiments, one of the most important issues among DE analysis is the distribution by which the counts mapping to a gene are fitting. As the non-negative integers follow a discrete distribution, in the methods, explicitly developed for differential expression analysis of this type of count data, the Poisson distribution and the negative binomial (NB) distribution are the two most commonly used models (Marioni et al., 2008; Robinson and Oshlack, 2010; Anders and Huber, 2010). Other distribution, such as the beta-binomial (Hardcastle and Kelly, 2010), has also been proposed. The Poisson distribution has the advantage of simplicity and has only one parameter, but it constrains the variance of the modelled variable to be equal to the mean. The negative binomial distribution has two parameters, encoding the mean ( ) and the dispersion (φ), and hence allows
2.4 – Downstream analysis
Ashburner et al., 2000) and KEGG (Kanehisa, 2013) information.
The entire annotation data set from ITAG/Phytozome (http://www.phytozome.net) was stored in the relational database PostgreSQL 9.3 (http://www.postgresql.org). The scripts operations in the database using the SQL (Structured Query Language) facilitate the data mining and the structural organization of the retrieved information. Yet, a deeper understanding of the biological meaning of the gene expression data requires a more powerful approach (Subramanian et al., 2005; Horan et al., 2008; Cumbie et al., 2011). The Gene Set Enrichment Analysis (GSEA) has become the most widely used annotation technique since the emerging of the microarray technology (Jansen and Gerstein, 2000; Subramanian et al., 2005). GSEA has also been applied for RNA-seq annotation analysis similarly as for microarray. The basic goal of GSEA is the detection of biological processes in gene sets instead of focused on identifying individual genes. GSEA features a number of advantages as compared with single-gene methods. First, it eases the interpretation of a large-scale experiment by identifying pathways and processes. Rather than focus on high scoring genes, which can be poorly annotated and may not be reproducible, the efforts can focus on gene sets, which tend to be more reproducible and more interpretable. Second, when the members of a gene set exhibit strong cross-correlation, GSEA can boost the signal-to-noise ratio and make it possible to detect modest changes in individual genes. Third, the leading-edge analysis can help define gene subsets to elucidate the biological phenomenon implied by the results (Subramanian et al., 2005). To detect gene set enrichment from our RNA-seq tomato infection DE data, we used the GSEA method provided by the R/Bioconductor GSEABase package based on the Gene Ontology (GO) database (Ashburner et al., 2000). In order to increase the pattern detection among the enrichment genes, we applied the cumulative hypergeometric function using KEGG groups (Kanehisa, 2013).
2.5 - In vivo labeling of leaf proteins
temperature. To quantitate incorporation of [35S]methionine into protein, aliquots of protein extracts were placed in 10% (w/v) TCA and incubated on ice for 30 min. The samples were filtered onto glass microfiber filters and the filters were washed three times with 5 ml of cold 5% (w/v) TCA and two times with 5 ml of 95% ethanol. After drying, the filters were counted with a scintillation counter.
2.6 - Polysome fractionation
Polysomes were fractionated over sucrose gradients. Briefly, 500 mg of 15-day-old tomato seedlings were ground in liquid nitrogen and 1 mL of extraction buffer (0.2 M Tris-HCl, pH 8.0, 50 mM KCl, 25 mM MgCl2, 1% Triton X-100, 400 units/mL of RNasin and 50 mg/mL of cycloheximide). After centrifuging for 10 min, the supernatant was loaded onto a 10-mL 15% to 50% sucrose gradient and spun in a Beckman SW41Ti rotor at 135,000 g for 3.5 h. Fractions were collected manually from the bottom, and total RNA was extracted with phenol/chloroform/isoamyl alcohol, precipitated with isopropanol, and treated with DNase I. The specific transcripts were amplified using semiquantitative RT-PCR. For cDNAs from the T474D line, the RT-PCR involved 25 cycles for rbcS, actin and the resistance-like gene targets, and each cycle comprised 95 °C for 30 s, 60 °C for 30 s and 72 °C for 1 min. The same conditions were used for the amplification of control genes from cDNAs from the type line. Amplification of the resistance-like cDNA fragments from wild-type samples was performed with 45 cycles and an annealing temperature of 52°C.
2.7 - Infectivity assays
and wild-type lines were infected at the six-leaf stage with either ToYSV-[MG-Bi2] or ToSRV by biolistic delivery using tandemly repeated viral DNA-A and DNA-B and a microprojectile bombardment model PDS-1000/He accelerator (BIORAD) at 900 psi. In each experiment, 20 plants of each line were inoculated with 2 g of tandemly repeated DNA-A plus DNA-B per plant and grown in a greenhouse under natural conditions of light, 70% relative humidity and approximately equal day and night lengths. Total nucleic acid was extracted from the systemically infected leaves (young leaves), and viral DNA was detected by PCR using DNA-A and DNA-B begomovirus-specific primers (PBL1v 2040, GCCTCTGCAGCARTGRTCKATCTTCATACA, and PCRC1,
CTAGCTGCAGCATATTTACRARWATGCCA, or PAL1v1978,
GCATCTGCAGGCCCACATYGTCTTYCCNGT, and PAR1c496,
AATACTGCAGGGCTTYCTRTACATRGG) at 10 days post-infection.
2.8 - Quantitation of viral DNA in infected plants
Viral DNA accumulation was measured by quantitative PCR (qPCR). The reactions were prepared in a final volume of 10 µl using the Fast SYBR Green Master Mix (Applied Biosystems) according to the manufacturer’s instructions and analyzed on a 7500 Real Time PCR System (Applied Biosystems). Virus-specific primers were designed using Primer Express 3.0 (Applied Biosystems) and tested by conventional PCR using plasmids containing the complete DNA-A of each virus (106 copies per reaction). The following primer sequences were
used: ToSRVFwd, CACGTGCCCACATCGTCTT, and ToSRVRev,
GGCCGGAACGACCTATTA-3’, or ToYSVFwd,
CCACGATTTTAAAGCTGCATTCT, and ToYSVRev,
CAATCCTGGTGAGGGAGTCAGT. For viral DNA quantitation, standard curves were prepared using serial dilutions of these clones (100 to 106 copies of viral
genome per reaction). Standard curves were obtained by regression analysis of the Ct values of each of the three replicates of a given dilution in relation to the log of the amount of DNA in each dilution. For the absolute quantitation of the number of viral DNA molecules in the different treatments, 100 ng of total DNA from the infected plants was used in the qPCR reactions containing virus-specific primers. Each sample was analysed in triplicate from at least two
3 – Results
3.1 - Best statistical and computational program adjustments for the analysis of our RNA-seq data
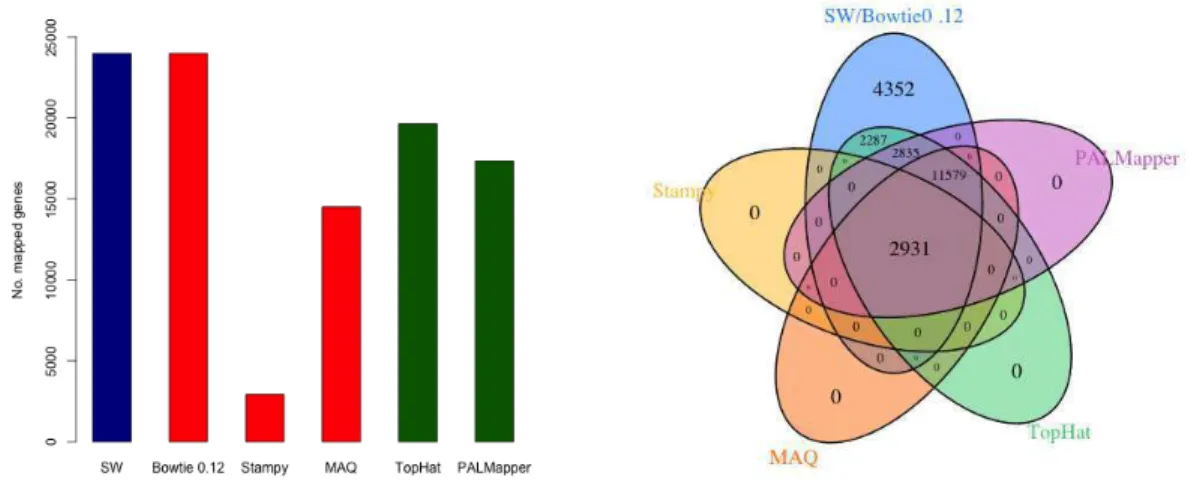
The preprocessed reads were mapped to the tomato plant genome and transcriptome (ITAG 2.3) files and no differences were observed between the mapped reads from the genome and the transcriptome. Thus, we chose the transcript file as our main reference. The Figure 1 shows the quantity of the reads mapped according to the aligners software. The SW algorithm and Bowtie detected the same amount of mapped reads (Figure 1A) and the outcome from the others aligners programs were exactly the subsets of the Bowtie/SW (Figure 1B). Therefore, we used the result provided by the Bowtie for our analysis, as. the SW/Bowtie had a better performance on our mapping analysis.
Figure 1: Number of mapped reads from genes. (A) Number of mapped genes by software: Red is 'unspliced aligners' and green is 'spliced aligners'. (B) Venn diagram showing the numbers of mapped gene detected by the aligners.
overall data distribution had any modification. Only the scale has varied. The effects of the five normalization factors seem to have little influence on the data dispersion, but as shown in Figure 2, when the differential gene expression (DGE) was calculated, the amount of up and down-regulated genes showed a great variability among the conditions and normalization factors.
Figure 2: Number of differential expressed reads (A) and mapped genes with EDASeq corrections (B) by pairwise conditions. Each line represents a normalization method separated by up and down regulated.
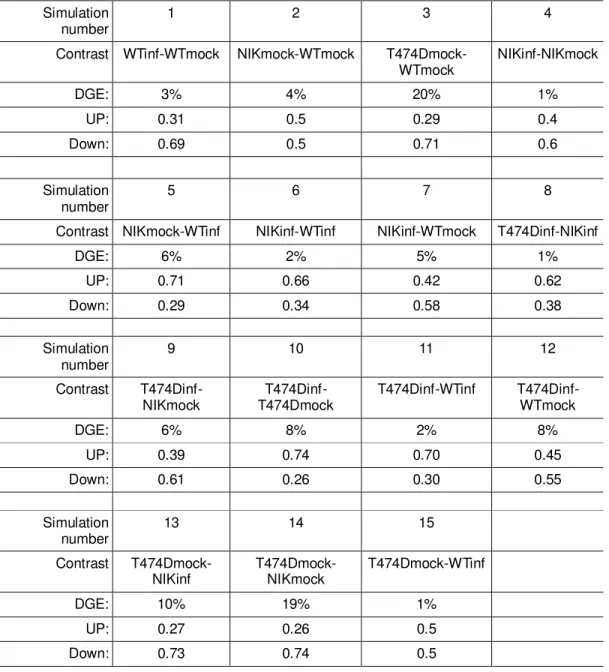
Table 2. Proportions of up/down-regulated DE genes found by TC normalization
Simulation
number 1 2 3 4
Contrast WTinf-WTmock NIKmock-WTmock
T474Dmock-WTmock NIKinf-NIKmock
DGE: 3% 4% 20% 1%
UP: 0.31 0.5 0.29 0.4
Down: 0.69 0.5 0.71 0.6
Simulation number
5 6 7 8
Contrast NIKmock-WTinf NIKinf-WTinf NIKinf-WTmock T474Dinf-NIKinf
DGE: 6% 2% 5% 1%
UP: 0.71 0.66 0.42 0.62
Down: 0.29 0.34 0.58 0.38
Simulation number
9 10 11 12
Contrast
T474Dinf-NIKmock T474Dmock T474Dinf- T474Dinf-WTinf T474Dinf-WTmock
DGE: 6% 8% 2% 8%
UP: 0.39 0.74 0.70 0.45
Down: 0.61 0.26 0.30 0.55
Simulation number
13 14 15
Contrast
T474Dmock-NIKinf T474Dmock-NIKmock T474Dmock-WTinf
DGE: 10% 19% 1%
UP: 0.27 0.26 0.5
Figure 3. RNA-seq simulations performed by TCC package between the uncorrected and corrected data set by EDASeq (CG content and gene length). (A) DE genes proportions of TC normalization data sets. (B) number of DE genes without EDA (C) EDASeq corrected data sets (C) comparing the normalizations factors.
3.2 - The virus infection is the trigger of the NIK-mediated antiviral signaling
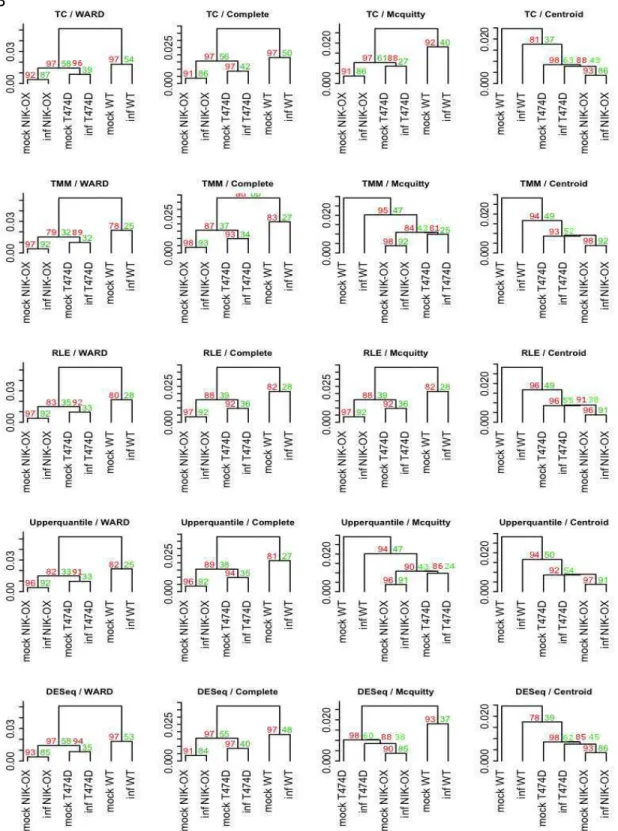
(Hartigan 1975). All of these methods are implemented in the R package pvclust (Shimodaira 2002).
Figure 4: Clustering comparison between normalization factors and the agglomerative clustering methods. (A) The raw data without any previews correction before the normalization. (B) The raw data trimmed off the DE genes of mock T474D – mock WT. The red numbers means unbiased p-value (au) and green ones bootstrap probability.
The similarity between the mock T474D and infected WT genes profiles suggested that the T474D NIK-mediated and the infection response can share a similar portrait. In addition, it seems that a sustained NIK-mediated response led to a “priming” state that further enhanced the response to begomovirus infection in T474D- and NIK-overexpressing leaves; the virus-induced transcriptomes of these samples cluster together and differ from the T474D mock-inoculated transcriptome (Figure 4A). Furthermore, the elimination of the mock T474D DE genes from the raw of all treatments further indicates that the expression profile induced by the T474D mutant mimics greatly the response to the viral infection, as the mock- and infected-induced transcriptomes from each genotype clustered together with high significance (Figure 4B). Taken together, these results suggest that the gain-of-function mutant T474D can sustain an activated NIK-mediated antiviral response in the absence of the virus and that virus infection is the trigger of the NIK-mediated signalling pathway.
3.3 - Ectopic expression of the gain-of-function T474D mutant causes a general down-regulation of translation-related genes
Figure 5:
Biological Coefficients variations (BCV) dispersion against log2-CPM (count per milion) of RNA-seq tomato samples.
variation of the experiment, by using thee edgeR package. . This BCV is not considered atypical for technical replicates in observational studies (Oberg et al., 2012). The edgeR package also allows us to estimate the BCV per gene using the tagwise method (Robinson et al., 2010). The Figure 5 shows the estimated BCV for each gene as the black dots and the red line, as the overall BCV. This analysis also demonstrates that there is a group of genes responsible for a great variation among the entire experiment.
Figure 6: Comparisons among DE methods based on negative binomial distribution.
The differential gene expression (DGE) methods have been performed using pairwise design and edgeR, DESeq and baySeq. First, we have compared the numbers of accepted up and down-regulated genes using false discover rate (FDR) adjusted p-value of 0.05 (Figure 6). The difference among all the methods does not seem to follow a pattern. However, the data have shown a similar variation in some contrasts and methods. One strong trend is the massive down-regulation presented in the contrasts T474D_mock-WT_mock and T474D_mock-NIK_mock detected by edgeR TC normalization and by baySeq. Despite the DGE methods, which are based on the same distribution (negative binomial), large numerical variations in up and down-regulation of DE genes were observed. This unpredicted variation could be due to differences in the estimative of model parameters and initial assumption among the methods used .
0 1000 2000 3000 4000 5000 6000 7000
Figure 7: Each DGE data can be visualized as ‘MA’ plots (M = log ratio versus A = abundance) in which each dot represents a gene. This plot shows RNA-seq gene expression for WT infected versus WT mock, NIK over-expressed mock versus WT mock and T474D mock versus WT mock. Red dots represent the DE genes accepted as statistically significant.
have analyzed the following contrasts: infected WT – mock WT, mock NIK-OX – mock WT and mock T474D – mock WT. The MA plots show the genes dispersion. The DE genes are in red (Figure 7). The edgeR/TMM and edgeR/TC plots were similar in the overall data dispersion between infected WT – mock WT and mock T474D – mock WT, mainly in the down-regulation region. Although the DGE detection was numerically dissimilar (Figure 6), the similarity in the DGE profile of the infected WT – mock WT and mock T474D – mock WT MA plots reinforces that some infection response mechanisms linked to the down-regulated genes were already active in mock T474D plants.
The huge difference observed among the DGE methods made difficult to choose a unique normalization and DGE method for further analysis of the data, which would ensure that all real biological effects were uncovered. Thereby, it was reasonable to assume that the application of all gene expression methods would be the right choice to perform the further downstream analysis.
The DE genes from all normalizations and DEG analysis were stored using SQL tables at the PostgreSQL relational database (http://bioinfo-1.bioagro.ufv.br/fonteslab/tomatodb), which listed the corresponding log2(Fold
Change), uncorrected p-value and p-value corrected by FDR (q-value) for all DE genes.
With the data from DE genes, there would be necessary to merge them with the annotations provided by the ITAG/Phytozome. Using the same SQL table structure presented at PostgreSQL relational database, the DE genes were easily merged with the gene annotations by the in house SQL scripts developed for this study (Supplementary information). In order to have a better understand of the biological phenomena, we performed a gene enrichment analysis using the GSEA methods based on biological process from the GO data. The same contrasts, infected WT – mock WT, mock NIK-OX – mock WT and mock T474D – mock WT, presented in DGE analysis were used here. A great number of enriched categories were found using p-value cutoff < 0.05 (Table S1, http://bioinfo-1.bioagro.ufv.br/fonteslab/tomatodb) . Because of the poor annotation of the tomato genome regarding some GO categories, we have decided to change the p-value cutoff to <0.01 and only accepted the GO categories, which had been labeled by at least four DGE methods or normalization factors (Figure 8, Table 1).
categories in the enrichment analysis, which led to the recognition of some statistically significant groups in spite of their very low number of genes. In fact, we have observed that some accepted GO categories had few significative genes (p-value < 0.01, Table 1). Thus, we did not consider those groups with less than 3 genes.
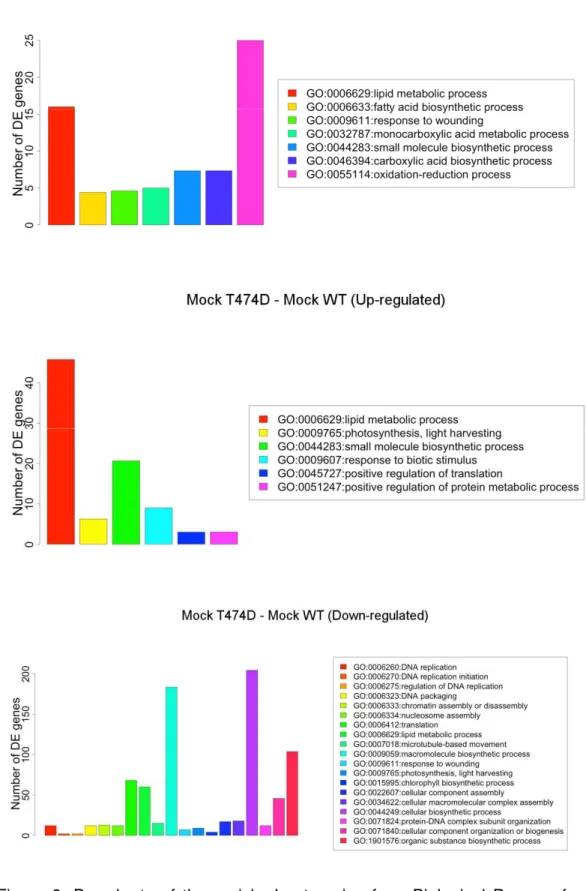
According to these criterion, the contrast mock NIK-OX – mock WT had a few GO enriched categories, one category for the up-regulated (GO:0046148: pigment biosynthetic process) and three for the down-regulated DE genes (GO:0009611: response to wounding, GO:0043648: dicarboxylic acid metabolic process and GO:0044262: cellular carbohydrate metabolic process). The enriched categories for the contrasts infected WT – mock WT and T474D mock – WT mock are shown in Figure 8.
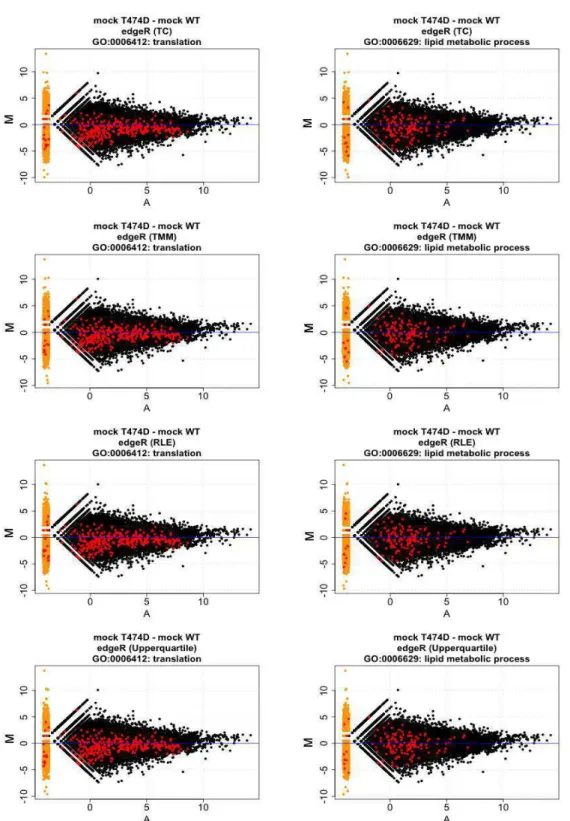
The contrast mock T474D – mock WT down-regulated genes shows the highest number of enriched GO categories. The most significative p-value for one enriched category among all the analyzed contrasts was the GO:0006412 (translation) with the average p-value 4.69e-07. To determine whether a down-regulation of the translation machinery-related genes would be a direct result of the T474D expression, we plotted all the annotated genes attributed by the GO:0006412 (translation) in a smear-plot as the red dots (Fig. 9A). In the T474D mock-WT mock, the translation-related genes (red dots) tended to be down-regulated, because they were clearly concentrated at the bottom of the graphic. In contrast, this trend was not shared by the down-regulated GO:0006629: lipid metabolic process enriched category in the mock T474D – mock WT constrast which displayed a high dispersion without any tendency for up- and down-regulated profile (Figure 9B). These results indicate that merging of DGE data may have underestimated the number of translation-related genes in the T474Dmock-WTmock.
Table 3: Enriched Biological process categories from GO database using GSEA method
Infected WT – mock WT (UP-regulated)
Enriched Categories
DGE methods: nunber of genes / number of genes in
the GO group (p-value) AN
GO:0006073: cellular glucan
metabolic process edgeR/RLE: 4/93 (0.007615) edgeR/upper: 4/93 (0.008759) baySeq: 7/93 (0.006532) 5 GO:0009765:
photosynthesis, light
harvesting edgeR/RLE: 3/33 (0.002581) edgeR/upper: 3/33 (0.002895) baySeq: 4/33 (0.007371) 3
GO:0030418: nicotianamine biosynthetic process
edgeR/TMM: 1/1 (0.006295) edgeR/TC: 1/1 (0.00526) edgeR/RLE: 1/1 (0.008365) edgeR/upper: 1/1 (0.00871) DESeq: 1/1 (0.001897)
1
Infected WT – mock WT (DOWN-regulated)
Enriched Categories
DGE methods: nunber of genes / number of genes in
the GO group (p-value) AN
GO:0006629: lipid metabolic process
edgeR/TMM: 19/592 (1.79e-05) edgeR/TC: 22/592 (0.0004238) edgeR/RLE: 16/592 (8.847e-05) edgeR/upper: 7/343 (0.009761)
16
GO:0006633: fatty acid biosynthetic process
edgeR/TMM: 5/69 (0.00087) edgeR/TC: 5/69 (0.006144) edgeR/RLE: 5/69 (0.0004101) edgeR/upper: 5/69
(0.0001461) DESeq: 2/69 (0.006187) 5
GO:0009611: response to wounding
edgeR/TMM: 5/22 (3.054e-06) edgeR/TC: 5/22 (2.732e-05) edgeR/RLE: 5/22 (1.351e-06) edgeR/upper: 5/22 (4.486e-07) DESeq: 3/22 (6.617e-06)
5
GO:0032787: monocarboxylic acid metabolic process
edgeR/TMM: 5/96 (0.003758) edgeR/RLE: 5/96 (0.001836) edgeR/upper: 5/96 (0.000681)
5
GO:0044283: small molecule biosynthetic
process edgeR/TMM: 8/217 (0.002388) edgeR/RLE: 7/217 (0.003716) edgeR/upper: 7/217 (0.001046) 7 GO:0046394: carboxylic
acid biosynthetic process edgeR/TMM: 8/189 (0.0009954) edgeR/RLE: 7/189 (0.001713) edgeR/upper: 7/189 (0.000462) 7 GO:0055114:
oxidation-reduction process
edgeR/TMM: 29/1645 (0.004426) edgeR/RLE: 25/1645
(0.00631) edgeR/upper: 21/1645 (0.006762) 25
Mock NIK-OX – mock WT (UP-regulated)
Enriched Categories
DGE methods: nunber of genes / number of genes in
the GO group (p-value) AN
GO:0046148: pigment
biosynthetic process edgeR/TMM: 3/28 (0.006671) edgeR/TC: 3/28 (0.004615) edgeR/RLE: 3/28 (0.0075) edgeR/upper: 3/28 (0.003001) 3
Mock NIK-OX – mock WT (DOWN-regulated)
Enriched Categories
DGE methods: nunber of genes / number of genes in
the GO group (p-value) AN
GO:0009611: response to wounding
edgeR/TMM: 3/22 (0.001621) edgeR/TC: 3/22 (0.003048) edgeR/RLE: 3/22 (0.001937) edgeR/upper: 3/22
(0.002832) 3
GO:0043648: dicarboxylic acid metabolic process
edgeR/TMM: 3/27 (0.002961) edgeR/TC: 3/27 (0.005512) edgeR/RLE: 3/27 (0.003528) edgeR/upper: 3/27
(0.005128) 3
GO:0044262: cellular carbohydrate metabolic
process edgeR/TMM: 7/214 (0.00841) edgeR/TC: 8/214 (0.00833) edgeR/upper: 8/214 (0.007165) 8
Mock T474D – mock WT (UP-regulated)
Enriched Categories
DGE methods: nunber of genes / number of genes in
GO:0006629: lipid metabolic process
edgeR/TMM: 47/592 (0.007967) edgeR/RLE: 46/592 (0.003633) edgeR/upper: 45/592 (0.007517) baySeq:
45/343 (5.446e-06) 46
GO:0009765: photosynthesis, light harvesting
edgeR/TMM: 6/33 (0.008713) edgeR/upper: 6/33 (0.006678) DESeq: 5/33 (0.005769) baySeq: 8/33 (0.001161)
7
GO:0009607: response to
biotic stimulus edgeR/TMM: 9/58 (0.009423) edgeR/upper: 8/58 (0.007652) baySeq: 10/58 (0.004553) 9 GO:0044283: small
molecule biosynthetic
process edgeR/TMM: 21/217 (0.009161) edgeR/RLE: 20/217 (0.008819) edgeR/upper: 21/217 (0.004946) 21 GO:0051247: positive
regulation of protein metabolic process
edgeR/TMM: 3/7 (0.00502) edgeR/RLE: 3/7 (0.004125)
edgeR/upper: 3/7 (0.004283) 3
Mock T474D – mock WT (DOWN-regulated)
Enriched Categories
DGE methods: nunber of genes / number of genes in
the GO group (p-value) AN
GO:0006260: DNA
replication edgeR/TMM: 12/87 (0.001556) edgeR/RLE: 12/87 (0.003899) edgeR/upper: 12/87 (0.00235) 12 GO:0006270: DNA
replication initiation edgeR/TMM: 2/2 (0.002646) edgeR/TC: 2/2 (0.007579) edgeR/RLE: 2/2 (0.003304) edgeR/upper: 2/2 (0.002919) 2 GO:0006275: regulation of
DNA replication
edgeR/TMM: 2/2 (0.002646) edgeR/TC: 2/2 (0.007579) edgeR/RLE: 2/2 (0.003304) edgeR/upper: 2/2 (0.002919) DESeq: 2/2 (0.00171)
2
GO:0006323: DNA
packaging edgeR/TMM: 12/77 (0.0005285) edgeR/RLE: 12/77 (0.001394) edgeR/upper: 12/77 (0.0008159) 12 GO:0006333: chromatin
assembly or disassembly
edgeR/TMM: 12/80 (0.0007529) edgeR/TC: 15/80 (0.003447) edgeR/RLE: 12/80 (0.001953) edgeR/upper:
12/80 (0.001154) 13
GO:0006334: nucleosome
assembly edgeR/TMM: 12/77 (0.0005285) edgeR/RLE: 12/77 (0.001394) edgeR/upper: 12/77 (0.0008159) 12
GO:0006412: translation
edgeR/TMM: 53/579 (2.923e-05) edgeR/TC: 110/579 (1.131e-15) edgeR/RLE: 67/579 (2.465e-08)
edgeR/upper: 59/579 (1.62e-06) DESeq: 51/579 (2.342e-07)
68
GO:0006629: lipid metabolic process
edgeR/TMM: 56/592 (6.552e-06) edgeR/TC: 82/592 (1.355e-05) edgeR/RLE: 61/592 (5.595e-06) edgeR/upper: 58/592 (6.822e-06) DESeq: 43/592 (0.0002239)
60
GO:0007018: microtubule-based movement
edgeR/TMM: 14/60 (1.519e-06) edgeR/TC: 19/60
(3.965e-07) edgeR/RLE: 16/60 (1.667e-07) edgeR/upper: 15/60 (4.582e-07) DESeq: 11/60 (2.969e-05)
15
GO:0009059:
macromolecule biosynthetic process
edgeR/TC: 250/2200 (1.178e-06) edgeR/RLE: 156/2200
(0.00198) edgeR/upper: 145/2200 (0.004376) 184
GO:0009611: response to wounding
edgeR/TMM: 7/22 (8.009e-05) edgeR/TC: 7/22
(0.001975) edgeR/RLE: 7/22 (0.0001609) edgeR/upper: 7/22 (0.0001092) DESeq: 7/22 (1.977e-05)
7
GO:0009765: photosynthesis, light harvesting
edgeR/TMM: 9/33 (3.03e-05) edgeR/TC: 9/33 (0.001575) edgeR/RLE: 9/33 (7.225e-05) edgeR/upper: 9/33
(4.459e-05) DESeq: 9/33 (5.25e-06) 9
GO:0015995: chlorophyll biosynthetic process
edgeR/TMM: 4/13 (0.003425) edgeR/RLE: 4/13
(0.005109) edgeR/upper: 4/13 (0.00409) 4
GO:0022607: cellular
component assembly edgeR/TMM: 17/153 (0.002249) edgeR/RLE: 17/153 (0.006862) edgeR/upper: 17/153 (0.003725) 17 GO:0034622: cellular
macromolecular complex assembly
edgeR/TMM: 17/131 (0.0003895) edgeR/TC: 21/131 (0.004471) edgeR/RLE: 17/131 (0.001345) edgeR/upper:
17/131 (0.0006802) 18
GO:0044249: cellular biosynthetic process
edgeR/TMM: 163/2634 (0.004014) edgeR/TC: 296/2634
edgeR/upper: 172/2634 (0.002566) GO:0071824: protein-DNA
complex subunit organization
edgeR/TMM: 12/77 (0.0005285) edgeR/RLE: 12/77
(0.001394) edgeR/upper: 12/77 (0.0008159) 12 GO:0071840: cellular
component organization or biogenesis
edgeR/TMM: 39/488 (0.004133) edgeR/TC: 62/488 (0.001511) edgeR/RLE: 42/488 (0.005659) edgeR/upper:
40/488 (0.005529) 46
GO:1901576: organic substance biosynthetic process
edgeR/TMM: 173/2717 (0.0007624) edgeR/TC: 60/517 (0.002539) edgeR/RLE: 43/517 (0.003325) DESeq: 139/2717 (0.002492)
104
*AN – Average number
Table 4: Gene enrichment by pathways from KEGG using hypergeometric test with threshold 0.01
Infected WT – mock WT (UP-regulated)
Enriched pathway DGE methods: number of DE genes/number in pathway
(p-value) AN
00040: Pentose and glucuronate
interconversions baySeq: 5/59 (0.005185) 5
00053: Ascorbate and
aldarate metabolism baySeq: 4/34 (0.003773) 4
00071: Fatty acid
metabolism baySeq: 4/41 (0.007426) 4
00196: Photosynthesis - antenna proteins
egdeR/RLE: 3/22 (0.0004045) egdeR/TC: 2/22 (0.003636) egdeR/TMM: 2/22 (0.004839) egdeR/RLE: 3/22
(0.0004045) egdeR/upper: 3/22 (0.000486) 3
00310: Lysine degradation baySeq: 3/15 (0.0026) 3
00340: Histidine
metabolism baySeq: 4/19 (0.0003946) 4
00520: Amino sugar and nucleotide sugar metabolism
egdeR/TC: 3/99 (0.007877) 3
00561: Glycerolipid
metabolism baySeq: 4/35 (0.004197) 4
00710: Carbon fixation in
photosynthetic organisms egdeR/TMM: 3/77 (0.005895) 3
00941: Flavonoid
biosynthesis baySeq: 3/19 (0.005235) 3
04075: Plant hormone
signal transduction baySeq: 11/232 (0.004992) 11
04626: Plant-pathogen
interaction egdeR/TMM: 4/148 (0.005468) 4
Infected WT – mock WT (DOWN-regulated)
Enriched pathway DGE methods: number of genes (p-value) AN
00941: Flavonoid biosynthesis
egdeR/TC: 3/19 (0.001939) egdeR/TMM: 3/19 (0.000637) egdeR/RLE: 3/19 (0.0003642) egdeR/upper: 3/19
(0.000198) 3
03010: Ribosome egdeR/TC: 10/220 (0.0007847) 10
Mock NIK-OX – mock WT (UP-regulated)
Enriched pathway DGE methods: number of genes (p-value) AN
00010: Glycolysis /
Gluconeogenesis baySeq: 5/105 (0.009524) 5
00030: Pentose
phosphate pathway egdeR/RLE: 4/53 (0.006231) 4
aldarate metabolism 00100: Steroid
biosynthesis egdeR/TMM: 3/30 (0.007618) 3
00520: Amino sugar and nucleotide sugar metabolism
egdeR/TC: 6/99 (0.001176) egdeR/TMM: 6/99
(0.002302) egdeR/RLE: 7/99 (0.000464) egdeR/upper:
6/99 (0.000406) 6
01100: Metabolic pathways
egdeR/TC: 29/1489 (0.006205) egdeR/TMM: 32/1489 (0.006955) egdeR/RLE: 35/1489 (0.001701)
egdeR/upper: 25/1489 (0.005301) DESeq: 11/1489 (0.005527) baySeq: 32/1489 (0.001521)
27
01110: Biosynthesis of
secondary metabolites baySeq: 18/790 (0.009103) 18
03010: Ribosome egdeR/RLE: 9/220 (0.003758) 9
03015: mRNA surveillance
pathway egdeR/TC: 5/82 (0.002935) egdeR/TMM: 6/82 (0.0008711) egdeR/RLE: 5/82 (0.005683) 5
03040: Spliceosome egdeR/TMM: 7/115 (0.0009872) egdeR/RLE: 6/115 (0.005408) egdeR/upper: 6/115 (0.0008969) DESeq:
3/115 (0.005296) 6
04626: Plant-pathogen
interaction baySeq: 6/148 (0.009959) 6
04712: Circadian rhythm -
plant baySeq: 3/29 (0.00525) 3
Mock NIK-OX – mock WT (DOWN-regulated)
Enriched pathway DGE methods: number of genes (p-value) AN
00260: Glycine, serine and
threonine metabolism baySeq: 1/47 (0.008409) 1
00270: Cysteine and
methionine metabolism egdeR/RLE: 4/84 (0.008527) 4
00310: Lysine degradation egdeR/TMM: 2/15 (0.007741) egdeR/RLE: 2/15 (0.008726) 2 00330: Arginine and
proline metabolism egdeR/TC: 4/68 (0.007011) egdeR/RLE: 4/68 (0.004049) egdeR/upper: 4/68 (0.007491) 4 00400: Phenylalanine,
tyrosine and tryptophan
biosynthesis baySeq: 1/43 (0.007696) 1
00460: Cyanoamino acid
metabolism egdeR/upper: 3/28 (0.003841) 3
00600: Sphingolipid metabolism
egdeR/TMM: 2/14 (0.006748) egdeR/RLE: 2/14
(0.00761) 2
01040: Biosynthesis of
unsaturated fatty acids baySeq: 1/32 (0.005732) 1
01100: Metabolic pathways
egdeR/TC: 30/1489 (0.001305) egdeR/TMM: 25/1489 (0.001923) egdeR/RLE: 26/1489 (0.002184)
egdeR/upper: 31/1489 (0.0008773) 28
01110: Biosynthesis of secondary metabolites
egdeR/TC: 20/790 (0.0006046) egdeR/TMM: 18/790 (0.0002926) egdeR/RLE: 17/790 (0.001598)
egdeR/upper: 21/790 (0.0003018) 19
04145: Phagosome egdeR/TC: 4/62 (0.005058) egdeR/TMM: 4/62 (0.002317) egdeR/upper: 4/62 (0.00541) 4
Mock T474D – mock WT (UP-regulated)
Enriched pathway DGE methods: number of genes (p-value) AN
00010: Glycolysis / Gluconeogenesis
egdeR/TC: 12/105 (7.832e-05) egdeR/TMM: 15/105 (0.0001233) egdeR/RLE: 15/105 (5.155e-05) egdeR/upper: 13/105 (0.0007389) DESeq: 13/105 (1.035e-05)
14
00030: Pentose
phosphate pathway egdeR/TMM: 8/53 (0.003243) egdeR/RLE: 8/53 (0.002) egdeR/upper: 8/53 (0.002149) 8 00040: Pentose and
interconversions 00071: Fatty acid metabolism
egdeR/TMM: 7/41 (0.002838) egdeR/RLE: 7/41 (0.001826) DESeq: 5/41 (0.006213) baySeq: 8/41
(0.001677) 7
00100: Steroid
biosynthesis baySeq: 6/30 (0.005547) 6
00196: Photosynthesis - antenna proteins
egdeR/TMM: 6/22 (0.0004269) egdeR/RLE: 5/22 (0.002233) egdeR/upper: 6/22 (0.0002983) DESeq:
5/22 (0.0003424) baySeq: 6/22 (0.001021) 6
00310: Lysine degradation baySeq: 4/15 (0.007989) 4
00350: Tyrosine metabolism
egdeR/upper: 7/26 (0.0001016) egdeR/TMM: 9/26 (1.719e-06) egdeR/RLE: 9/26 (8.977e-07) egdeR/upper: 7/26 (0.0001016) DESeq: 4/26 (0.006158)
7
00480: Glutathione
metabolism egdeR/TMM: 8/62 (0.008529) egdeR/RLE: 8/62 (0.005408) egdeR/upper: 8/62 (0.005786) 8 00620: Pyruvate
metabolism DESeq: 7/75 (0.005825) baySeq: 10/75 (0.008549) 9
00640: Propanoate
metabolism baySeq: 6/31 (0.00656) 6
00710: Carbon fixation in photosynthetic organisms
egdeR/TC: 9/77 (0.0005101) egdeR/TMM: 11/77 (0.0009563) egdeR/RLE: 11/77 (0.000502) egdeR/upper: 11/77 (0.0005522) DESeq: 11/77 (1.247e-05)
11
00950: Isoquinoline alkaloid biosynthesis
egdeR/upper: 4/9 (0.0004001) egdeR/TMM: 4/9 (0.0005163) egdeR/RLE: 4/9 (0.000383) egdeR/upper:
4/9 (0.0004001) 4
01100: Metabolic pathways
egdeR/TC: 64/1489 (0.00289) egdeR/TMM: 115/1489 (1.355e-07) egdeR/RLE: 106/1489 (4.984e-07) egdeR/upper: 105/1489 (1.485e-06) DESeq: 75/1489 (1.933e-06) baySeq: 118/1489 (6.857e-05)
97
01110: Biosynthesis of secondary metabolites
egdeR/TC: 37/790 (0.005873) egdeR/TMM: 67/790 (2.975e-06) egdeR/RLE: 64/790 (1.741e-06) egdeR/upper: 62/790 (9.825e-06) DESeq: 42/790 (0.000117) baySeq: 63/790 (0.002806)
56
03030: DNA replication baySeq: 9/45 (0.0007247) 9
03430: Mismatch repair baySeq: 6/33 (0.008977) 6
Mock T474D – mock WT (DOWN-regulated)
Enriched pathway DGE methods: number of genes (p-value) AN
00040: Pentose and glucuronate
interconversions DESeq: 7/59 (0.00323) 7
00061: Fatty acid
biosynthesis egdeR/TMM: 5/27 (0.005144) 5
00072: Synthesis and degradation of ketone
bodies DESeq: 2/4 (0.006269) 2
00100: Steroid biosynthesis
egdeR/RLE: 7/30 (0.000406) egdeR/TC: 9/30 (0.0002224) egdeR/TMM: 7/30 (0.0002156) egdeR/RLE: 7/30 (0.000406) egdeR/upper: 7/30 (0.0002802) DESeq: 6/30 (0.0003867)
7
00196: Photosynthesis - antenna proteins
egdeR/TC: 6/22 (0.004306) egdeR/TMM: 6/22 (0.0002451) egdeR/RLE: 6/22 (0.0004286)
egdeR/upper: 6/22 (0.0003089) DESeq: 6/22 (6.091e-05)
6
00230: Purine metabolism egdeR/TC: 20/133 (0.001844) 20
00240: Pyrimidine metabolism
egdeR/TC: 17/97 (0.0007093) egdeR/TMM: 12/97 (0.0008578) egdeR/RLE: 13/97 (0.0006448) egdeR/upper: 12/97 (0.00124) DESeq: 11/97 (0.0003631)
00270: Cysteine and
methionine metabolism egdeR/TMM: 9/84 (0.009458) egdeR/RLE: 10/84 (0.006216) 9.5 00330: Arginine and
proline metabolism egdeR/TMM: 9/68 (0.002311) egdeR/RLE: 10/68 (0.001289) egdeR/upper: 10/68 (0.000812) 10 00640: Propanoate
metabolism egdeR/TMM: 5/31 (0.00941) DESeq: 5/31 (0.003251) 5
00909: Sesquiterpenoid
biosynthesis baySeq: 1/1 (0.006498) 1
00941: Flavonoid biosynthesis
egdeR/TC: 8/19 (3.171e-05) egdeR/TMM: 6/19 (9.945e-05) egdeR/RLE: 6/19 (0.0001761) egdeR/upper: 6/19 (0.000126) baySeq: 2/19 (0.006678)
6
01040: Biosynthesis of
unsaturated fatty acids egdeR/TC: 7/32 (0.007786) 7
01100: Metabolic pathways
egdeR/TC: 158/1489 (2.273e-06) egdeR/TMM: 107/1489 (8.155e-08) egdeR/RLE: 115/1489 (1.409e-07) egdeR/upper: 109/1489 (2.093e-(1.409e-07) DESeq: 80/1489 (1.399e-05) baySeq: 21/1489 (0.0007097)
98
01110: Biosynthesis of secondary metabolites
egdeR/TC: 87/790 (0.0001255) egdeR/TMM: 63/790 (1.555e-06) egdeR/RLE: 67/790 (3.052e-06) egdeR/upper: 62/790 (1.197e-05) DESeq: 44/790 (0.0005858) baySeq: 14/790 (0.0006895)
56
03008: Ribosome
biogenesis in eukaryotes egdeR/TC: 12/76 (0.009601) 12
03010: Ribosome
egdeR/TC: 52/220 (4.015e-14) egdeR/TMM: 29/220 (7.252e-08) egdeR/RLE: 32/220 (1.608e-08) egdeR/upper: 31/220 (1.419e-08) DESeq: 28/220 (1.177e-09) baySeq: 6/220 (0.003243)
30
03030: DNA replication
egdeR/TC: 12/45 (7.438e-05) egdeR/TMM: 12/45 (2.649e-07) egdeR/RLE: 12/45 (8.003e-07)
egdeR/upper: 12/45 (4.188e-07) DESeq: 9/45 (1.381e-05)
11
03420: Nucleotide
excision repair egdeR/TMM: 8/59 (0.00342) egdeR/RLE: 8/59 (0.006359) egdeR/upper: 8/59 (0.004429) 8
03430: Mismatch repair
egdeR/TC: 11/33 (1.477e-05) egdeR/TMM: 10/33 (7.184e-07) egdeR/RLE: 10/33 (1.843e-06)
egdeR/upper: 10/33 (1.061e-06) DESeq: 7/33 (8.504e-05)
10
04075: Plant hormone signal transduction
egdeR/TC: 28/232 (0.007199) egdeR/TMM: 20/232 (0.00233) egdeR/RLE: 21/232 (0.003478)
egdeR/upper: 20/232 (0.003775) DESeq: 17/232 (0.001944)
21
04144: Endocytosis egdeR/TMM: 8/67 (0.007471) egdeR/upper: 8/67 (0.009552) 8
04146: Peroxisome egdeR/TC: 11/61 (0.004708) 11
*AN – Average number
3.4 - Constitutive activation of NIK impairs translation and confers broad-spectrum tolerance against begomoviruses
There was a significant decrease (34% in T474D-5, 29.5% in T474D-6 and 27% in 2; P<0.05) in the amount of newly synthesized protein in T474D-overexpressing leaves compared with the amounts found in wild-type and NIK-overexpressing leaves (Figure 10A). We observed a slight variation in the T474D-mediated inhibition of translation during development, as the level of translation suppression was about 7% less when incorporation of [35S]Met into
total proteins was measured in 28 days-old leaves (Figure 10B). This down-regulation of translation might underlie, at least in part, the molecular mechanisms involved in NIK-mediated antiviral defenses.
We next examined whether the constitutive activation of NIK was effective at controlling begomovirus infection. To this end, four independent T474D-overexpressing transgenic lines (T474D-9, T474D-6, T474D-5 and T47D-2), a wild-type (untransformed) line and the NIK-overexpressing lines NIK1-4 and NIK1-6 (Carvalho et al., 2008) were inoculated with tandemly repeated ToYSV DNA-A and DNA-B (Carvalho et al., 2008) using biolistic delivery, and the plants were assayed for symptoms of infection and the accumulation of viral DNA, as detected by PCR and qPCR. The wild-type plants displayed typical symptoms of ToYSV infection, such as leaf curling and yellow spots all over the leaves (>10 spots/cm2; Figure 11A). Consistent with a
The accumulation of total virus transcripts in all infected lines was confirmed in our RNA sequencing data (Figure 12C).
Likewise, in the T474D-2 and T474D-5 lines, the progress and rate of infection were delayed compared with those of the wild-type control lines and the NIK1-overexpressing lines (Figure 10F and 10G) and the loading of coat protein mRNA in the actively translating polysomes was lower than that in wild-type and NIK1-overexpressing lines (Figure 12B). In the case of ToYSV, which showed high levels of accumulation in all samples analysed, both the T474D-2 and T474D-6 lines displayed lower viral DNA accumulation levels in the systemically infected leaves, although the high dispersion of the data among the samples prevented us from ascertaining the statistical significance of these findings (Figure 11H).
Figure 10. Ectopic expression of the T474 mutant receptor down-regulates global protein synthesis in leaves of 10 days (A)-old ad 28 days-old (B) tomato plants. Equal fresh weight of tomato leaves (300 mg) were incubated with 50 µg/ml chloramphenicol and 20 µCi of [35S]methionine for 3 h at room temperature. Incorporation of [35S]Met into protein was measured in the
Figure 12. Polysome loading of viral mRNA is reduced in in systemically infected leaves of T47D-6-overexpressing lines. (A) Polysome loading of coat protein (CP) mRNA from ToYSV DNA-A in systemically infected leaves of WT, NIK-overexpressing and T47D-6-overexpressing lines. Polysomes from infected WT, NIK1-4-overexpressing and T474D-6-overexpressing lines were isolated from systemic leaves at 10 days post-inoculation with tandemly copy of DNA-A and DNA-B of ToYSV, as shown in Fig. S7. Polysome-bound RNA form pooled fractions was extracted with phenol/chloroform/isoamyl alcohol, precipitated with isopropanol, blotted and probed with the coat protein DNA (CP) and 18S rDNA. The identity of the polysome pooled fraction was confirmed by treatment with 25 mM EDTA prior to sucrose gradient (data not shown), which releases mRNA from polysomes. (B) Quantitation of polysome loading of coat protein viral transcripts in T474D overexpressing lines by qRT-PCR. Polysomes from infected WT, NIK1-4-overexpressing and T474D-6-overexpressing lines were isolated 10 days post-inoculation with infectious ToYSV clones. Polysome-bound RNA form pooled fractions was extracted with phenol/chloroform/isoamyl alcohol and precipitated with isopropanol and quantified by qRT-PCR. Values were normalized to the expression of Actin. Error bars represent SD from three measurements. (C) Expression profile of viral gene transcripts in T474D overexpressing lines. RNA-sequencing data of viral gene transcripts in systemic leaves of WT, NIK1-overexpressing and T474D-overexpressing plants, 10 days post-inoculation with tandemly repeated copies of ToYSV DNA-A and DNA-B. CP is coat protein, Rep/Trap/Ren, corresponds to the transcript encoding replication protein (Rep), transactivator protein (Trap) and replication enhancer protein (Ren), MP is movement protein and NSP, nuclear shuttle protein.
4 – Discussion
Begomoviruses are one of the largest and most successfully groups of plant viruses and cause severe diseases in major crops worldwide, inflicting significant economic losses in many dicotyledonous crops. The tomato-infecting begomoviruses have become an even greater threat to the tomato cultivation due to the emergence of new species along with the recent introduction in South America of a new biotype of the whitefly vector Bemisia tabaci that colonizes tomato plants with high efficiency (Castillo-Urquiza et al., 2008; Albuquerque et al., 2012). Current climate changes are expected to alter more the whitefly distribution along the globe posing a serious threat to agriculture worldwide. Here we described a novel strategy to control begomovirus infection. By constitutively activating the NIK-mediated antiviral signaling we succeeded in developing a tolerant crop, tomato, which is inflicted by a diverse begomovirus complex, making engineered tolerance/ resistance an even more difficult task to accomplish. Very importantly, the T474D-overexpressing tomato transgenic lines were tolerant to ToYSV and ToSRV, which display highly divergent genomic sequences and hence are phylogenetically separated within the two major groups of begomoviruses found in Brazil (Albuquerque et al., 2012). These observations may indicate the potential of a sustained NIK-mediated defense pathway to confer broad-spectrum tolerance to begomoviruses in distinct plant species.
A comparison between the transcriptomes induced by virus infection in wild type lines and by ectopic expression of the T474D gain-of-function mutant in transgenic lines indicated that virus infection was the trigger of the NIK-mediated antiviral pathway and the T474D hyperactive receptor could support a sustained antiviral response. Therefore, upon perception of virus infection the plant cells may activate or synthesize an unknown molecule signal to trigger the NIK-mediated antiviral defense.
three independently tomato displayed identical gene expression profiles induced by ectopic expression of T474D mutant receptor. Secondly, while 90% of the ribosomal protein genes were down-regulated; several resistant protein-like genes and pathogenesis-related genes were up-regulated in T474D transgenic lines. These results indicate that the expression of ribosomal genes and immune system-related genes were coordinately reprogrammed in the transgenic lines. This coordinate regulation of subnetworks of gene sets, which are involved in the same cellular processes (translation and cell defense), is likely a result from activation of a master regulator (in this case, the immune receptor NIK) rather than an artefact of ectopic expression of the gain-of-function mutant. Very importantly, the T474D-induced transcriptome explained the tolerant phenotype of both transgenic species against distinct begomoviruses. Thirdly, although virus infection and a sustained NIK pathway by ectopically expressing T474D may induce similar defense responses, the intensity of the output is expected to be higher in T474D transgenic lines because T474D bypasses viral NSP inhibition. Consistent with this prediction, both down-regulation of the translational machinery genes (see Figure 2D for comparison) and up-regulation of immune-related genes (RNA sequencing data) were more pronounced in T474D-overexpressing lines than in infected WT. Finally, expression of the T474D mutant potentiated the NIK-mediated response, as it would be expected from expression of a constitutively activated defense receptor NIK. The down-regulation of ribosomal gene expression (Figure 2C) and up-regulation of immune-related genes were more extreme in the T474D lines than in NIK lines. Very likely, the induction of the immune system and activation of a resistance-like response, as observed in T474D lines, require a sustained NIK signaling, because overexpression of normal NIK in tobacco does not cause induction of PR genes (Carvalho et al., 2008). Accordingly, the ectopic expression of the T474D gain-of-function mutant was more effective against begomovirus infection than overexpression of the NIK defense receptor in both Arabidopsis and tomato transgenic lines.
plants. In fact, plant viruses from diverse families use different gene expression strategies, such as cap-independent translation strategies, to bypass host regulatory mechanisms and sustain the translation of viral proteins (Kneller el al. 2006). Furthermore, the majority of plant viruses are (+) single-stranded RNA viruses that are not known to globally inhibit host translation. In the case of geminiviruses, however, which rely completely on the plant translation machinery and cannot circumvent host translational regulation, a global repression of translation is expected to significantly affect virus infection, as observed in the T474D-overexpressing lines. In fact, by assessing directly viral transcripts, we showed that the loading of coat protein mRNA into actively translating polysomes was significantly reduced in systemic infected leaves of T474D-overexpressing as compared to that of Col-O and NIK1-overexpressing lines (Figure 12). This indicates that suppression of global protein synthesis may effectively protect plant cells against DNA viruses.