J. Sens. Sens. Syst., 2, 73–84, 2013 www.j-sens-sens-syst.net/2/73/2013/ doi:10.5194/jsss-2-73-2013
©Author(s) 2013. CC Attribution 3.0 License. Open
Access
JSSS
Journal of Sensors and Sensor Systems
Detection of coatings within liquid-filled tubes and
containers by mode conversion of leaky Lamb waves
M. Schmitt1, K. Schmidt1, S. Olfert2, J. Rautenberg2, G. Lindner1, B. Henning2, and L. M. Reindl3 1Coburg University of Applied Sciences, Institute of Sensor and Actuator Technology,
Am Hofbrauhaus 1b, 96450 Coburg, Germany
2University Paderborn, Faculty of Electrical Engineering, Computer Science and Mathematics, Measurement
Engineering Group, Warburger Str. 100, 33098 Paderborn, Germany
3University Freiburg, Department of Microsystems Engineering – IMTEK, Laboratory for Electrical
Instrumentation, Georges-Koehler-Allee 106, 79110 Freiburg, Germany
Correspondence to:M. Schmitt ([email protected])
Received: 18 December 2012 – Accepted: 24 April 2013 – Published: 23 May 2013
Abstract. In this paper, a new acoustic sensor principle for coating detection within liquid-filled tubes and
containers based on mode conversion of leaky Lamb waves is introduced. Leaky Lamb waves are excited and detected by single-phase transducers, which are attached on the outer side of a tube or container. By transmission time and amplitude measurements, coating formation within the liquid-filled tube and container is detected non-invasively. This new sensor principle is subdivided into the separate considerations of Lamb wave excitation, mode conversion and inverse mode conversion. The Lamb wave excitation by a single-phase transducer is visualized by scanning laser Doppler vibrometer imaging. The mode conversion process of leaky Lamb waves is measured by membrane hydrophone measurements and Schlieren visualization; afterwards, the measured emission angles are compared with the theoretical one. The inverse mode conversion process of pressure waves back to leaky Lamb waves is visualized by Schlieren images. By merging the results of Lamb wave excitation, mode conversion and inverse mode conversion, the new sensor concept is explained. Theoretical considerations and measurement results of adhesive tape coating inside a liquid-filled plastic tube and a liquid-filled stainless steel container verify the new acoustic sensor principle. Finally the measuring sensitivity and the technical realization are discussed.
1 Introduction
The detection of coatings within liquid-filled tubes and con-tainers is relevant for many technical facilities. The applica-tion field ranges from water-supplying systems and the food industry to the chemical industry. Different kinds of sensors such as fiber optical sensors, electrochemical sensors, pres-sure sensors or heat sensors were investigated for the mea-surement of the presence and the thickness of organic or in-organic deposits (Withers, 1996; Flemming, 2003). Unfor-tunately, all aforementioned sensors must be brought in di-rect contact to the coating or the fluid. In contrast, acous-tical sensors have the possibility to work non-invasively (Janknecht and Melo, 2003). However, standard ultrasonic
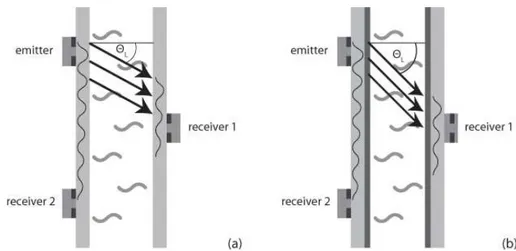
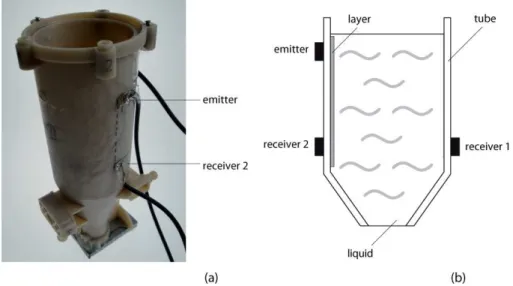
Figure 1.(a)The measurement setup for the new acoustic sensor principle consists of one emitter and two receivers attached to the outer side of a tube or a container.(b)A formation of a coating inside the tube or container results in changes of the transmission times and the amplitudes of the acoustic signals on receiver 1 and receiver 2.
In this paper, a new acoustical sensor concept based on leaky Lamb waves traveling on the wall of tubes or containers is introduced. Leaky Lamb waves, which have a dominant emission into the adjacent liquid, are excited and detected by single-phase transducers, which are attached to the outer side of the tube or the container structure. This means that no sensor element must be inserted into the tube or container. Hence, the boundary of sterility stays intact.
In contrast to former publications in the literature, a leaky Lamb wave on technical common non-piezoelectric sub-strates, such as steel-, aluminum- or fiber-reinforced plastics is investigated for coating detection. Before, only non-leaky Lamb wave (Lohr and Rose, 2003) on non-piezoelectric sub-strates or shear horizontal waves on piezoelectric subsub-strates (Balantine et al., 1997; Thomson and Stone, 1997) were in-vestigated, because it was thought that bulk acoustic waves or surface acoustic waves with a dominant vertical displace-ment would be inapplicable for coating detection in a liquid environment (L¨ange et al., 2008; Calabrese et al., 1987).
In this journal paper, the new acoustical sensor concept based on mode conversion of Lamb waves will be intro-duced. Scanning laser Doppler vibrometer images of Lamb wave excitation by single-phase transducers are recorded and compared with diffraction theory. If the excited Lamb wave is in contact with water, mode conversion occurs. The emission angle is measured by a membrane hydrophone measurement and by Schlieren imaging. The evaluated emission angle is compared with the theoretical one. The inverse mode con-version of the mode-converted pressure wave back to a Lamb wave on the opposite side of a two parallel plate arrangement is visualized by Schlieren images. Theoretical considerations and measurement results of coating detection within a plastic tube and a stainless steel container are presented. Finally, the measuring sensitivity and the technical realization of the new acoustical sensor concept will be discussed.
2 New measurement concept
The new acoustic measurement principle for coating detec-tion is based on the mode conversion process of Lamb waves. Lamb waves are excited by an emitter attached to the outer side of the tube or container (Fig. 1a). Because the phase velocity of the dominant excited antisymmetrical zero-order Lamb wave is higher than the sound velocity in water, mode conversion occurs. This means that a pressure wave is radi-ated under a characteristic angle, called Lamb angle, into the adjacent liquid (Fig. 1a). On the opposite side of the tube or container, the pressure wave in the liquid generates a Lamb wave again (Fig. 1a). With receiver 1 on the opposite wall of the tube or container, the sound wave through the liquid can be detected. If the distance between the emitter and receiver 2 on the same side of the tube or container is not too long, the residual Lamb wave can be evaluated too. By burst excitation of the emitter, one part of the wave group travels through the liquid by mode conversion and inverse mode conversion, and the residual part of the wave group remains on the emitter side. Both signals are evaluated for the measurement of the transmission time and the amplitude.
Figure 2.(a)Interdigital transducer on a piezoelectric substrate.(b)Single-phase transducer on a non-piezoelectric substrate.
3 Lamb wave excitation
Typically, surface acoustic waves are excited on piezoelectric substrates by interdigital transducers (Fig. 2a) (White, 1970). In order to excite surface acoustic waves on non-piezoelectric substrates, a single-phase transducer can be utilized (White, 1970; Lindner, 2008). The single-phase transducer consists of a piezoelectric PZT block, which is metalized with a comb pattern on one side (Fig. 2b). The opposite side of the piezo-electric block is completely metalized (Fig. 2b). On the comb pattern, an electrical high-voltage signal is applied, and on the opposite complete metalized side the electrical ground signal is applied (Fig. 2b). By the right choice of the dis-tance between the fingers of the comb structure, the oper-ation frequency of the transducer can be adjusted. In this paper, a single-phase transducer with a center frequency of 1 MHz is utilized. By gluing the single-phase transducer onto the non-piezoelectric substrates, either Rayleigh or Lamb waves can be excited. If the thickness of the substrate is smaller than the acoustic wavelength, Lamb waves are ex-cited on the substrate; when vice versa, Rayleigh waves are excited (Viktorov, 1967). During the excitation, the defor-mation of the single-phase transducer is transferred onto the non-piezoelectric substrate. In this way, the pitch of the fin-gers defines the acoustic wavelength of the excited Lamb or Rayleigh wave.
The phase velocity of Lamb waves depends on the excita-tion frequency and the plate thickness (Viktorov, 1967). The dispersion curve of a glass plate in Fig. 3 shows the depen-dency of the phase velocity on the product of frequency and plate thickness. The dispersion curve was calculated by the global matrix method (Lowe, 1995). The basic model for the calculation consists of a thin glass plate with a thick-ness of 1 mm having contact to a liquid half-space of wa-ter on one side and contact to a vacuum half-space on the other side. In the low frequency thickness region, the anti-symmetrical zero-order Lamb wave mode (A0), the symmet-rical zero-order Lamb wave mode (S0) and the quasi-Scholte plate mode (QSP) can exist (Fig. 3).
Because the used single-phase transducer has only two fin-gers with a finite width and the excitation signal is a sinu-soidal burst, all modes within an excitation region are ex-cited by the single-phase transducer (Monkhouse et al., 1997)
Figure 3. Dispersion diagram of a glass plate in contact with a liquid half-space together with the excitation line and the excita-tion region of the single-phase transducer. (glass:vl=5654 m s−1, vs=3391 m s−1, ρ=2550 kg m−3; water: vl=1480 m s−1, vs= 0.0001 m s−1,
ρ=1000 kg m−3).
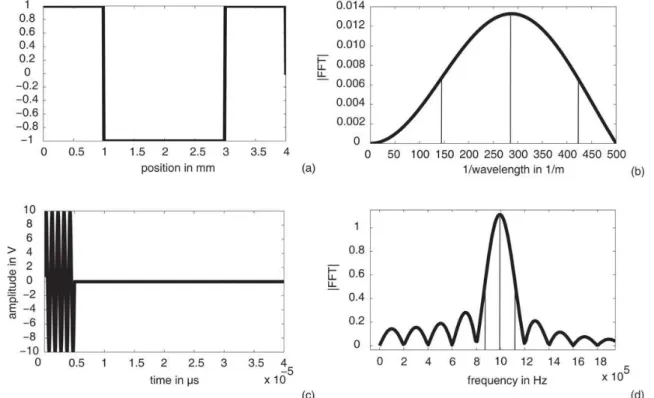
(Fig. 3). The boundaries of this excitation region are defined by the half bandwidth of the Fourier transform of the spatial distribution of the finger structure and the half bandwidth of the Fourier transform of the excitation signal (Fig. 4).
For a plate without liquid contact, the fundamental anti-symmetrical and anti-symmetrical Lamb wave modes are excited. Because the symmetrical zero-order Lamb wave mode has nearly no normal displacement component in the frequency thickness region of 1 MHz mm (Rose, 1999; Viktorov, 1967), only the antisymmetrical zero-order Lamb wave mode can be detected by the laser Doppler vibrometer. Figure 5 shows scanning laser Doppler vibrometer images of the Lamb wave excitation on a 1 mm-thick glass plate at 3.71µs (a), 8.4µs (b) and 14.65µs (c) after the starting time of the excita-tion signal. In the images, a transiexcita-tion from near-field diffrac-tion to far-field diffracdiffrac-tion can be observed. The transidiffrac-tion lengthxF between near-field and far-field diffraction can be described by
xF≈ W2k
Figure 4.(a)Spatial distribution of the two-finger single-phase transducer.(b)Fourier transform of the spatial distribution of the two-finger single-phase transducer with the half bandwidth drawn in.(c)Time signal of the excitation.(d)Fourier transform of the time signal of excitation with the half bandwidth drawn in.
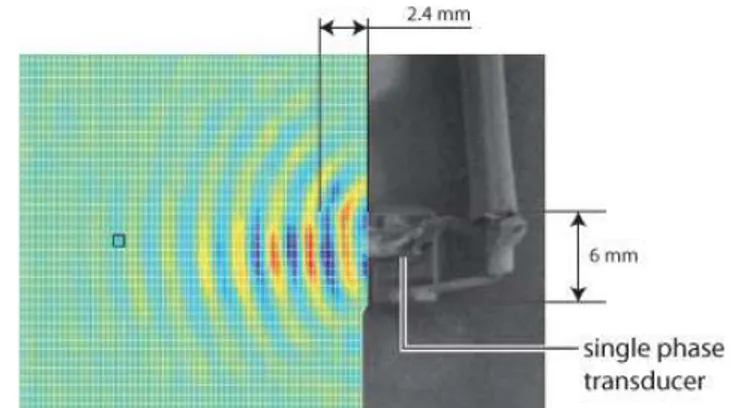
whereWis the aperture of the transducer,kis the Lamb wave number and|b|describes the diffraction spreading (Morgan, 2007). In the current case, the glass substrate is isotropic, meaningb=1. With the wavelength of the excited antisym-metrical zero-order Lamb wave mode of 3 mm, the thickness of the glass substrate of 1 mm and the aperture of the trans-ducer of 6 mm, the transition length is
xF≈2.4 mm. (2)
A comparison between the calculated transition length and the scanning laser Doppler vibrometer images proves the cal-culation that, after this transition length, the emitted wave front is more radial than parallel (Fig. 6).
4 Mode conversion
4.1 Concept of mode conversion
If the Lamb wave is in contact with liquid, mode conver-sion occurs. This means that a pressure wave is radiated into the liquid under a characteristic angle, called Lamb angle (Fig. 7). The Lamb angle ΘL can be easily calculated by Snell’s law:
ΘL=arcsin vliquid vLamb
!
, (3)
wherevLambis the Lamb wave velocity andvliquidis the sound velocity in the liquid.
In order to prove the concept of mode conversion, mem-brane hydrophone measurements and Schlieren visualization of the radiated sound field are recorded, evaluated and com-pared with the calculation results.
4.2 Membrane hydrophone measurements
Figure 5.Scanning Laser Doppler vibrometer images of the Lamb wave excitation of a single-phase transducer on a glass plate after
(a)3.71µs,(b)8.4µs and(c)14.65µs after the excitation signal.
regression line gives the emission angle (Fig. 9). By Snell’s law (Eq. 3) and with the knowledge of the sound velocity of 1480 m s−1in water and the Lamb wave phase velocity of the A0 mode of 2210 m s−1for a frequency thickness product of 1 MHz×1 mm (Fig. 3), the value of the emission angle is evaluated. The comparison between the calculated Lamb an-gle of
ΘL,calculation=42◦ (4)
Figure 6.The calculated transition length of diffraction of 2.4 mm and the aperture of the transducer of 6 mm are drawn in the scanning laser Doppler image for comparison.
Figure 7.Excitation of a pressure wave into the adjacent liquid by mode conversion of a Lamb wave.
and the measured Lamb angle of
ΘL,hydrophone=(40.1±2.4)
◦
. (5)
shows good agreement. Detailed investigations of Lamb wave emission by a single-phase transducer on glass slides with different thicknesses can be found in Schmitt et al. (2012).
4.3 Schlieren visualization
Figure 8.(a)Measurement setup for membrane hydrophone measurements.(b)The emission profile is measured in the plane orthogonal to the plate and centered orthogonal to the finger structure of the single-phase transducer.
Figure 9.Emission profile of the antisymmetrical zero-order Lamb wave mode on a glass plate of 1 mm thickness.
density variations within the liquid resulting in a diffraction object for the light. The diffracted light is evaluated to ob-tain a picture of sound wave propagation within the liquid (Settles, 2001).
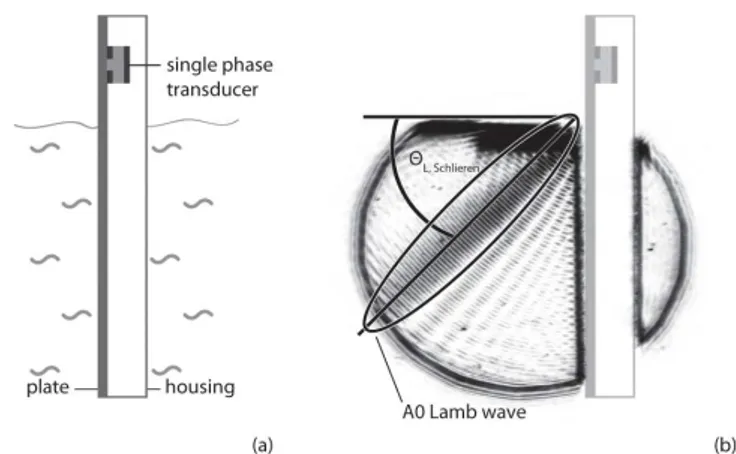
The emission of pressure waves into the adjacent water for a glass plate with 1.0 mm thickness and the position of the single-phase transducer above the liquid level can be seen in Fig. 10b. An emission lobe can be observed in the Schlieren figure, which can be attributed to the emission from the ex-cited A0 Lamb wave mode (Fig. 10b). Moreover, an interfer-ence pattern can be seen in the Schlieren figure.
For the comparison with the calculated radiation angle of the A0 Lamb wave mode, the radiation angle of the A0 Lamb wave has been measured. The measured emission angle of the 1 mm-thick glass plate is about
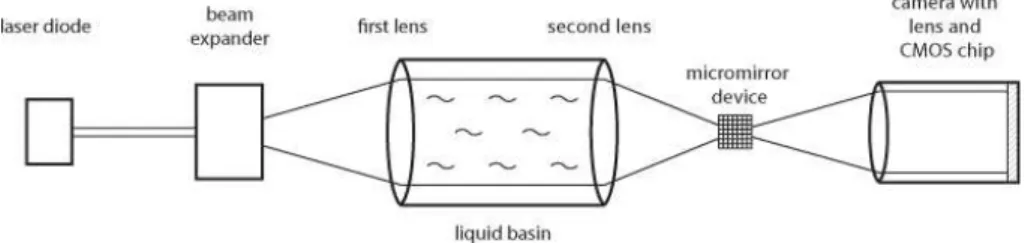
Figure 10.(a)Measurement setup for Schlieren visualization of Lamb wave emission.(b)Emission profile of acoustic wave excited by a single-phase transducer on a 1 mm-thick glass plate.
ΘL,Schlieren=45◦. (6)
The difference between the measured and calculated emis-sion angles of 42◦ (Eq. 4) of the A0 Lamb wave can be at-tributed to an interference with the emission of the parallel excited symmetrical zero-order Lamb wave mode (Rauten-berg et al., 2013).
5 Inverse mode conversion
The mode-converted pressure wave in the liquid gets on the opposite side of the tube or container retransformed into a Lamb wave again. In order to prove and visualize this inverse mode conversion process, Schlieren images were made.
Figure 12.(a)Measurement setup for the Schlieren visualization of the inverse mode conversion process.(b)Schlieren image of the sound wave propagation within the liquid-filled gap of the measurement setup.
outer side too (Fig. 12a). In order to protect the transduc-ers from water, the outer plate sides with the transductransduc-ers are covered by housings. The setup is dipped into the water in such a way that the transmitter is just above the liquid level (Fig. 12a). The transmitter and the receiver are single-phase transducers with a center frequency of 1 MHz, which are de-signed to excite dominantly the antisymmetrical zero-order Lamb wave mode on thin plates. The transmitter is excited by a continuous sinusoidal signal with a peak to peak voltage of 32 V.
Because the transmitter is above the liquid level, the ex-cited Lamb wave enters into the liquid, and mode conversion occurs therein. This means that an inhomogeneous pressure wave is excited into the liquid with a characteristic Lamb an-gle. The pressure wave passes the liquid and is reflected back into the liquid again by the second glass slide (Fig. 12b). This process of passing and reflection occurs a few times within the liquid-filled gap between the two plates. In the Schlieren image, the sound propagation way through the liquid can be described by a zigzag pathway (Fig. 12b). Therefore, the par-allel plate arrangement behaves like a bulk acoustic waveg-uide (Rautenberg et al., 2012). In the case of burst excita-tion, the receiver signal consists of several well-distinguished wave groups, which are evaluated for transmission time and amplitude measurements (Lindner et al., 2006).
Detailed inspection of the first reflection on the right plate reveals a lateral displacement of the outgoing reflected pres-sure wave (Fig. 12b). This lateral displacement, in the
lit-erature called non-specular reflection, corresponds to the Schoch phenomenon and is attributed to Lamb wave exci-tation and subsequent mode conversion (Schoch, 1952; Pitts et al., 1977). At other places of reflection, no such displace-ment can be seen. A possible explanation of this phenomenon could be provided by the assumption that, besides the sound waves within the liquid, Lamb waves are propagating on both plates and thus the plates may not be considered to be undis-turbed except for the first reflection at the receiver plate.
Further investigations on sound wave propagation within a container structure can be found in Schmitt et al. (2013).
6 Theoretical considerations
Figure 13. Dispersion diagram of a steel plate (vl=5707 m s−1, vs=3155 m s−1, ρ=7850 kg m−3, d=1 mm) with and without a nickel coating (vl=5793 m s−1,vs=3202 m s−1, ρ=8000 kg m−3) of 100µm thickness in contact with a water half-space (vl= 1480 m s−1,
ρ=1000 kg m−3).
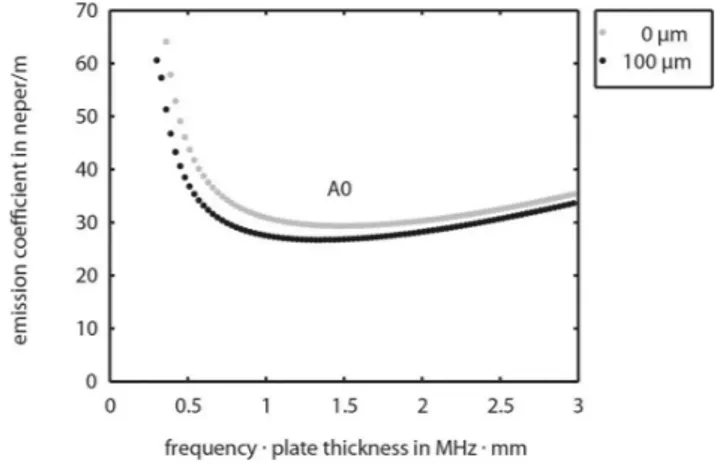
diagram of the two-layer system with contact to one liquid half-space are plotted. For example, in Figs. 13 and 14 the dispersion diagram and the emission diagram of a steel plate with and without a layer of 100µm nickel in contact with one water half-space is illustrated.
The coating of 100µm nickel on the steel plate results in an increase of the phase velocity of the A0 leaky Lamb wave mode (Fig. 13). By Eq. (3), an increase of the phase veloc-ity of the A0 leaky Lamb wave mode leads to a decrease of the Lamb angle. Depending on the position of receiver 1 (Fig. 1), the measured transmission time can increase or de-crease. For the emission diagram the nickel coating results in a decrease of the emission coefficient (Fig. 14), which means that the amplitude of the measured acoustic wave on receiver 1 (Fig. 1) will be reduced. For other substrate-coating combi-nations, individual dispersions and emission diagrams must be calculated.
These theoretical considerations demonstrate the impact of a coating on the measured transmission times and ampli-tudes. Due to ideal assumptions in the theory of the global matrix method, such as ideal adhesion condition on the inter-face of the two layers or well-known material parameters, it is hard to compare theoretical with experimental results in an absolute way. As proof of the concept of coating detection within liquid-filled tubes or containers by mode conversion of leaky Lamb waves, measurement results of adhesive tape layers are summarized in the next chapter.
7 Measurements
7.1 Tube
For the detection of coatings inside a liquid-filled tube, a plastic tube from a medical machine consisting of PES GF20 is modified by adding three single-phase transducers
Figure 14. Emission diagram of a steel plate (vl=5707 m s−1, vs=3155 m s−1, ρ=7850 kg m−3, d=1 mm) with and without a nickel coating (vl=5793 m s−1, vs=3202 m s−1, ρ=8000 kg m−3) of 100µm thickness in contact with a water half-space (vl= 1480 m s−1,
ρ=1000 kg m−3).
Figure 15.(a)PES GF 20 tube attached with single-phase transducers.(b)The measurement setup for coating detection.
Figure 16.The acoustic receiver signal of receiver 1 through the liquid-filled tube without and with a 300µm coating of adhesive tape on the emitter side.
7.2 Container
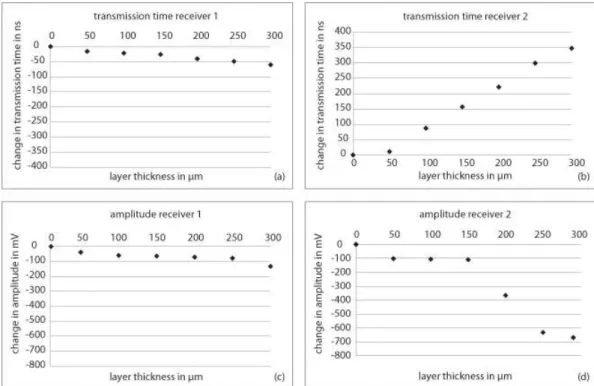
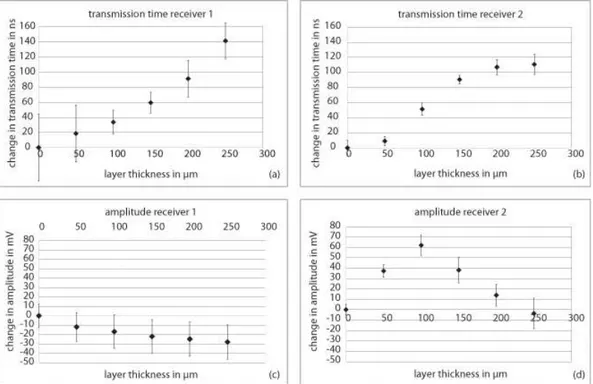
For the detection of coatings in a container structure, a mea-surement setup consisting of stainless steel was manufac-tured (Fig. 18a). It is built up by two parallel steel plates with a distance of 7 mm. Between those plates, water is filled. On the emitter plate, a delay line configuration with an emit-ter and receiver 2 is positioned, and on the opposite plate receiver 1 is positioned (Fig. 18b). Adhesive tape with the known thickness of 50µm per stripe is glued onto the emit-ter wall (Fig. 18b). The changes in the measured transmis-sion times and amplitudes of the two receivers are evaluated (Fig. 19). For receiver 2 on the delay line, an increase in the transmission time (Fig. 19b) can be measured; for the am-plitude, first an increase until 100µm and then a decrease can be observed (Fig. 19d). The increase in the transmission time is attributed to an increase of mass by the adhesive tape. The increase in the amplitude can be explained by a
preven-tion of the mode conversion process by the addipreven-tion layer on top of the plate in the low thickness range and the decrease in the amplitude by the dominance of the mass effect in the high thickness range. For the signal through the liquid, an increase in the transmission time (Fig. 19a) and a decrease in amplitude (Fig. 19c) occurs. This can be explained by a higher Lamb angle with increasing coating thickness and an extension of the propagation length through the liquid. Further measurement results of correction fluid and adhesive tape layers on glass plates in an acoustic waveguide configu-ration can be found in Lindner et al. (2009).
8 Sensitivity and technical realization
Figure 17.Measurement results of adhesive tape of different thicknesses in the tube for the changes of the transmission times and amplitudes of the acoustic signals on the emitter wall and through the liquid. The standard deviation is too small to be drawn in.
Figure 18.(a)Measurement setup for the container structure consisting of stainless steel.(b)The measurement setup consisting of two parallel plates onto which one emitter and two receivers are attached.
of temperature and liquid mixture is much smaller than the measurement effect in presence of the coating.
Figs. 15a and 18a show measurement setups for labor us-age. For a technical realization the transducers must be en-closed in special housings, which can be attached by clamp-ing arrangements and a couplclamp-ing medium or by gluclamp-ing to the tube or container. A similar acoustic sensor device has been developed for lubrication surveillance in bearings by leaky Lamb waves and will be brought onto the market (BestSens AG, 2013).
9 Summary and conclusion
Figure 19.Measurement results for the changes of the transmission times and of the amplitudes on the two receivers for increasing adhesive tape thickness in the stainless steel container.
inside a tube and a container arrangement show a clear de-pendency on coating thickness for the measured transmission times and amplitudes. For technical realization, the transmis-sion time of the residual Lamb wave is suggested, because of the minor cross sensitivity to temperature and liquid mixture. The new measurement method of coating detection within liquid-filled tubes and containers by mode conversion of leaky Lamb waves has the huge advantage of a lower detec-tion limit compared to tradidetec-tional ultrasonic methods such as transmission technique or pulse–echo technique. In this pa-per it has been demonstrated that the detection range for coat-ing detection by leaky Lamb wave is from 50 to 250µm. For traditional ultrasonic transmission technique it is from 500 to 6000µm (Withers, 1996), and for pulse–echo technique it is from 100 to 500µm (Withers, 1996). Moreover, the de-tection of coating by leaky Lamb wave is non-invasive. This means that the boundary of sterility is not breached, since the single-phase transducers are attached on the outer side of the tube or container wall. Other sensors with such a low detec-tion range, such as fiber optical sensors, electrochemical sen-sors, pressure sensors or heat sensen-sors, have to be positioned inside the tube or container, causing problems with steril-ity and cleanabilsteril-ity. In the future more work on modeling, especially adhesion conditions and material parameters, and further measurements with different tube or container wall materials and coatings ought to be done, to get calibration models and curves for technical realization.
Acknowledgements. The authors gratefully acknowledge the support obtained from the research teams of the Institute of Sensor and Actuator Technology of Coburg University, the Measurement Engineering Group of Paderborn University and the Microacoustic Group of Freiburg University. The Institute of Sensor and Actuator Technology is supported by European Union within the program “EFRE” (project “Sensolutions”).
Edited by: R. Maeda
Reviewed by: two anonymous referees
References
Balantine, D. S., White, R. M., Martin, S. J., Ricco, A. J., Zellers, E. T., Frye, G. C., and Wohltjen, H.: Acoustic Wave Sensors Theory, Design, and Physico-Chemical Applications, Academic Press, San Diego, 1997.
BestSense AG: Bearing Surveillance & Test, http://www.bestsens. de/(last access: 18 December 2012), 2013.
Calabrese, G. S., Wohltjen, H., and Roy, M. K.: Surface acoustic wave devices as chemical sensors in liquids. Evidence disputing the importance of Rayleigh wave propagation, Anal. Chem., 59, 833–837, 1987.
Flemming, H. C.: Role and levels of real-time monitoring for suc-cessful anti-fouling strategies – an overview, Water Sci. Technol., 47, 1–8, 2003.
Lindner, G., Schmitt, M., Schmidt, K., Faustmann, H., Krempel, S., and Schubert, J.: Detection of coatings and measurement of coating thickness on technical substrates using surface acoustic waves in a waveguide configuration, Proc. Sensor+Test Confer-ence SENSOR, 35–40, 2009.
Lohr, K. R. and Rose, J. L.: Ultrasonic guided wave and acoustic impact methods for pipe fouling detection, J. Food Eng., 56, 315– 324, 2003.
Lowe, M. J. S.: Matrix Techniques for Modeling Ultrasonic Waves in Multilayered Media, IEEE Trans. Ultrason. Ferroelectr. Freq. Control, 42, 525–542, 1995.
Monkhouse, R. S. C., Wilcox, P. D., and Cawley, P.: Flexible inter-digital PVDF transducers for the generation of Lamb waves in structures, Ultrasonics, 35, 489–498, 1997.
Morgan, D.: Surface Acoustic Wave Filters, Elsevier, Amsterdam, 2007.
Pitts, L. E., Plona, T. J., and Mayer, W. G.: Theory of Nonspecular Reflection Effects for an Ultrasonic Beam Incident on a Solid Plate in a Liquid, IEEE Trans. Sonics Ultrason., SU-24, 101– 109, 1977.
Rautenberg, J., Bause, F., and Henning, B.: Guided Acoustic Waves for Liquid Property Measurement (in German), Tech. Mess., 79, 135–142, 2012.
and Reindl, L. M.: Multi Reflection of Lamb Wave Emission in an Acoustic Waveguide Sensor, Sensors, 13, 2777–2785, 2013. Schoch, A.: Lateral displacement of total reflected ultrasound
waves, Acoustica, 2, 18–19, 1952 (in German).
Settles, G. S.: Schlieren and Shadowgraph Techniques, Springer, Berlin, 2001.
Thompson, M. and Stone, D. C.: Surface-Launched Acoustic Wave Sensor of Chemical Analysis, John Wiley & Sons, Inc., New York, 1997.
Unverzagt, C., Olfert, S., and Henning, B.: A new method of spa-tial filtering for Schlieren visualization of ultrasound wave fields, Phys. Procedia, 3, 935–942, 2010.
Viktorov, I. A.: Rayleigh and Lamb Waves, physical theory and ap-plications, Academic Press, New York, 1967.
White, R. M.: Surface Elastic Waves, Proceedings of the IEEE, 58, 1238–1276, 1970.
Wilkens, V. and Molkenstruck, W.: Broadband PVDF Membrane Hydrophone for Comparisons of Hydrophone Calibration Meth-ods up to 140 MHz, IEEE Trans. Ultrason. Ferroelectr. Freq. Control, 54, 1784–1791, 2007.