© 2014 Z.Z. Abidin et al., This open access article is distributed under a Creative Commons Attribution (CC-BY) 3.0 license
doi:10.3844/ajassp.2014.1104.1112 Published Online 11 (7) 2014 (http://www.thescipub.com/ajas.toc)
Corresponding Author: Abidin, Z.Z., Department of Chemical and Environmental Engineering, Faculty of Engineering, Universiti Putra Malaysia, 43400 Serdang, Selangor, Malaysia
DIELECTRIC CHARACTERIZATION
OF LIQUID CONTAINING LOW ALCOHOLIC
CONTENT FOR POTENTIAL HALAL
AUTHENTICATION IN THE 0.5-50 GHz RANGE
1,2
Zurina Zainal Abidin,
1Fatin Nordalila Omar,
1Pavithiran Yogarajah,
1,2
Dayang Radiah Awang Biak and
3Yaakob Bin Che Man
1
Department of Chemical and Environmental Engineering, Faculty of Engineering 2
Institute of Technology and Advanced Materials (ITMA), 3
Halal Product Research Institute (HPRI),
Universiti Putra Malaysia, 43400 Serdang, Selangor, Malaysia
Received 2013-07-11; Revised 2013-09-26; Accepted 2014-04-24
ABSTRACT
A potential method for detection and discrimination of alcoholic containing drinks for halal authentication using dielectric properties has been investigated. Behaviors of several pure alcohols, alcohol solution in water and also liquids with alcoholic contents were studied for verification purpose. Dielectric constant and dielectric loss factor for low concentration of ethanol solutions were measured over the microwave frequency from 0.5 to 50 GHz. The measurements were extended to several commercial alcoholic beverages. The results showed that dielectric properties manage to discriminate alcohol content until the lowest concentration studied of 0.5% in water mixture at frequency range of 10-25 GHz. Beyond this limit, solution is considered as alcoholic drinks.
Keywords: Dielectric, Halal Authentication, Alcohol
1. INTRODUCTION
Identification and discrimination of halal and non-halal products has become increasingly important especially to the Muslim communities and has become very challenging nowadays due to the unavailability of robust and rapid methods to detect halal products. This issue is further worsened by misleading information from the supplier, adulteration, mislabelling, characterization and also a general lack of individual awareness regarding this matter. Non-halal foods and drinks refer to illicit goods including pork and all its products, improperly slaughtered animals, alcoholic drinks (including all forms of intoxicants), blood and any food or drink contaminated with any of these products. The halal issues are not only limited to food and beverages but also cover non-food products such as
cosmetics, toiletries, pharmaceuticals, medicine and leather. To some extent, the integrity of the halal status of a product depends very much on the technology that supported the halal authentication.
amount of DNA is present. HPLC based on amino acid analysis is sometimes not enough to determine the source of proteins. Furthermore, all these methods are generally lab-based and time consuming. The need to develop a better and rapid real-time detection method is imperative to assist the halal industry and community as a whole.
One of the potential methods to facilitate this ongoing research is the use of electromagnetic radiation in the microwave range on food. Recently, microwave is used for preparing, cooking, thawing and packaging food (Giese, 1992). Microwave spectroscopy is a very attractive and powerful method for characterising food and some of its components in a non-invasive way. The interaction between the materials with electromagnetic energy in the microwave range provides information known as dielectric properties of the material which consists of the dielectric constant and dielectric loss (Tanaka et al., 2008). A comprehensive overview of dielectric properties at microwave frequencies for a wide variety of foods has been reported by many researchers. Dielectric properties have been utilised to characterize food quality such as water content in food (Clerjon et al., 2003) sugar content in yoghurt (Bohigas et al., 2008) the concentration of acetic acid (Bohigas and Tejada, 2009) grape juice and wine quality (Garcia et al., 2004), soy sauce (Tanaka et al., 2005) and also salt content of butter (Shiinoki et al., 1998). This dielectric measurement and technique provides a simple, rapid, reliable and also non-laborious alternative compared to current lab-based existing methods such as FTIR and PCR. The use of this dielectric measurement could significantly reduce the analysis time required for the determination of a material’s halal status and also assist to more efficient and reliable decision making processes.
The aim of this study was to establish the suitability of using dielectric properties for the potentially rapid insitu determination of halal and non-halal products for frequency range 0.5-50 GHz at low alcoholic concentration 10 to 0.1%. The objectives of this study were mainly to characterize the dielectric response of liquid containing alcohol and alcoholic beverages samples and to study the dielectric response with respect to the Debye model.
2. MATERIALS AND METHODS
2.1. Instrument
and
Dielectric
Properties
Measurement
The complex permittivity measurements were performed with instrument of Agilent PNA-X Microwave Network Analyzer N5245A which offers range of frequency 10 to 50 GHz. Open-ended probe
technique was used with a coaxial probe and software. Both of them are included in the Agilent 85070E dielectric probe kit. The slim form probe is best used for liquids and soft semi-solids and also allowed with smaller sample sizes. There is no need for an external computer as software can be installed directly in the analyzer. All measurements were carried out in the 500 to 50 GHz frequency range at room temperature (20-22°C). Before starting the measurement, calibration at the tip of the probe must be performed well in order to remove the systematic (repeatable) errors from the measurement. The three well-known standards air, a short circuit and distilled water were measured with the automated Electronic Calibration Module (Agilent N4693A). It calibrates the system automatically, in seconds, just before each measurement was made.
The liquid samples were placed in small beaker (50 ml) and the surface of the samples was attached to the slim probe to measure the dielectric constant and loss factor. The air bubbles on the tip of the slim probe should be eliminated before any measurement to avoid inaccuracy of the results. The microwave signal launched by PNA-X was reflected by the sample. The receiver detects the reflected and transmitted signals from the material by tuning to that frequency. The measurement was repeated as the source stepped to another frequency and the measured response produces phase and magnitude data for range of frequency tested.
2.2. Samples and Preparation
Four types of pure alcohol samples namely methanol, ethanol, propanol and butanol with concentration >99% were purchased from local supplier. The measurements were first done on all types of alcohols. Next, ethanol was selected for studying the effect of concentration due to its commonness usage. Ethanol was diluted with distilled water to make alcoholic mixtures with concentrations ranging from 10 to 0.1%. Several commercially available alcoholic beer were also purchased from a local supermarket for measuring their dielectric properties. All these drinks were used as purchased for experimental work. Details of all the samples and products studied were listed as in Table 1.
2.3. Theory
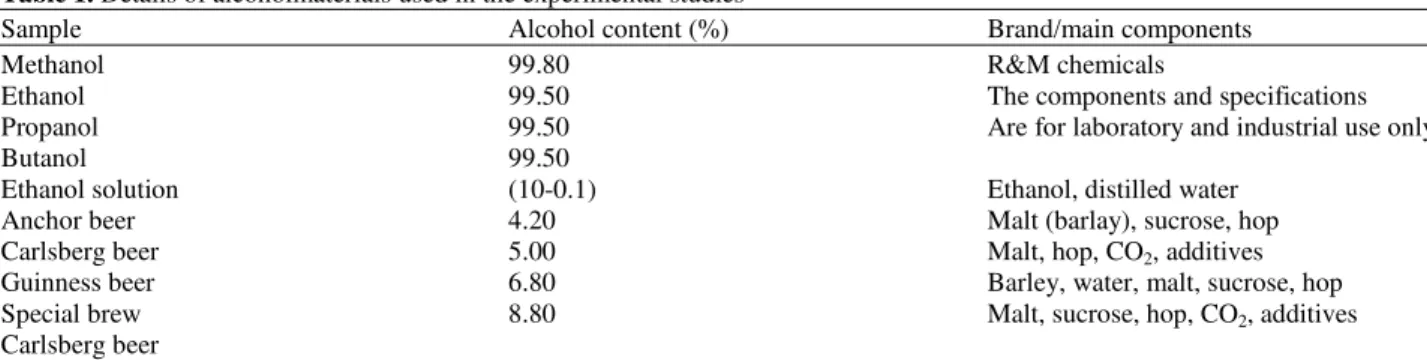
Table 1. Details of alcoholmaterials used in the experimental studies
Sample Alcohol content (%) Brand/main components
Methanol 99.80 R&M chemicals
Ethanol 99.50 The components and specifications
Propanol 99.50 Are for laboratory and industrial use only.
Butanol 99.50
Ethanol solution (10-0.1) Ethanol, distilled water
Anchor beer 4.20 Malt (barlay), sucrose, hop
Carlsberg beer 5.00 Malt, hop, CO2, additives
Guinness beer 6.80 Barley, water, malt, sucrose, hop
Special brew 8.80 Malt, sucrose, hop, CO2, additives
Carlsberg beer
Generally, the choice of theory or analysis depends on the type of material used and several parameters involved like frequency, temperature or/and moisture content. Often Debye relationship fits well with pure liquids which contain polar molecules such as pure alcohols and water (Decareau, 1985). The polar dispersion for this type of solvent dominates the frequency characteristics of the dielectric properties and hence its general frequency-dependent behaviour is described reasonable well by using Debye model (Decareau, 1985).
Debye relation of dielectric permittivity, ε*, consists
of two important parts which are real and imaginary (Frohlich, 1958) or otherwise known as the dielectric constant ε’ and the dielectric loss factor ε” respectively.
Generally, permittivity in The International System of Units (SI units) is measured in farads per meter (F/m). The Debye equation may be written in various forms, which have special merits for the evaluation of experimental characteristics. The response of a material to electromagnetic radiation is related to its electrical permittivity which can be represented by Equation 1, where ε’ and ε” are given by Equation 2 and 3 (Von
Hippel, 1954):
* ’ j ”
ε = ε − ε (1)
( )
2 2S
’ ’∞ [( ’ ’ ) / (1∞ )]
ε ω = ε + ε − ε + ω τ (2)
( )
2 2S
” ( ’ ’ ) (∞ ) / (1 )
ε ω = ε − ε ωτ + ω τ (3)
] [
2 2S 0
”( ) [( ’ ’ ) (∞ ) / (1 ) / ]
ε ω = ε − ε ωτ + ω τ + σ ωε (4)
Where: j = (-1)½,
ω = Angular frequency which ω = 2πƒ,
ε’∞ = The real permittivity at very high frequency
ε’S = Known as the real static permittivity τ = The relaxation time
fR = The relaxation frequency
Relaxation time is a measure of the molecules (dipole) mobility that exists in a material. Idealized relationship of frequency of dielectric properties of pure polar materials based on Debye model is described elsewhere (Debye, 1929).
In some cases, Equation 4 is used to calculate the dielectric loss factor. Equation 4 takes into account of the energy loss due to ionic conduction and is frequency-dependence. This is applicable to situations when the liquid is of a dipolar nature and involve with free ions. It is believed to be suitable for calculating the dielectric loss factor for alcoholic beverages products (Von Hippel, 1995; Bohigas and Tejada, 2009) since the presence of foreign substances such as sucrose and additives would disrupt permittivity behaviour. Solution conductivity σ was measured experimentally
in the laboratory, while ε₀ is the permittivity of free space with a value of ≈ 8.854×10⁻¹² F/m.
3. RESULTS
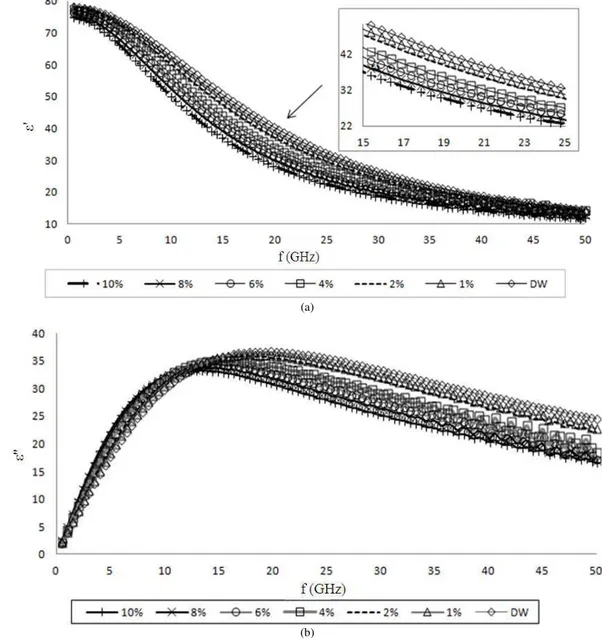
permittivity in Fig. 1a decreased with increasing concentration and frequency. The imaginary part in
Fig. 1b meanwhile increased with increasing
concentration and frequency until it reached a maximum at frequency fR (relaxation frequency). Then the imaginary part decreased slowly until 50 GHz.
Fig. 2a shows the spectra of dielectric constant for ethanol solutions with concentrations of 0.8, 0.6, 0.5 and 0.1%. The inset figures in 2b and 2c show the reduced scale of lower frequency at 9-11 GHz and higher frequency of 45-50 GHz respectively. Meanwhile, Fig. 3
presents the loss factor or imaginary permittivity spectra of ethanol solutions tested for similar concentrations.
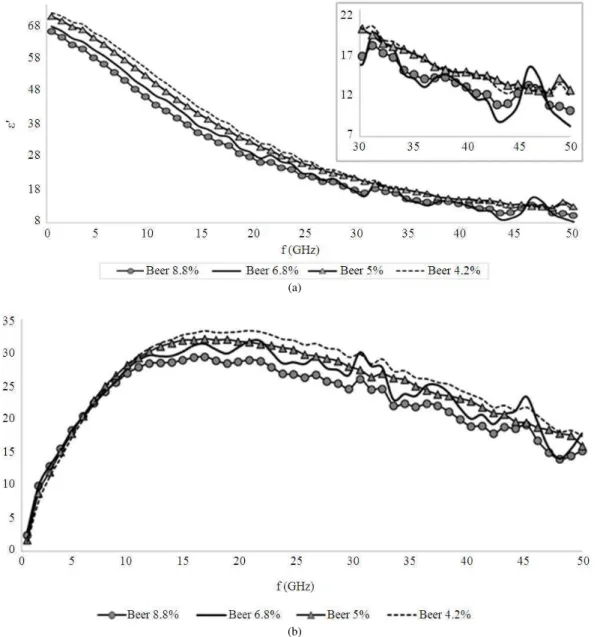
The measured permittivity for both dielectric constant and dielectric loss factor of four different alcohol content of beers are illustrated in Fig. 4a and b. The dielectric properties and compositions of beer are mainly dependent on its ingredients, flavor and alcohol content. In beverages, normally the concentration stated as the percentage of alcohol by volume or abbreviated as ABV. This is a standard measure of alcohol (mainly ethanol) content in an alcoholic beverage.
(a)
(b)
Fig. 2. (a) Real permittivity spectra of ethanol solutions tested for lowest concentrations (0.9-0.1%) over the frequency range from 0.5-50 GHz, (b) the reduced scale of lower frequency 9-11 GHz and (c) higher frequency of 45-50 GHz
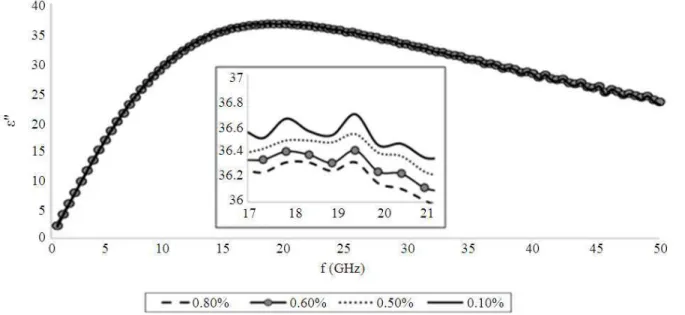
Fig. 3. Imaginary permittivity spectra of ethanol solutions tested for lowest concentrations (0.9-0.1%)
In Fig. 4, the dielectric permittivity of four types of commercial beer with alcohol content of 8.8, 6.8, 5.0 and 4.2% were measured by dielectric. The dielectric constant of beer samples decreased with increasing frequency up to 50 GHz while the dielectric loss factor increased to a maximum ε” around 16-21 GHz, then
decreased until final frequency tested.
4. DISCUSSION
4.1. Ethanol Solutions
Both dielectric constant and loss factor in Fig. 1
effects on the water molecule more compared to alcohol molecule.It is believed that the presence of alcohol compound reduce the water permittivity since lesser free ions are available for ionic polarization (Rao et al., 2005).
At low frequencies in Fig. 2b, the dielectric permittivity decreased with increasing concentration and frequency uniformly without any fluctuation. This results indicate that dielectric properties of alcohol can be detected and differentiate to water until the lowest
concentration of 0.1%. Fig. 2c shows that at higher microwave frequency of 45-50 GHz, the trend of spectra tend to have fluctuation values. Similar to Fig. 3, at higher frequency starting at approximately 40.1 GHz, the fluctuation of wave can be observed and the loss factor values for all concentrations become lower as it explains the less dissipation into heat and would lead to a weaker interaction with the microwave field. With increasing alcohol concentration, there is an increasing in the amplitude of the dispersion and relaxa- tion time.
(a)
(b)
The inset in Fig. 3 shows clearly the relaxation frequency of ethanol solution for lowest concentration which 0.9% has fR of 17.83 GHz and the rest sharing similar fR value, 19.31 GHz. According to Debye equation in Equation 2 and 3, it was noted that the real static of dielectric constant (ε’s), dielectric constant
permittivity at high frequency (ε’∞) and (ε’s-ε’∞)
values decreased with increasing percentage of ethanol concentration. The relaxation time (τ)
meanwhile became longer for ethanol concentration in the range of 10-0.1%. This is supported by previous work (Mashimo et al., 1991) which reported that the wavelength of frequency for mixture of water-alcohol increased when there is more water in a mixture.
In some countries especially Islamic countries, the production of intoxicating drink are considered as non-halal for consumption according to alcohol content limits or standards specified. For instance in Malaysia, the Department of Islamic Development or otherwise known as JAKIM sets a limit of 0.5% of alcohol content in a drink for which if it exceeds this limit, a drink is considered to be non-halal. The experimental results in
Fig. 2 and 3 highly reflected the ability of dielectric machines to give a reliable signal for detecting ethanol concentration as low as 0.1% particularly within frequency range of 10-25 GHz. This in turn suggests the effectiveness of using this method and hence its viability to become a potential tools for assisting halal authentication procedures. Moreover, dielectric properties method is more rapid and practical to be used on site compared to existing lab-based procedures.
4.2 Alcoholic Beverages
The fluctuation behavior in Fig. 4 was similar like the results for low alcoholic content (<1%) as in Fig. 2a. However, in this case, the fluctuation especially for beer 6.8 and 8.8% is due to the presence of additive and sugar in the alcoholic beverage that disturb the stability of the solution. Besides, the presence of volatile and semi-volatile compounds will contribute to polarization effects in alcohol molecules.
Many substances or molecules in the food especially liquid water absorb energy from microwaves field in s process called dielectric heating since the water itself are electric dipoles. However, microwave heating is less efficient if the water contains foreign substances such as sugars and alcohol compound. These addition substances have smaller dipole moment than on pure water. Sugars, for example absorb microwaves due to the dipole moment of their hydroxyl groups. These facts explained
the difference of permittivity values between alcoholic beverages and other alcohol solutions.
The formation of ion complexes in solution is an example of relaxation mechanism. This phenomenon explains the factor of chemical kinetics and molecular dynamics could act as an influence on the resulting relaxation time (Kaatze, 1995). The relaxation time, τ of
the four type beers gave different values as it is strongly dependent upon the composition and the solution environment. Beer 8.8 and 5.0% have biggest value of τ
around 9.74 ps (in picoseconds) that may be attributed to the presence of additives (such as peptides from malt, amylase enzyme and fining agents) in the solutions that lengthen the relaxation time of the dipoles under the given conditions. Besides, when associated with Debye model, this statement obviously indicates the function of Equation 4, which the involvement of conductivity factor shows the loss of energy are contributed by ionic conduction.
Furthermore, the results obtained here are similar to work done on other alcoholic beverages like dielectric measurement for grape juice (Garcia et al., 2004) at low frequency (0.2-3 GHz) and also vinegars at high frequency up to 20 GHz (Bohigas and Tejada, 2009). According to all results in this study, a good separation of graph in each ethanol/alcohol concentrations was found in frequency range of 10-25 GHz. Thus, it is strongly suggest the suitability of using dielectric measurement to discriminate alcoholic and non-alcoholic drinks especially in higher frequency than 20 GHz.
5. CONCLUSION
The dielectric response of water containing alcohol and alcoholic beverages were measured up to frequency 50 GHz. The experimental data have been found to fit well with the proposed technique for halal authentication. Even though many works on the dielectric properties of alcohol have been done before, none of them have linked this technique for verification purpose of halal status at low concentration of alcohol content. The present study and discussion in this study work is important as the starting point of such an attempt in the field of halal food.
distinguish it from the non-alcoholic drinks. This method thus, has the potential to be tapped as a reliable tool to establish halal status of a product as it is very simple, fast and gives real-time signal, which can be obtained in-situ. A comprehensive database covering all available alcohol beverages should be compiled to serve as a guide or reference for any verification work related to alcohol carried out by dielectric method. This method can be utilized as a support and initial screening of a sample especially for deciding status of doubtful (syubhat) material before proceeding to details analysis using other time-consuming. Faster decision-making can be done to avoid further complication. Henceforth, more research must be done to consolidate of other molecules (additives), temperature, sugar contents, viscosity, moisture content and other interfering substance.
6. ACKNOWLEDGEMENT
The researchers would like to thank Universiti Putra Malaysia (UPM) for funding the work (05-05-10-1079RU), Halal Product Research Institute (HPRI) UPM and also Agilent for the PNA machine.
7. REFERENCES
Bohigas, X., R. Amigo and J. Tejada, 2008. Characterisation of sugar content in yogurt by means of microwave spectroscopy. Food Res. Int., 41: 104-109. DOI:10.1016/j.foodres.2007.10.005 Bohigas, X. and J. Tejada, 2009. Dielectric properties
of acetic acid and vinegar in the microwave frequencies range 1-20 GHz. J. Food Eng., 94: 46-51. DOI:10.1016/j.jfoodeng.2009.02.029
Che Man, Y.B., H.L. Gan, I. Noraini, S.A.H. Nazimah and C.P. Tan, 2005. Detection of lard adulteration in RBD palm olein using an electronic nose. Food
Chem. FOCH, 90: 829-835. DOI:
10.1016/j.foodchem.2004.05.062
Che Man, Y.B., A.A. Aida, A.R. Raha and R. Son, 2007. Identification of pork derivatives in food products by species-specific Polymerase Chain Reaction (PCR) for halal verification. Food
Control, 18: 85-889. DOI:
10.1016/j.foodcont.2006.05.004
Clerjon, S., J.D. Daudin and J.L. Damez. 2003. Water activity and dielectric properties of gels in the frequency range 20 MHz-6 GHz. Food Chem., 82: 87-97. DOI:10.1016/S0308-8146(02)00580-0
Debye, P., 1929. Polar Molecules. The Chemical Catalog, New York.
Decareau, R.V., 1985. Microwave in the food processing industry. Academic Press, Orlando. Frohlich, H., 1958. Theory of dielectrics; Dielectric
constant and dielectric loss factor. 2nd Edn., Oxford University Press, Claredon.
Garcia, A., J.L. Torres, M. De Blas, A. De Francisco and R. Illanes, 2004. Dielectric characteristics of grape juice and wine. Biosyst. Eng., 88: 343-349. DOI:10.1016/j.biosystemseng.2004.04.008 Giese, J.H., 1992. Hitting the spot: Beverages and
beverage technology. Food Technol., 46: 70-72. Kaatze, U., 1995. Microwave dielectric properties of
liquids, Radiat. Phys. Chem., 45: 549-566. DOI: 10.1016/0969-806X(94)00070-Z
Liu, Y., J. Tang and Z. Mao, 2009. Analysis of bread loss factor using modified Debye equations. J.
Food Eng., 93: 453-459. DOI:
10.1016/j.jfoodeng.2009.02.012
Marikkar, J.M.N., H.M. Ghazali, Y.B. Che Man and T.S.G. Peiris et al., 2005. Distinguishing lard from other animal fats in admixtures of some vegetable oils using liquid chromatographic data coupled with multivariate data analysis. Food
Chem., 91: 5-14. DOI:
10.1016/j.foodchem.2004.01.080
Mashimo, S., T. Umehara and H. Redlin, 1991. Structures of water and primary alcohol studied by microwave dielectric analyses. J. Chemical Phys., 95; 6257-6260. DOI:10.1063/1.461546 Murugaiah, C., Z.M. Noor, M. Mastakim, L. M.
Bilung and J. Selamat et al., 2009. Meat species identification and Halal authentication analysis using mitochondrial DNA. Meat Sci., 83: 57-61. DOI:10.1016/j.meatsci.2009.03.015
Nunes, A.C., X. Bohigas and Tejada, 2006. Dielectric study of milk for frequencies between 1 and 20GHz. J. Food Eng., 76: 250-255. DOI: 10.1016/j.jfoodeng.2005.04.049
Rao, M.A., S.S.H. Rizvi and A.K. Datta, 2005. Engineering Properties of Foods. 3rd Edn., Taylor and Francis Group, Boca Raton.
Syahariza, Z.A., Y.B. Che Man, J. Selamat and J. Bakar, 2005. Detection of lard adulteration in cake formulation by Fourier transform infrared (FTIR) spectroscopy. Food Chem., 92: 365-371. DOI:10.1016/j.foodchem.2004.10.039
Tanaka, F., K. Morita, P. Mallikarjunan, Y.C. Hung and G.O.I. Ezeike, 2005. Analysis of dielectric properties of soy sauce. J. Food Eng., 71: 92-97. DOI:10.1016/j.jfoodeng.2004.10.023
Tanaka, F., T. Uchino, D. Hamanaka, G.G. Atungulu and Y.C. Hung, 2008. Dielectric properties of mirin in the microwave frequency range. J. Food
Eng., 89: 435-440. DOI:
10.1016/j.jfoodeng.2008.05.029
Von Hippel, A., 1954. Dielectric and Waves. 1st Edn., John Wiley and Sons, Inc., Cambridge, Massachusetts.
Von Hippel, A., 1995. Dielectric Materials and Applications. 1st Edn., Artech House Publishers, London.
Xue, Q., 2001. Study on dielectric properties of oil/water random composites. J. Electrostat., 50: 169-175. DOI: 10.1016/S0304-3886(00)00034-6 Yomogida, Y. and R. Nozaki, 2009. Dielectric study
of acetophenone and its derivatives. J. Molecular
Liquids, 149: 101-104. DOI: