Original papers
STRUCTURAL AND DIELECTRIC STUDIES ON Sr0.5-3y/2LayBa0.5Nb2O6
CERAMIC SYSTEMS WITH VARIED SINTERING TIME
AND La CONCENTRATION
S. R ZAHARIMAN, #T. S. VELAYUTHAM *, W. H. ABD MAJID, MARDHIAH SAID, W. C. GAN Low Dimensional Materials Research Centre, Physics Department,
University of Malaya, 50603 Kuala Lumpur, Malaysia
#E-mail: [email protected]
Submitted August 2, 2013; accepted November 25, 2013
Keywords: Dielectric properties, Curie temperature, Microstructure, Density
Sr0.5Ba0.5Nb2O6 (SBN50) ceramic doped with different concentration of Lanthanum, La according to stoichiometric for-mulation of Sr0.5-3y/2LayBa0.5Nb2O6 (LSBN) with y = 0.01, 0.03, 0.05 and 0.07 prepared using traditional ceramic method at the calcination temperature of 1200°C and sintered at 1300°C at varied sintering time. The effects of the sintering time and La3+ substitution on the morphological, compositional, structural and electrical properties of the LSBN is presented using scanning electronic microscopy (SEM), energy dispersive spectroscopy (EDS), X-ray diffraction (XRD) and dielectric analysis. The XRD spectra conirm the presence of TTB structure in the ceramics. The Curie temperature (Tc) of the ceramic identiied from the dielectric studies performed in the temperature range of 28°C to 300°C. The temperature dependent dielectric exhibits broad peaks indicating a diffuse phase transition and relaxor behavior of the ceramic. The measured density of the samples is proportional to the sintering time and inversely proportional to the amount of the La3+ substitution. The solubility limit of La3+ ions in the SBN solid solution is at y ~ 0.05. This observation is also supported by the dielectric results where the dielectric properties of the ceramic deteriorate for y > 0.05 La substitution.
INTRODUCTION
Strontium barium niobate, SrxBa1-xNb2O6 (SBN)
is one of the lead-free ferroelectric oxides which have attracted an increasing attention due to its large piezo-electric properties, high electro-optic coeficients and dielectric constant [1]. SBN is a typical relaxor system [2, 3] belonging to the tetragonal tungsten bronze (TTB) ferroelectric oxide family, AB2O6. The compositional
and structural properties of this ceramic can be modiied by adding a small amount of rare earth element (RE). Modifying the ceramic sometimes favors a higher reac-tivity of the grain and the densiication rate while in some cases increase the grain size [4-7].
Literatures reported that doping of certain RE ma-terials into SBN improved the pyroelectric and dielec-tric properties at room temperature [8]. Moreover, Curie temperature, Tc of the SBN doped with RE decreased
tremendously from above 300°C to room temperature [9]. Although the effects of doping on the dielectric properties of SBN have been widely investigated [10] but an agreement on the effect of doping La on the Tcof SBN is not reached. The disorder crystal of SBN which has the random occupation of A1 and A2 sites inluenced
the ferroelectric properties and phase transition. Only
Sr2+ cations occupy A
1 sites while the A2 sites occupied
by Sr2+ and Ba2+ cations. The ratio of Sr/Ba concentration
at the A2 site is very important and when La3+ cations is
doped to a system of constant Sr/Ba ratio, its properties will highly inluenced by the dopant [10, 11]. The SBN properties are greatly affected by the type, amount of substitution, preparation methods and the condition of sintering [12]. In solid state reaction, the calcinations of powders were performed purposely to obtain a single phase and then preceded to sintering for densiication [12]. Sintering has three predominant stages that are initial, intermediate, and inal stages. However, only the inal stages are investigated which mainly focused on the densiication and the size of crystal grain where maximum values are desired [8].
EXPERIMENTAL
The SBN and LSBN ceramics samples were ob-tained using conventional solid-state reaction method. The compounds were prepared by mixing high purity of SrCO3, BaCO3, Nb2O5 and La2O3 in stoichiometric
quantities in agate mortar for 20 minutes. The mixed powders were calcined at 1200°C with ramp rate of 5°C for 5 hours to obtain single phase structure. The resulting powders were uniaxially die pressed at (400 ± 20) bar of pressure into disks with a diameter of (13.00 ± 0.01) mm and thickness of (1.50 ± 0.01) mm. Then, the samples were sintered at 6 h, 12 h, and 24 h at 1300°C. In order to study the inluence of La concent-ration towards the properties of SBN, an appropriate amount of mixtures according to stoichiometric formula Sr0.5-3y/2LayBa0.5Nb2O6 with y = 0, 0.01, 0.03, 0.05 and
0.07 were prepared and denoted as SBN50 or LSBN0, LSBN1, LSBN3, LSBN5 and LSBN7 respectively. The samples were sintered at 1300°C for 6 hours. As for electrical measurement, aluminium electrode was ther-mally evaporated on both sides of the samples. XRD measurements were performed to identify the crystallite size, D using Scherer’s equation as shown in Equation 1.
(1)
where k = 0.9, λ = 1.541 Å, θ is the diffraction peak angle and β is the full width at half maximum of the corresponding diffraction peak.
Density of the samples was obtained by measuring their volume and weight after sintering process. Morpho-logy and the grain size of the samples were investiga-ted by Field Emission Scanning Electron Microscope (FESEM). The dielectric permittivity of the samples was investigated using HP 4294A Impedance Gain Analyzer. The temperature of the samples was varied from 30°C to 300°C using hot chuck which was controlled by STC200 temperature controller.
RESULTS AND DISCUSSIONS
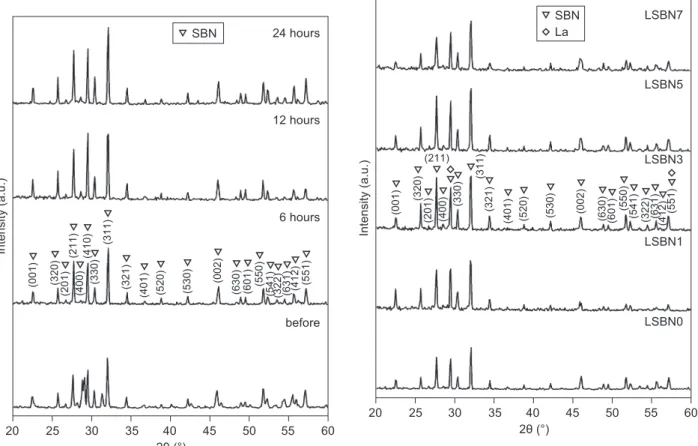
The X-ray diffraction patterns of SBN50 ceramic before and after sintering with various sintering time 6 h, 12 h, and 24 h are shown in Figure 1. Basically, from Figure 1, it is observed that there is no shift in the relection angles as the sintering time is increased which indicates that single phase (belonging to the SBN phase) is obtained for all the sintering time. The peaks became sharper and the full width at half maximum (FWHM) decreased as the sintering is increased indicating better crystallinity for samples sintered at longer time. More-over, the increased intensity of (311) peak (SBN phase) with the increased sintering time, indicating that for-mation of pure TTB structure of SBN dependence on the sintering time. Normally, the undesired SrNb2O6 (SN)
phase identiied at 2θ = 29.1 while BaNb2O6 (BN)
pha-ses observed at two characteristic peaks; 2θ = 28.4° and
Figure 2. XRD patterns for SBN50 doped with different con-centration of Lanthanum.
Figure 1. XRD patterns for SBN50 at different sintering time.
20 25 30 40 60
(0
0
1
)
35 45 50 55
2θ (°) SBN La LSBN5 LSBN7 LSBN3 LSBN1 LSBN0 In te n s it y ( a .u .) (3 2 0 ) (2 0 1 ) (211) (4 0 0 ) (3 3 0 ) (3 1 1 ) (3 2 1 ) (4 0 1 ) (5 2 0 ) (5 3 0 ) (0 0 2 ) (6 3 0 ) (6 0 1 ) (5 5 0 ) (5 4 1 ) (3 2 2 ) (6 3 1 ) (4 1 2 ) (5 5 1 )
20 25 30 40 60
(0
0
1
)
35 45 50 55
2θ (°) SBN
2θ = 29.8°. Interestingly, in all sintering time, the unde- sired SN and BN phases had disappeared as it is com-bined to form TTB structure of SBN.
Figure 2 shows the XRD patterns of SBN50 (LSBN0), LSBN1, LSBN3, LSBN5 and LSBN7. It is observed that there is a small shifting of relection angle as the concentration of La doped varied. Normally, La has a strong peak at 2θ = 27.59° and 57.2°. From the spectra, it is observed that the presence of La phase coincide with the TTB structure of SBN at 2θ = 27.59° and 57.2° peaks. In fact these peaks became sharper and the FWHM is decreased which indicates the enhancement in the crystallinity for samples doped with 1 - 5 % of La. However, the intensity (crystallinity) of the peaks decreased signiicantly at 7 % substitution of La.
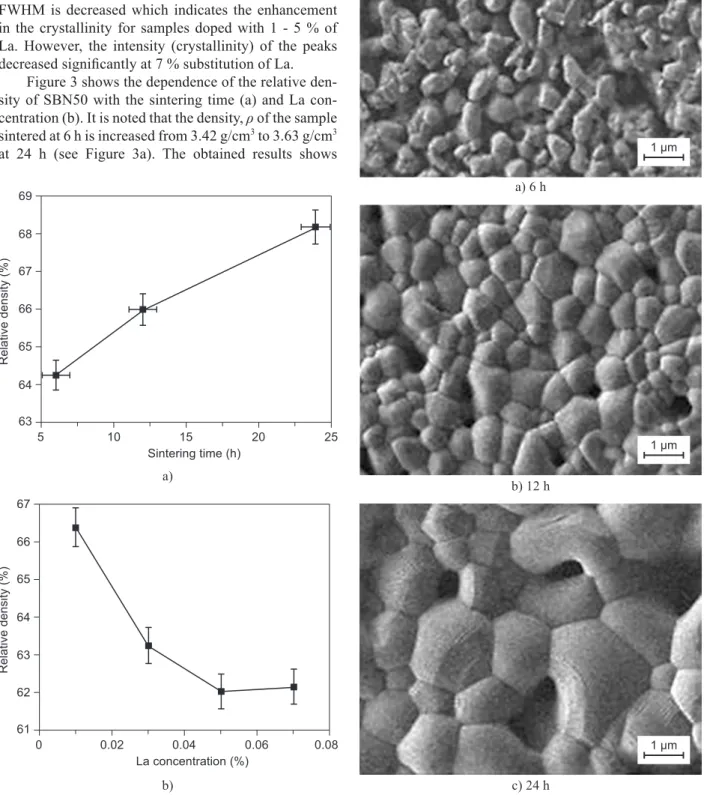
Figure 3 shows the dependence of the relative den-sity of SBN50 with the sintering time (a) and La con-centration (b). It is noted that the density, ρ of the sample sintered at 6 h is increased from 3.42 g/cm3 to 3.63 g/cm3
at 24 h (see Figure 3a). The obtained results shows
that the density is increased with the sintering time as predicted by the Coble’s model [13]. The increase in density is due to the increase in the grain size of the samples during sintering process.
Figure 3. The dependence of the relative density of SBN50
with (a) sintering time (b) La concentration. Figure 4. FESEM micrographs of SBN50 sintered at 1300°C for a) 6 h, b)12 h, c) 24 h. b)
a)
a) 6 h
b) 12 h
c) 24 h
0 0.02 0.04 0.06 0.08
La concentration (%)
R
e
la
ti
v
e
d
e
n
s
it
y
(
%
)
61 63 65 67
62 64 66
5 10 15 20 25
Sintering time (h)
R
e
la
ti
v
e
d
e
n
s
it
y
(
%
)
63 65 67 69
64 66 68
1 µm
1 µm
Microstructure observation (see Figure 4) conir-med that the porosity of the grains decreased when the sintering time increased where the grains became closer. As a result, the movement of ions was restricted to each other. The average grain sizes measured for each samples are (1.17 ± 0.06) µm, (1.36 ± 0.03) µm and (3.86 ± 0.08) µm for 6 h, 12 h and 24 h respectively and these values are acceptable as it is in the range (1 - 3 µm) as reported in the literature [14]. The densiication rates which are calculated over different time intervals from the gradient of the graph, decreased from 0.015 (from 6 h to 12 h) to 0.010 (12 h to 24 h). This indicates that the rate of densiication of the material is inversely proportional to the sintering time. Coble assumed that the dρ/dt is directly proportional to the diffusion coeficient, D [13]. Thus, it is reasonable to state that the diffusion process decreased with the increase of sintering time as observed from the results obtained here.
The relative density decreased when the concent-ration of La increased (1 - 5 %) (refer to Figure 3b). This is contrasting behavior with the previous observations
on PLZT [15] where the density increases with the con-centration of La. The decrease of the density may be ex-plained because the vacancies introduced by doping are bound to the impurity ions and unable to move freely through the crystal to expedite mass transfer. These bound vacancies reduce the concentration of the unbound vacancies and retard the diffusion [16]. The micro-structure shown in Figure 5, shows that the grains of the samples increase with the increase of La concentration from 1 - 5 % then signiicantly decrease as 7 % of La is doped. The result is parallel to the decrease of the relative density as shown in Figure 3b.
Figure 6 and Table 1 shows the comparison of the EDX composition analysis for LSBN1 and LSBN3. 0.17 % atomic percentage of La in LSBN1 is observed compared to LSBN3 that is 0.43 %. The small difference of the atomic value of Sr and Ba indicates that the dis-tribution of the mixture is saturated.
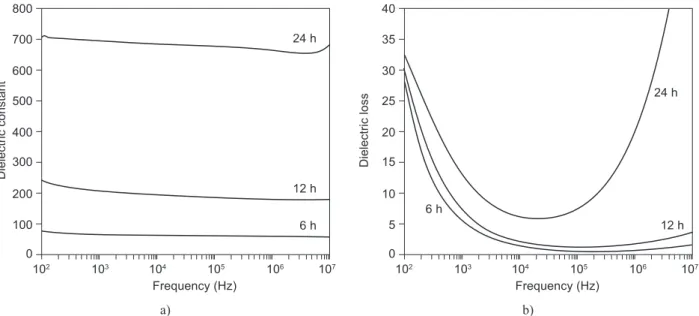
The frequency dependence of dielectric constant and loss for 6 h, 12 h and 24 h sintering time of SBN50 is shown in Figure 7. It is observed that both dielectric
Figure 5. FESEM micrographs of LSBN ceramic; a) LSBN1, b) LSBN3, c) LSBN5, d) LSBN7. a) LSBN1
c) LSBN5
b) LSBN3
d) LSBN7 1 µm
1 µm
1 µm
constant and loss increase with the increase of the sin-tering time. For example at room temperature, the dielec-tric constant (at 100 Hz) increased from 78.03 for 6 h to 685.47 for 24 h. However, the increase of dielectric constant and loss with the sintering time is not desired for pyroelectric application because the igure of merit, Fv will be affected by both values as shown in Equation 2. The Fv can be calculated by :
(2)
where Г, ε and tan δ represent the pyroelectric coeficient, dielectric constant, and dielectric loss respectively. Since Fv is inversely proportional to ε and tan δ, the sample sintered at 6 h is predicted to give highest Fv compared to the one sintered at 24 h.
The temperature dependence of dielectric constant and loss for SBN50 at different sintering times measured at 100 kHz is displayed in Figure 8. At 24 h sintering time, a maximum dielectric constant is observed at 149°C which is the Curie temperature, Tc. It is noted that Tcis not observedfor 6 h and 12 h as they seem to be larger than 300°C. Besides, the value of the dielectric constant is greatly inluenced by the temperature and the grain size.
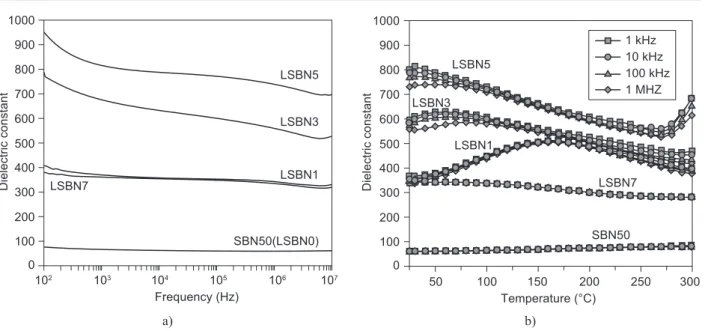
The frequency and temperature dependence of the dielectric constant for La doped SBN from are shown in Figure 9a and b respectively. As the concentration of the La increased the dielectric constant increased except for 7 % (see Figure 9a). In fact, at 7 % doped La, the dielectric constant signiicantly decreased to lower than 1 % La doped dielectric constant value. The observation matches well with the XRD pattern where the intensity of the spectra decreased indicating the crystallinity of the 7 % La doped ceramic decreased. The solubility limit of La3+ in the SBN solid solution seems to be at ~ 5 % La
doped. The additions of La which exceed the solubility
Table 1. Weight and atomic percentages for LSBN1 and LSBN3 based on EDX composition analysis.
LSBN1 LSBN3 Weight Atomic Weight Atomic
Element (%) (%) (%) (%)
C 7.17 19.45 5.82 17.28
O 29.28 59.63 26.29 58.62
Sr 9.26 3.44 8.29 3.37
Nb 40.49 14.20 42.30 16.24
Ba 13.07 3.10 15.63 4.06
La 0.74 0.17 1.67 0.43
Figure 6. FESEM micrographs of LSBN ceramic (a) LSBN1, (b) LSBN3, (c) LSBN5, (d) LSBN7. c)
a)
d) b)
0 1 2 3 4 5 6 7
keV
Spectrum 1
C O
La
La La
La
La LaLa La Sr
SrNb
Nb Nb
Ba Ba
Ba BaBaBa
0 1 2 3 4 5 6 7
keV
Spectrum 1
C O
La
La La
La
La LaLa La Sr
SrNb
Nb Nb
Ba Ba
Ba Ba BaBa
10 µm 10 µm
δ
εtan
Γ =
V
limit deteriorate the dielectric and structural properties of the sample [11]. As for temperature dependence di-electric constant spectra (Figure 9b), a broad transition from RT to 300°C is observed in all cases except LSBN0 and LSBN7. This is a typical behavior for ferroelectric materials with diffuse phase transition. The existence of polar micro regions above the nominal transition temperature provokes the diffuse phase transition mainly because of composition and local polarization [17]. Besides, Tc for 1 % and 3 % doped La concentrations are identiied as 169°C and 50°C respectively. These values are lower than those reported earlier by other groups [10, 18] which is consider a very good improvement since the Tc is near to RT. As the La concentration is increased
to 5 %, it is observed that the Tcis lower than the room temperature since the spectra seems to increase at lower temperature below the measured range. However, as for 7 % of La there isn’t any trend that can be identiied as Tc.
CONCLUSION
The dielectric properties of SBN are inluenced by the sintering time and the ratio of Lanthanum doped. As the sintering time is longer, the dielectric constant and loss increase while the Curie temperature of SBN50 decrease. At 24 h sintering time, its Curie temperature decreases to 149°C. At 6 h of sintering time, the SBN
Figure 7. The frequency dependence of dielectric constant (a) and dielectric loss (b) measured at room temperature for various sintering time of SBN50.
Figure 8. Temperature dependence spectra of dielectric constant (a) and dielectric loss (b) measured at 100 kHz of varied sinte-ring time for SBN50.
a)
a)
b)
b)
102 103 104 105 106 107
Frequency (Hz)
24 h
12 h
6 h
D
ie
le
c
tr
ic
c
o
n
s
ta
n
t
0 200 400 800
100 300 500 600 700
50 100 150 200 250 300
Temperature (°C) Tc = 149 °C
24 h
12 h
6 h
D
ie
le
c
tr
ic
c
o
n
s
ta
n
t
0 400 800
200 600 1000 1200 1300
102 103 104 105 106 107
Frequency (Hz)
24 h
12 h 6 h
D
ie
le
c
tr
ic
l
o
s
s
0 10 20 40
5 15 25 30 35
50 100 150 200 250 300
Temperature (°C)
24 h
12 h 6 h
D
ie
le
c
tr
ic
l
o
s
s
0 10 20 40
shows a single phase XRD pattern and SN and BN phases disappear to combine and form TTB structure of SBN. In addition, at 6h sintering time, the ceramic exhibits the lowest dielectric constant and loss which therefore, can be a best pyroelectric detector since the Fv of the ceramic will be higher. The crystallinity of the sample increases with the sintering time and the concentration of Lanthanum doped. The density of SBN50 increase as the sintering time is longer due to the increase of the grain size but the densiication is inversely proportional to the sintering time. It is observed that the density of SBN50 is decreased as the ratio of Lanthanum doped is increased. As the concentration of Lanthanum doped is increased, the dielectric constant and loss increase while the Curie temperature, Tc decrease tremendously nearing to room temperature. It is noted that at 7 % of La doped, the crystallinity, grain size, dielectric constant and loss are degraded. This shows the existence of the solubility limit of the Lanthanum ions in the SBN solid solution.
Acknowledgement
This work is supported by University of Malaya through grant number: RG258-13AFR & RP007A-13AFR
REFERENCES
1. Hao X., Yang Y. F.: J. Mater. Sci. 42, 3276 (2007). 2. Liu S. T., Bhalla A. S.: Ferroelectrics 51, 47 (1983).
3. Smolenskii G. A., Isupov V. A., Ktitorov S. A., Trepakov V. A., Yushin N. K.: Russ. Phys. J. 22, 1 (1979).
4. Luna-Lopez J. A., Portelles J., Raymond O., Siqueiros J. M.: Mater. Chem. Phys. 118, 341 (2009).
5. Malyshkina O. V., Movchikova A. A., Pedko B. B., Boitsova K. N., Kiselev D. A., Kholkin A. L.: Ferroelectrics 373, 114 (2008).
6. Lehnen P., Dec J., Kleemann W., Woike T., Pankrath R.: Ferroelectrics 268, 113 (2002).
7. CaldiñO U., Molina P., Ramirez M. O., Jaque D., Bausa L. E., Zaldo C., Ivleva L., Bettinelli M., Solé J. G.: Ferroelectrics 363, 150 (2008).
8. Maciolek R. B., Liu S. T.: J. Electron. Mater. 4, 517 (1975). 9. Liu S. T., Maciolek R. B.: J. Electron. Mater. 4, 91 (1975). 10. Guerrero F., Portelles J. J., González I., Fundora A., Amorin
H., Siqueiros J. M., Machorro R.: Solid State Commun. 101, 463 (1997).
11. Amorín H., Portelles J., Guerrero F., Fundora A., Martínez E., Siqueiros J. M.: J. Mater. Sci. 35, 4607 (2000).
12. Kumar S. N., Kumar P., Agrawal D. K.: Ceram. Int. 38, 5243 (2012).
13. Coble R. L.: J. Appl. Phys. 32, 787 (1961).
14. Zhang J., Wang G., Gao F., Mao C., Cao F., Dong X.: Ceram. Int. 39, 1971 (2013).
15. El-Salam F. A., Tawik A., Eatah A. I.: Ferroelectrics 65, 131 (1985).
16. Guerrero F., Portelles J. J., Amoŕin H., Fundora A., Siqueiros J., Hirata G.: J. Eur. Ceram. Soc. 18, 745 (1998). 17. Cross L. E.: Ferroelectrics 76, 241 (1987).
18. Guerrero F., Amori´n H., Portelles J., Fundora A., Siqueiros J. s., Hirata G., Aguilera S.: Journal of Electroceramics 3, 377 (1999).
Figure 9. The frequency dependence of (a) dielectric constant measured at room temperature and (b) temperature dependence of dielectric constant at various frequency and concentration of La.
a) b)
102 103 104 105 106 107
Frequency (Hz)
LSBN5
LSBN3
LSBN1 LSBN7
SBN50(LSBN0)
D
ie
le
c
tr
ic
c
o
n
s
ta
n
t
0 200 400 1000
100 300 500 600 700 800 900
LSBN5
LSBN3
LSBN1
LSBN7
SBN50 1 kHz 10 kHz 100 kHz 1 MHZ
D
ie
le
c
tr
ic
c
o
n
s
ta
n
t
0 200 400 1000
100 300 500 600 700 800 900
50 100 150 200 250 300