www.nat-hazards-earth-syst-sci.net/10/2429/2010/ doi:10.5194/nhess-10-2429-2010
© Author(s) 2010. CC Attribution 3.0 License.
and Earth
System Sciences
Investigating annual and monthly trends in precipitation structure:
an overview across Portugal
M. I. P. de Lima1,3, S. C. P. Carvalho2,3, and J. L. M. P. de Lima2,3
1Department of Forest Resources, Coimbra College of Agriculture, Polytechnic Institute of Coimbra, Bencanta,
3040-316 Coimbra, Portugal
2Department of Civil Engineering, Faculty of Science and Technology, Campus II – University of Coimbra,
Rua Lu´ıs Reis Santos, 3030-788 Coimbra, Portugal
3IMAR – Marine and Environmental Research Centre, Department of Life Sciences, Faculty of Science and Technology,
University of Coimbra, 3004-517 Coimbra, Portugal
Received: 21 June 2010 – Revised: 25 September 2010 – Accepted: 10 October 2010 – Published: 30 November 2010
Abstract. This work investigates recent changes in precipitation patterns manifested in long annual and monthly precipitation time series recorded in Portugal. The dataset comprises records from 14 meteorological stations scattered over mainland Portugal and the Portuguese North Atlantic Islands of Madeira and Azores; some of the time series date back to the 19th century. The data were tested for trends using the Mann-Kendall non-parametric test and Sen’s non-parametric method, searching both for full monotonic trends over the record period and for partial trends. Results provide no evidence for rejecting the null hypothesis of no trend in annual precipitation, when a monotonic linear model was used. Nevertheless, the analyses of 50 years’ moving averages showed an increase over time, in the recent past, for many of the series in mainland Portugal and the Islands. For the longest time series this behaviour was preceded by a decrease over time. The analyses of partial trends in the time series suggested a sequence of alternately decreasing and increasing trends in annual and monthly precipitation, which are sometimes statistically significant. The trend changing points were identified.
1 Introduction
Variations in precipitation over daily, seasonal, annual, and decadal time-scales have an impact on water balances. Thus it is important to understand the recent changes in precipitation patterns as part of the long term behaviour of
Correspondence to:M. I. P. de Lima (iplima@esac.pt)
this process, e.g. to predict changes in other hydrological processes. For these studies, one limiting factor is the short length of many existing precipitation records and the spatial representativeness of the available data. Thus, the majority of the studies on this topic are based on relatively short time series, covering a few decades, over periods of about 40–50 years. Only a few studies report results for longer periods, essentially covering the 20th century as a whole. The fact that many studies may be reporting different results highlights the need for further insight into both empirical findings, based on point precipitation data analyses, and numerical models of climate change projection. Several studies of precipitation trends over the Mediterranean Basin and the Iberian Peninsula are reported in Lionello et al. (2006).
of precipitation in these archipelagos has been less studied than that in mainland Portugal. In particular, the problem of fluctuations in precipitation variability over time has not been fully explored yet for these islands.
The work reported herein investigates annual and monthly precipitation records that include the longest time series available for Portugal that we are aware of. The data are from 14 meteorological stations in mainland Portugal and in the Madeira and Azores island groups. The study focused on the presence of linear monotonic trends in the temporal structure of precipitation over the record period and over sub-periods (i.e. partial trends). Trends were examined using the Mann-Kendall non-parametric test and Sen’s non-parametric method. Partial trends were investigated using the method proposed by Tom´e and Miranda (2005), with a view to performing a piecewise linear fitting to climate data and to detecting the associated trend change points.
2 Study area and precipitation data
This work examines 14 long precipitation data sets from mainland Portugal and the Portuguese North Atlantic Archipelagos of Madeira and Azores. The data were obtained by the Institute of Meteorology (IM) and the Institute for Water (INAG), of Portugal, and have annual and monthly resolutions. Some of the time series date back to the 19th century, spanning periods that range between 88 and 145 years. The first records are from 1863. The location of the precipitation measuring sites is shown in Fig. 1 and Table 1: ten sites are in mainland Portugal and four are in the islands. Three sites are located in the Azores, specifically on the islands of Faial, Terceira and S. Miguel, and the fourth site is on Madeira Island. Table 1 also presents some descriptive statistics for the annual time series.
Mainland Portugal lies in the transitional region between the sub-tropical anticyclone and the sub-polar depression zones, between latitudes 36◦56′and 42◦09′N and longitudes 6◦10′ and 9◦34′W. The climatic variables exhibit strong north-south and west-east gradients, and precipitation also exhibits strong seasonal variability. The dominant climate in mainland Portugal is mild Mediterranean with a warm, dry summer period. These characteristics are more pronounced in the south. The climate is greatly influenced by the latitude, the orography and the proximity of the Atlantic Ocean (see e.g. Miranda et al., 2002).
The Madeira archipelago is situated in the North Atlantic Ocean, about 900 km from mainland Europe (Fig. 1). It is formed by two main islands of volcanic origin: Madeira (728 km2) and Porto Santo (42 km2). It is in the Atlantic subtropical belt under the direct influence of the Azores high pressure system. The geographical position of the Madeira archipelago is between parallels 30◦
01′
and 33◦ 07′
N and between longitudes 15◦
51′
and 17◦ 15′
W. The complex topography of Madeira Island and its small size play a crucial role in the local precipitation regime, which is marked by
high spatial variability (e.g. de Lima and de Lima, 2009). The winter months are quite wet, particularly at higher altitudes, and stormy and cloudy conditions may last for several days at a time.
The Azores archipelago is located in the North Atlantic ridge, between latitudes 36◦
45′
and 39◦ 43′
N and longitudes 24◦
45′
and 31◦ 17′
W. It comprises 9 islands of volcanic origin, in 3 groups: Western, Central and Eastern. The warm Gulf Stream and their latitudinal position affect the islands’ climatic conditions. For most of the year the Atlantic depressions track across the Azores islands. The precipitation is heavier and more frequent in winter. In late spring and summer the Azores region is under the influence of the Azores anticyclone (e.g. Santos et al., 2004; Miranda et al., 2006).
3 Methodology
This section gives a brief overview of the methods used in the data analyses. All the methods are extensively described in the literature so there is no need to go into their details here. Preliminary analyses of the precipitation time series included checking the data for gaps and clearly incorrect (i.e. anomalous) precipitation values. Then the data were statistically tested for normality using the Shapiro-Wilk test (e.g. Royston, 1982) and the Kolmogorov-Smirnov (e.g. Deheuvels, 1981) non-parametric tests. In the Kolmogorov-Smirnov test the p-value was computed using the analytical approximation to the test statistics of Lilliefors, proposed by Dallal and Wilkinson (1986).
The preliminary analyses were complemented with the in-vestigation of the homogeneity of the data. Inhomogeneities in time series can result, for example, from changes in observational routines, relocation of the measuring station, and changes in station surroundings or in measurement techniques. The four tests selected to check the time series homogeneity were: Standard Normal Homogeneity Test (SNHT) (Alexandersson and Moberg, 1997), the Buishand range test (Buishand, 1982), the Pettitt test (Pettitt, 1979), and the Von Neumann ratio test (Von Neumann, 1941). All tests but the Pettitt test are parametric. The Pettitt test is based on the ranks of the elements of a series rather than on the values themselves (Pettitt, 1979). It can be very useful to apply more than one statistical test when it comes to detecting inhomogeneities in time series (e.g. Wijngaard et al., 2003; Costa and Soares, 2009).
)
(a) (b)
AZORES
PORTUGAL
MADEIRA
(c)
Fig. 1.Study area:(a)location of mainland Portugal and the Madeira and Azores archipelagos;(b)location of ten precipitation measuring
stations in mainland Portugal;(c)location of four precipitation measuring stations in the Madeira and Azores archipelagos.
whereas the Buishand range and the Pettitt tests identify the breaks in the middle of a time series more easily (Hawkins, 1977).
With respect to their homogeneity, the precipitation time series were assembled in categories based on the classification used by Wijngaard et al. (2003). Therefore, the precipitation series were classified as “useful”, “doubtful” and “suspect”, depending on the number of tests that rejected the null hypothesis at the 1% significance level. This classification amounts to a qualitative assessment of the adequacy of the time series to conduct trend and variability analyses.
The presence of trends in the precipitation time series was examined using the Mann-Kendall non-parametric test (e.g. Gilbert, 1987) and Sen’s non-parametric method (Sen, 1968; Gilbert, 1987). The Mann-Kendall test is useful if the possible trend in a time series can be considered monotonic; moreover, the time series should not be characterized by seasonality. The null hypothesis, H0, of no trend assumes
that the observations are randomly ordered in time and is tested against the alternative hypothesis, H1, associated
Table 1.Identification of the precipitation measuring sites and some descriptive statistics for the annual time series.
Measuring Station (Code) Latitude Longitude Altitude Period Annual Precipitation
(N) (W) (m)
Mean Coef. of Max. Min.
(mm) Variation (mm) (mm)
Mainland
Portug
al
Travancas (03N-01G) 41◦50′ 07◦18′ 884 1914–2006 985 0.252 1636 499
Moncorvo (06O-04UG) 41◦10′ 07◦03′ 385 1878–1995 569 0.263 1095 253
Porto (546) 41◦08′ 08◦36′ 93 1863–2007 1237 0.251 2255 604
Coimbra (549) 40◦12′ 08◦25′ 141 1900–1998 982 0.216 1651 524
Penha Garcia (13O-01UG) 40◦03′ 07◦01′ 495 1911–1998 808 0.264 1597 432
Lisboa (535) 38◦43′ 09◦09′ 77 1871–2007 733 0.250 1421 416
´
Evora (557) 38◦34′ 07◦54′ 309 1871–2007 629 0.253 1186 346
Beja (562) 38◦01′ 07◦52′ 246 1900–2007 563 0.246 1042 301
S˜ao Br´as de Alportel (31J-01C) 37◦10′ 07◦45′ 325 1909–2002 837 0.306 1693 431
Lagos (31E-01UC) 37◦06′ 08◦40′ 14 1902–2006 527 0.302 1098 187
Azores
Horta/Faial (506) 38◦31′ 28◦38′ 60 1901–1994 1020 0.168 1623 692
Angra do Hero´ısmo/Terceira (511) 38◦40′ 27◦13′ 74 1865–2004 1065 0.204 1650 588
Ponta Delgada/S. Miguel (513) 37◦45′ 25◦40′ 35 1865–1994 884 0.234 1459 432
Madeira
Funchal (522) 32◦38′ 16◦53′ 49 1865–2000 623 0.343 1419 200
(see e.g. Sneyers, 1990). Sen’s estimator can be used for estimating the change per unit time in time series that exhibit linear trends.
The method described in Tom´e and Miranda (2005) was used to deal with the non-monotonic character of trends in the data. This method was built based on a study developed by Karl et al. (2000) about global warming changes and corresponds to an extension of the method proposed in Tom´e and Miranda (2004). The methodology aims at fitting an unknown number of continuous straight-line segments to a time series and at detecting the trend change-points. The number and location of the breakpoints are optimized simultaneously. Thus, the method searches for such segments that best fit the data, in a least-squares sense, while satisfying a pair of conditions: a minimum time distance between breakpoints and a minimum trend change at each breakpoint. The conditions imposed in our study are explained below.
4 Results and discussion
4.1 Analysis of annual precipitation
This section first presents the results of the preliminary analyses of the annual data and afterwards the results of the trend analyses.
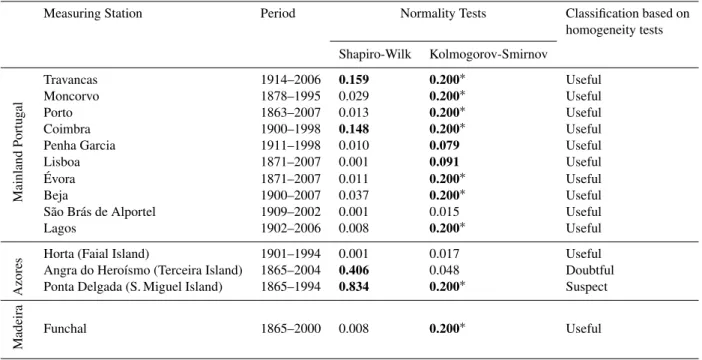
The statistics for the Shapiro-Wilk and Kolmogorov-Smirnov tests for normality applied to the annual precipita-tion time series are given in Table 2. The statistics provided
evidence to reject the null hypothesis of normality for the data from Horta and S˜ao Br´as de Alportel. Even though normality is a pre-condition for some of the subsequent tests of homogeneity, the tests are applied to all the data sets. However, one should keep in mind that the results of the normality and homogeneity testing of the precipitation time series might affect the validity of the conclusion of the subsequent trend tests (below) and should be carefully taken into account.
Table 2. Statistics of the Shapiro-Wilk and Kolmogorov-Smirnov tests for normality, applied to the annual precipitation time series. The
results in bold indicate which series have normal distributions for a 5% significance level. The∗mark indicates that the result is a lower
bound of the true significance. The classification of the time series as “useful”, “doubtful” and “suspect” is based on the results of the homogeneity tests, as proposed by Wijngaard et al. (2003).
Measuring Station Period Normality Tests Classification based on
homogeneity tests
Shapiro-Wilk Kolmogorov-Smirnov
Mainland
Portug
al
Travancas 1914–2006 0.159 0.200∗ Useful
Moncorvo 1878–1995 0.029 0.200∗ Useful
Porto 1863–2007 0.013 0.200∗ Useful
Coimbra 1900–1998 0.148 0.200∗ Useful
Penha Garcia 1911–1998 0.010 0.079 Useful
Lisboa 1871–2007 0.001 0.091 Useful
´
Evora 1871–2007 0.011 0.200∗ Useful
Beja 1900–2007 0.037 0.200∗ Useful
S˜ao Br´as de Alportel 1909–2002 0.001 0.015 Useful
Lagos 1902–2006 0.008 0.200∗ Useful
Azores
Horta (Faial Island) 1901–1994 0.001 0.017 Useful
Angra do Hero´ısmo (Terceira Island) 1865–2004 0.406 0.048 Doubtful
Ponta Delgada (S. Miguel Island) 1865–1994 0.834 0.200∗ Suspect
Madeira
Funchal 1865–2000 0.008 0.200∗ Useful
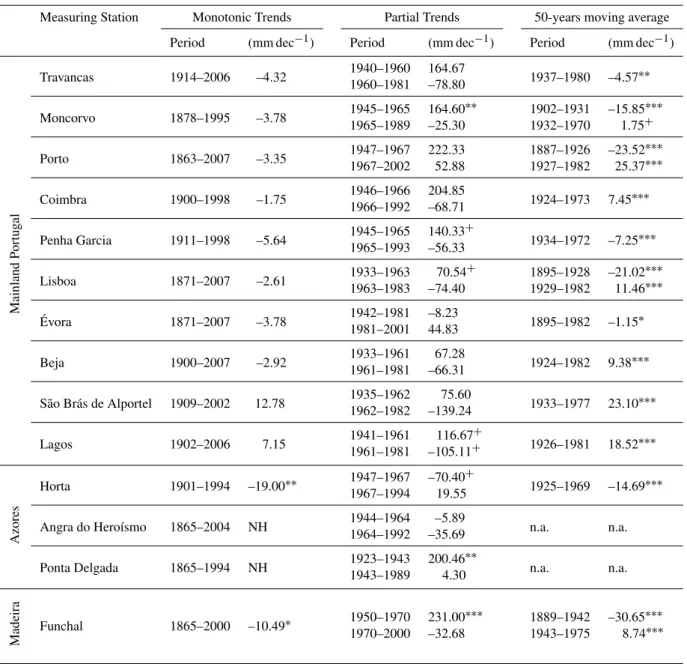
Results of the annual precipitation trend analyses are given in Table 3 and Fig. 2. This figure shows the annual time series for selected locations, the monotonic linear trend fitting to the data and the partial trends identified using the method described in Tom´e and Miranda (2005). Table 3 gives the results of the trend analysis for the full record period and for two selected contiguous periods having distinct behaviour. The statistical significance of the results was assessed using the Mann-Kendall test. Over the full time span of the records there was no evidence to reject the null hypothesis of no trend in annual precipitation at any of the stations from mainland Portugal. For the Azores, the results indicate a decrease of 19 mm decade−1 in the annual precipitation from Horta
(Faial Island). But this result could be biased, taking into consideration the results of the normality and homogeneity tests discussed above. Because the other time-series from the Azores were not found to be homogeneous over the full period of the records they were not tested for trends over that period. For Funchal (Madeira Island), results show a reduction in annual precipitation of about 10.5 mm decade−1
over the record period.
The 50-year moving average series of annual precipitation were also examined. The reason for adopting 50 years as the time-window instead of a shorter period was to reduce the impact of precipitation cycles of a few decades on the analyses. Figure 3 shows a plot of the 50-year
moving average series where each data point is centred on the corresponding 50-year period. Overall, the 50-year moving average analyses suggest an increasing tendency in annual precipitation (i.e. positive trend slope) in the recent past for many of the series in mainland Portugal and the islands. For the longest time series this behaviour was sometimes preceded by a decrease over time. The rate of change observed for different sub-periods is given in Table 3; results are not given for the series that were not considered homogeneous. It is worth noting that the presence of correlation in the data may cause errors in trend analysis and frequently lead to rejecting the null hypothesis, which means that trend is accepted even in cases when it does not exist.
Examination of the 50-year moving average data and the non-monotonic character of the behaviour observed led us to investigate partial trends in precipitation. For that purpose the method proposed in Tom´e and Miranda (2005) was used. This methodology identifies times of significant change in the precipitation series. The results for annual precipitation that are shown in Figs. 2 and 4 were obtained by unconstraining (in practical terms) the minimum rate of change, set at 0.01 mm year−1, at consecutive breakpoints by
Table 3.Sen’s estimator of the slope (mm decade−1) of monotonic and partial trends of the annual precipitation, as well as for the trends in
the 50-year moving average series. The confidence levels for the trend tests are marked:+90%,∗95%,∗∗99% and∗∗∗99.9%. The periods
selected for partial trends were based on breakpoints located using the methodology described in Tom´e and Miranda (2005). The 50-year moving average series were taken to be centred on the corresponding period. NH identifies series that were not considered homogeneous.
Measuring Station Monotonic Trends Partial Trends 50-years moving average
Period (mm dec−1) Period (mm dec−1) Period (mm dec−1)
Mainland
Portug
al
Travancas 1914–2006 –4.32 1940–1960 164.67 1937–1980 –4.57∗∗
1960–1981 –78.80
Moncorvo 1878–1995 –3.78 1945–1965 164.60
∗∗ 1902–1931 –15.85∗∗∗
1965–1989 –25.30 1932–1970 1.75+
Porto 1863–2007 –3.35 1947–1967 222.33 1887–1926 –23.52
∗∗∗
1967–2002 52.88 1927–1982 25.37∗∗∗
Coimbra 1900–1998 –1.75 1946–1966 204.85 1924–1973 7.45∗∗∗
1966–1992 –68.71
Penha Garcia 1911–1998 –5.64 1945–1965 140.33
+
1934–1972 –7.25∗∗∗
1965–1993 –56.33
Lisboa 1871–2007 –2.61 1933–1963 70.54
+ 1895–1928 –21.02∗∗∗
1963–1983 –74.40 1929–1982 11.46∗∗∗
´
Evora 1871–2007 –3.78 1942–1981 –8.23 1895–1982 –1.15∗
1981–2001 44.83
Beja 1900–2007 –2.92 1933–1961 67.28 1924–1982 9.38∗∗∗
1961–1981 –66.31
S˜ao Br´as de Alportel 1909–2002 12.78 1935–1962 75.60 1933–1977 23.10∗∗∗
1962–1982 –139.24
Lagos 1902–2006 7.15 1941–1961 116.67
+
1926–1981 18.52∗∗∗
1961–1981 –105.11+
Azores
Horta 1901–1994 –19.00∗∗ 1947–1967 –70.40
+
1925–1969 –14.69∗∗∗
1967–1994 19.55
Angra do Hero´ısmo 1865–2004 NH 1944–1964 –5.89 n.a. n.a.
1964–1992 –35.69
Ponta Delgada 1865–1994 NH 1923–1943 200.46
∗∗
n.a. n.a.
1943–1989 4.30
Madeira
Funchal 1865–2000 –10.49∗ 1950–1970 231.00
∗∗∗ 1889–1942 –30.65∗∗∗
1970–2000 –32.68 1943–1975 8.74∗∗∗
chosen based on the application examples given in Tom´e and Miranda (2005) and on the examination of the data. In certain cases, these conditions may introduce some bias in the results, with the location of the breakpoints (i.e. times of significant change) in particular being affected.
Figure 4 reveals that the patterns of precipitation variation over time are not the same for all the data sets investigated. Nevertheless, results suggest that in mainland Portugal sub-periods of increasing and decreasing trends in annual precipitation occur in the records and that they alternate over time. The dominant common annual precipitation pattern is,
0 500 1000 1500
1860 1880 1900 1920 1940 1960 1980 2000
P recip it at io n (m m ) Mo n c o rv o
Monotonic trend (-3,78 mm/decade)
0 500 1000 1500
1860 1880 1900 1920 1940 1960 1980 2000
P recip it at io n ( m m ) Li s b oa
Monotonic trend (-2,61mm/decade) 0 500 1000 1500 2000 2500
1860 1880 1900 1920 1940 1960 1980 2000
P re c ipi ta ti on (m m ) Po rt o
Monotonic trend (-3,35 mm/decade)
0 500 1000 1500
1860 1880 1900 1920 1940 1960 1980 2000
P rec ip it at io n ( m m ) Év o ra
Monotonic trend (-3,78 mm/decade)
0 500 1000 1500
1860 1880 1900 1920 1940 1960 1980 2000
P recip it at io n ( m m ) Year Bej a
Monotonic trend (-2,92 mm/decade)
0 600 1200 1800
1860 1880 1900 1920 1940 1960 1980 2000
P rec ip it a tio n ( m m ) A n gr a do H e ro ís m o 0 600 1200 1800
1860 1880 1900 1920 1940 1960 1980 2000
P rec ip it a tio n (m m ) P ont a D e lga d a 0 600 1200 1800
1860 1880 1900 1920 1940 1960 1980 2000
P rec ip it at io n (m m ) Year Fu nc ha l
Monotonic trend (-10,49* mm/decade)
Time series Partial trends
Time series Partial trends
0 500 1000 1500
1860 1880 1900 1920 1940 1960 1980 2000
P rec ip it a tio n ( m m ) La g os
Monotonic trend (7,15 mm/decade)
0 600 1200 1800
1860 1880 1900 1920 1940 1960 1980 2000
P re c ip it a tio n ( m m ) Ho rt a
Monotonic trend (-19,00** mm/decade)
Fig. 2. Annual precipitation series for six stations in mainland Portugal and four stations in the islands. Sen’s estimator of the slope of
monotonic trends over the full record periods (blue line) is indicated in the legend. The red line is the fit for partial trends. For better visualization, note that the Y axes scales are not the same for all the plots.
results. With respect to the Atlantic archipelagos, the scarcity and dispersion of the data do not allow us to conclude whether there is a pattern in annual precipitation there.
400 500 600 700 800 900 1000 1100 1200 1300 1400
1865 1885 1905 1925 1945 1965 1985 2005
A v er ag e a n n u a l p rec ip it a ti o n ( m m) Year
Travancas (1) Beja (8)
Moncorvo (2) São Brás de Alportel (9) Porto (3) Lagos (10)
Coimbra (4) Horta (11)
Penha Garcia (5) Angra do Heroismo (12) Lisboa (6) Ponta Delgada (13)
Évora (7) Funchal (14) (13) (12) (10) (9) (8) (11) (14) (6) (5) (4) (3) (2) (1) (7)
Fig. 3. The 50-year moving average series of the annual
precipitation from Portugal; the data from the islands are plotted with dashed lines. The data are centred on the 50-year window. See also Table 3.
between periods with significantly different trends that were identified by the methodology used in this analysis. It highlights how the results can be completely different depending on the period analysed, and that extrapolations beyond these periods can be extremely dangerous without a comprehensive understanding of larger scale precipitation dynamics.
For example, in the period between roughly 1940 and 1960 in mainland Portugal there was an increase in annual precipitation, followed by a decreasing trend from about 1960 to 1980 (see Fig. 4a). It should be noted that there are shifts in the corresponding breakpoints between the data sets and that these dates are only indicative. Table 3 shows the results of partial precipitation trends for such consecutive periods. From the information in this table, Sen’s estimator confirms reductions in annual precipitation over mainland Portugal in the period roughly from the 60s–70s until the 80s–90s for almost all locations; but 75% of these trends are not statistically significant. Moreover, in many locations this behaviour changed into an increasing trend period which has recently apparently been followed again by another period of decreasing trend. It is worth noting that the first and last segments are too short to allow a reliable estimation of trend since this estimator could easily be biased.
0 200 400 600 800 1000 1200 1400 1600
1860 1880 1900 1920 1940 1960 1980 2000
A nn ua l pr e c ip it a tio n ( m m
) Mainland Portugal
Travancas Lisboa
Moncorvo Évora
Porto Beja
Coimbra São Brás de Alportel Penha Garcia Lagos
0 200 400 600 800 1000 1200 1400 1600
1860 1880 1900 1920 1940 1960 1980 2000
A nn u a l pr e c ip it a tio n ( m m ) Year
Madeira and Azores
Horta
Angra do Heroismo Ponta Delgada Funchal Lisboa
Évora Beja
São Brás de Alportel Lagos Travancas Moncorvo Porto Coimbra Penha Garcia (a) (b) Travancas Moncorvo Porto Coimbra Penha Garcia Lisboa Évora Beja
São Brás de Alportel Lagos
Fig. 4. Partial trend fits to the annual precipitations for: (a)ten
locations in mainland Portugal (adapted from de Lima et al., 2010);
(b)four locations in the Madeira and Azores archipelagos. The time
series are not plotted.
Table 4.Sen’s estimator of the monthly precipitation trends (mm decade−1) and the respective confidence levels:+90%,∗95%,∗∗99%
and∗∗∗99.9%. The data are for the full period and for sub-periods of negative trend in annual precipitation, which were selected for each
time series based on the breakpoints located in the partial trend analyses. The results for mainland Portugal were partly reported in de Lima et al. (2010).
Station name Period Jan Feb Mar Apr May Jun Jul Aug Sep Oct Nov Dec
Mainland
Portug
al
Travancas 1914–2006 –1.56 –2.97 –5.30
+ –1.13 –0.49 –1.20 0.06 0.92∗ 0.48 7.00∗∗ –1.18 –4.36 1960–1981 –24.17 0.80 –23.20 –1.94 22.52 –0.58 –1.56 –0.40 –10.50 –7.14 –58.00∗ –3.81
Moncorvo 1878–1995 0.32 0.12 –2.03
∗ –0.99 –0.53 0.13 0.00 0.00 –0.57 –1.56 –1.52 –0.14 1965–1989 –25.47+ –15.52 –14.77 12.25 –3.92 3.49 0.00 0.00 0.02 3.72 5.18 –18.10
Porto 1863–2007 0.84 0.68 –2.52 –0.89 –0.04 –0.57 –0.17 0.31 –0.24 –0.97 –0.82 1.85 1967–2002 –12.25 –19.38 –17.45+ 6.46 –6.43 –6.34 4.75∗ 1.33 –0.67 24.88+ 9.36 24.06
Coimbra 1900–1998 4.13 1.25 –6.41
∗∗ –0.10 2.10 0.02 –0.25 –0.17 –0.58 0.79 –1.10 –1.02 1966–1992 –42.24∗ –28.50 –11.80 10.69 –22.75+ –1.91 –0.33 2.00 –2.62 18.54 –9.38 13.05
Penha Garcia 1911–1998 2.72 0.74 –10.90
∗∗∗ 0.06 1.75 –0.40 0.00 0.00 0.00 0.07 –0.14 0.00 1965–1993 –35.22+ –26.29 –7.39 7.25 0.04 –3.84 0.00 0.00 0.05 12.77 –2.53 7.97
Lisboa 1871–2007 0.89 –0.64 –2.83
∗∗ –1.13 –0.47 –0.36 0.00 0.02 –0.08 –0.35 –0.29 –0.63 1963–1983 –73.29∗ –35.93 –23.68 7.00 2.64 –3.64 1.59∗ 0.00 –3.54 –6.58 –22.79 8.58
´
Evora 1871–2007 –0.07 –0.63 –2.15
∗ –0.85 –0.77 –0.45 0.00 0.00 0.21 0.32 –1.24 –0.07 1942–1981 2.66 16.42∗ –14.11+ –3.68 0.30 3.50 0.00 –0.05 1.06 –2.67 –5.59 –4.00
Beja 1900–2007 0.19 –0.81 –3.25
∗∗ 0.17 –0.54 –0.26 0.00 0.00 0.05 1.44 –1.51 0.33 1961–1981 –14.89 –6.37 –13.53 3.58 6.13 –11.33 0.17 0.10 –4.58 3.22 –32.44∗ 17.79
S˜ao Br´as de Alportel 1909–2002 4.35 –2.88 –5.16
∗ 1.42 1.00 0.00 0.00 0.00 1.18∗∗∗ 0.95 –1.16 8.92∗ 1962–1982 –56.14 –28.07 –20.73 3.10 –2.38 –11.97 0.22∗∗ 0.00 2.00 –14.15 –33.54 13.81
Lagos 1902–2006 0.18 –0.08 –1.15 0.74 –0.07 –0.11
+ 0.00 0.00 0.00 1.66 –0.70 1.33 1961–1981 –40.62 9.39 –29.12∗ 5.98 –1.86 –4.55 0.00 0.00 –1.91 –3.10 –49.08∗ –14.19
Azores
Horta 1901–1994 –2.79 –0.50 –1.73 –2.53
+ –2.86∗ –2.02+ –0.68 –1.82+ –0.46 1.81 1.02 –0.91∗∗ 1967–1994 –25.90∗ –1.60 –7.78 –7.20 6.46 –2.62 –2.65 2.50 –4.25 16.53+ 25.99∗ 0.89
Angra do Hero´ısmo 1865–2004 1.17 –0.53 1.08 –0.02 –0.73 0.09 0.15 0.51 0.89 1.32 –0.72 1.18 (Terceira Island) 1964–1992 –41.28∗ –18.27 –10.60 11.06 13.23 –6.05 –5.29 2.82 23.27∗ –4.43 16.50 –4.43
Ponta Delgada 1865–1994 3.42∗ 2.00+ 1.88 0.26 –0.05 –0.03 0.45 –0.17 1.99∗ 2.71∗ 3.55∗∗ 1.41 (S. Miguel Island) 1943–1989 –7.38 0.29 –8.28 5.58 –4.00 1.83 –1.00 1.27 6.14 –6.17 2.52 12.17+
Madeira
Funchal 1865–2000 –1.57 –0.15 –1.78 –0.68 0.00 0.00 0.00 0.00 –0.08 0.00 –2.95 + –0.34 1970–2000 –9.60 –16.75∗ –9.50 –9.40∗ 5.05 –0.17 0.00 0.00 –1.00 13.62 –11.50 11.29
4.2 Analysis of monthly precipitation
Table 4 presents the results of the trend analyses of monthly precipitation recorded in mainland Portugal and the Islands for the full record period and for sub-periods. Some monthly trends obtained for sub-periods are also shown in Fig. 5.
Results for the full record period do not suggest important overall changes in precipitation distribution over the year. The exception is the precipitation in March: over time spans ranging from 88 to 145 years precipitation exhibits a decreasing trend in all the ten stations in mainland Portugal that were investigated; for seven of the data sets the trends are statistically significant, at least at the 5% significance level. For the Azores, only the data from Horta showed a decreasing pattern for March, which was not statistically significant. Similar behaviour was revealed by the data from Funchal.
The analyses of sub-periods yield different results. An example is given in Table 4 for periods from roughly 1960 to 1980, when a decreasing trend in annual precipitation
was observed; but this result is only significant for the data from Lagos. The exception is the data from Porto; it reveals an increasing trend over this period, but not statistically significant. The selection of the sub-periods was based on the results of partial trend analysis of annual precipitation, and so the sub-periods studied are not exactly the same for all the data sets. This may help explain some of the different results obtained for the rate of change in monthly precipitation for the various data sets (Fig. 5), apart from local factors.
-80 -60 -40 -20 0 20 40 Ja n Fe b Ma r Apr Ma y Ju n Ju l
Aug Sep Oc
t No v De c P re c ip it a tio n t re n ds ( m m /de c a de ) Mainland Portugal Moncorvo (1965-1989) Coimbra (1966-1992) Lisboa (1963-1983) Beja (1961-1981) -80 -60 -40 -20 0 20 40 Ja n Fe b Ma r Apr Ma y Ju n Ju l
Aug Sep Oc
t No v De c P re c ip it a tio n tr e n ds ( m m /d e c a d e )
Madeira and Azores
Horta (1967-1994) Angra do Heroismo (1964-1992) Ponta Delgada (1943-1989) Funchal (1970-2000) Moncorvo (1965-1989) Coimbra (1966-1992) Lisboa (1963-1983) Beja (1961-1981) São Brás de Alportel (1962-1982)
a)
b)
Fig. 5. Monthly precipitation trends in selected periods for:
(a) five locations in mainland Portugal; (b) four locations in
Azores and Madeira. The periods analysed are identified in the legend and were selected based on the partial trend analyses and results, and correspond to decreasing trend sub-periods in annual precipitation.
5 Concluding remarks
The investigation of monotonic linear trends in long precipitation time series was used as an exploratory tool to detect long term patterns of variation in this climate element in mainland Portugal and the Azores and Madeira archipelagos. On the whole this analysis did not reveal statistical evidence for rejecting the null hypothesis of no trend in annual precipitation over the full record period, in those geographical locations, based on the data that were
0 50 100 150 200 250 300
1860 1880 1900 1920 1940 1960 1980 2000
M o n thl y pr e c ip it a tio n (m m ) Year December Travancas Lisboa Moncorvo Évora Porto Beja
Coimbra São Brás de Alportel Penha Garcia Lagos
0 50 100 150 200 250 300
1860 1880 1900 1920 1940 1960 1980 2000
M o n thl y pr e c ip it a tio n (m m ) January 0 50 100 150 200 250 300
1860 1880 1900 1920 1940 1960 1980 2000
M o n thl y pr e c ip it a tio n (m m ) March 0 50 100 150 200 250 300
1860 1880 1900 1920 1940 1960 1980 2000
M o n thl y pr e c ip it a tio n (m m ) October a) b) c) d)
Fig. 6.Partial trends in monthly precipitation in mainland Portugal:
(a)January;(b)March;(c)October;(d)December. The time series
explored in this study. However, the analyses of the 50-year moving averages of annual precipitation revealed an increase over time, in the recent past, for many of the series. For the longest time series this behaviour was preceded by a decrease over time.
The analyses of partial trends in the time series revealed a sequence of alternating periods of decreasing and increasing trends in annual and monthly precipitation, and these are sometimes statistically significant. These contiguous periods, exhibiting distinct tendencies, are defined by turning points in the behaviour of precipitation which are times of significant change in the properties of precipitation. The study of monthly precipitation suggested that redistribution of precipitation during the year took place over several decades, which means that some seasons were wetter while others were drier. However, results also show that this behaviour is not persistent and that changes can occur rapidly, in terms of the relevant time scales being discussed here. The limited number and origin of the precipitation time series used in this work means that it is not possible to perceive the presence of regional patterns. This issue is more pertinent for the Azores and Madeira, where the spatial variability of precipitation is very marked; at the same time, the homogeneity tests identified some probable problems in the data that may reduce the usefulness of some of the time series for trend studies and, therefore, affect the reliability of the results. It is noticeable, however, that over the longest period of records, which ranges from 88 to 145 years, March exhibits a decreasing trend in all the ten stations in mainland Portugal, seven of which are statistically significant at the 5% significance level. This type of behaviour was not revealed by the data from the islands, for this study. There is evidence that global and local factors can both affect the spatial distribution of trends in mainland Portugal and in the Portuguese archipelagos, which has been also reported in the literature for other locations in the Iberian Peninsula and nearby territories (see e.g. Zhang et al., 1997; Lionello et al., 2006; de Lima et al., 2007; Costa et al., 2010; Gonz´alez-Hidalgo et al., 2010; Mourato et al., 2010).
This study also confirms that the results from precipitation trend analyses based on a monotonic (linear) model should be handled carefully, especially if only a small number of data sets are studied. In addition, it demonstrates that the analyses of short precipitation records consisting of only a few decades can be biased by the period studied. Complementary methods should therefore be used to better understand the structure of precipitation.
We have already stressed these issues in a previous publication (de Lima et al., 2010), based on the analyses of data sets from mainland Portugal which have been reanalysed and further explored in the present work. But this fuller study of precipitation time series from Portugal, which is now more focused on the variability of monthly precipitation (i.e. seasonal variability), and the study of additional data (i.e. the study of long series from the
Azores and Madeira islands), lends more weight to our previous conclusions. Thus, this work provides a more comprehensive and in-depth discussion of the long-term behaviour of annual and monthly precipitation in Portugal than is found in de Lima et al. (2010), thanks to the greater diversity of analytical methods used and the overall analyses of precipitation records for mainland Portugal and the Portuguese islands of Madeira and the Azores. This compilation of results is also important for the overall understanding of the local conditions and regional specificities of precipitation in Portugal.
Acknowledgements. This work was carried out under research
project PTDC/GEO/73114/2006 and project RISK of the MIT-Portugal Program, funded by the Foundation for Science and Technology (FCT) of the Ministry of Science, Technology
and Higher Education, of Portugal. The second author
receives financial support from FCT through the Doctoral Grant SFRH/BD/60213/2009.
The authors acknowledge the collaboration in this study of M. F. E. S. Coelho, of the Institute of Meteorology (Portugal), within the framework of the above-mentioned projects.
Edited by: A. Mugnai
Reviewed by: A. Costa and another anonymous referee
References
Alexandersson, H. and Moberg, A.: Homogenization of Swedish temperature data. Part I: Homogeneity test for linear trends, Int. J. Climatol., 17, 25–34, 1997.
Buishand, T. A.: Some methods for testing the homogeneity of rainfall records, J. Hydrol., 58, 11–27, 1982.
Corte-Real, J., Qian, B., and Xu, H.: Regional climate change in Portugal: precipitation variability associated with large-scale atmospheric circulation, Int. J. Climatol., 18, 619–635, 1998. Costa, A. C. and Soares, A.: Trends in extreme precipitation indices
derived from a daily rainfall database for the South of Portugal, Int. J. Climatol., 29(13), 1956–1975, 2009.
Costa, M. J., Salgado, R., Santos, D., Levizzani, V., Bortoli, D., Silva, A. M., and Pinto, P.: Modelling of orographic precipitation over Iberia: a springtime case study, Adv. Geosci., 25, 103–110, doi:10.5194/adgeo-25-103-2010, 2010.
Dallal, G. E. and Wilkinson, L.: An analytic approximation to the distribution of Lilliefors’s test statistic for normality, The American Statistician, 40, 294–296, 1986.
de Lima, M. I. P. and de Lima, J. L. M. P.: Investigating the multifractality of point precipitation in the Madeira archipelago, Nonlin. Processes Geophys., 16, 299–311, doi:10.5194/npg-16-299-2009, 2009.
de Lima, M. I. P., Marques, A. C. P., de Lima, J. L. M. P., and Coelho, M. F. E. S.: Precipitation trends in Mainland Portugal in the period 1941–2000, IAHS Publ. 310, International Association of Hydrological Sciences, 94–102, 2007.
annual and monthly time series from mainland Portugal, Adv. Geosci., 25, 155–160, doi:10.5194/adgeo-25-155-2010, 2010. Deheuvels, P. A.: Kolmogorov-Smirnov type test for independence
and multivariate samples, Rev. Roum. Math. Pure. A., 26, 213– 226, 1981.
Dur˜ao, R., Pereira, M. J., Costa, A. C., Cˆorte-Real, J. M., and Soares, A.: Indices of precipitation extremes in Southern Portugal - a geostatistical approach, Nat. Hazards Earth Syst. Sci., 9, 241–250, doi:10.5194/nhess-9-241-2009, 2009. Gilbert, R. O.: Statistical methods for environmental pollution
monitoring, John Wiley & Sons, New York, USA, 1987. Gonz´alez-Hidalgo, J. C., Brunetti, M., and de Luis, M.:
A new tool for monthly precipitation analysis in Spain: MOPREDAS database (monthly precipitation trends
Decem-ber 1945–NovemDecem-ber 2005), Int. J. Climatol., in press,
doi:10.1002/joc.2115, 2010.
Goodess, C. M. and Jones, P. D.: Links between circulation and changes in the characteristics of Iberian rainfall, Int. J. Climatol., 22(13), 1593–1615, 2002.
Hawkins, D. M.: Testing a sequence of observations for a shift in location, J. Am. Stat. Assoc., 72, 180–186, 1977.
Karl, T. R., Knight, R. W., and Baker, B.: The record breaking global temperatures of 1997 and 1998: Evidence for an increase in the rate of global warming?, Geophys. Res. Lett., 27(5), 719– 722, 2000.
Lionello, P., Malanotte-Rizzoli, P., and Boscolo, R. (Eds.): Mediterranean climate variability, 4, Developments in earth and environmental sciences Series, Elsevier, The Netherlands, 438 pp., 2006.
L´opez-Moreno, J. I., Vicente-Serrano, S. M., Gimeno, L., and Nieto R.: Stability of the seasonal distribution of precipitation
in the Mediterranean region: Observations since 1950 and
projections for the 21st century, Geophys. Res. Lett., 36, L10703, doi:10.1029/2009GL037956, 2009.
Miranda, P., Coelho, F. E. S., Tom´e, A. R., Valente, M. A., Carvalho, A., Pires, C., Pires, H. O., Pires, V. C., and Ramalho, C.: 20th Century Portuguese climate and climate scenarios, in: Climate Change in Portugal: Scenarios, Impacts and Adaptation Measures, edited by: Santos, F. D., Forbes, K., and Moita, R., Gradiva, Lisbon, Portugal, 27–83, 2002.
Miranda, P. M. A., Valente, M. A., Tom´e, A. R., Trigo, R., Coelho, F., Aguiar, A., and Azevedo, E. B.: O clima de Portugal nos s´eculos XX e XXI, in: Alterac¸˜oes clim´aticas em Portugal: Cen´arios, impactos e medidas de adaptac¸˜ao – Projecto SIAM II, edited by: Santos, F. D. and Miranda, P., Gradiva, Lisbon, Portugal, 45–113, 2006 (in Portuguese).
Mourato, S., Moreira, M., and Corte-Real, J.: Interannual
variability of precipitation distribution patterns in Southern Portugal, Int. J. Climatol., in press, doi:10.1002/joc.2021, 2010. Pettitt, A. N.: A non-parametric approach to the change-point
problem, Appl. Statist., 28(2), 126–135, 1979.
Rodrigo, F. S. and Trigo, R. M.: Trends in daily rainfall in the Iberian Peninsula from 1951 to 2002, Int. J. Climatol., 27, 513– 529, 2007.
Royston, P.: An extension of Shapiro and Wilk’s W test for normality to large samples, Appl. Statist., 31, 115–124, 1982. Santos, F. D., Valente, M. A., Miranda, P. M. A., Aguiar, A.,
Azevedo, E. B., Tom´e, A., and Coelho, F.: Climate change scenarios in the Azores and Madeira Islands, World Resource Review, 16(3), 473–491, 2004.
Sen, P. K.: Estimates of the regression coefficient based on
Kendall’s tau, J. Am. Stat. Assoc., 63, 1379–1389, 1968. Sneyers, R.: On the statistical analysis of series of observations,
World Meteorological Organization, Geneva, Switzerland,
Technical Note no. 143, WMO no. 145, 1990.
Tom´e, A. R. and Miranda, P. M. A.: Piecewise linear fitting and trend changing points of climate parameters, Geophys. Res. Lett., 31, L02207, doi:10.1029/2003G019100, 2004.
Tom´e, A. R. and Miranda, P. M. A.: Continuous partial trends and low-frequency oscillations of time series, Nonlin. Processes Geophys., 12, 451–460, doi:10.5194/npg-12-451-2005, 2005. Von Neumann, J.: Distribution of the ratio of the mean square
successive difference to the variance, Ann. Math. Stat., 12(4), 367–395, 1941.
Wijngaard, J. B., Klein-Tank, A. M. G., and K¨onnen, G. P.: Homogeneity of 20th century European daily temperature and precipitation series, Int. J. Climatol., 23, 679–692, 2003.
Zhang, X., Wang, X. L., and Corte-Real, J.: On the