Adv. Sci. Res., 6, 219–226, 2011 www.adv-sci-res.net/6/219/2011/ doi:10.5194/asr-6-219-2011
©Author(s) 2011. CC Attribution 3.0 License.
Advances
in
Science & Research
Open Access Proceedings10th
EMS
Ann
ual
Meeting
and
8th
European
Conf
erence
on
Applied
Climatology
(ECA
C)
2010
A data portal for regional climatic trend analysis in a
Peruvian High Andes region
M. Schwarb1, D. Acu ˜na2, Th. Konzelmann3, M. Rohrer1, N. Salzmann4, B. Serpa Lopez2, and E. Silvestre2
1Meteodat GmbH, Zurich, Switzerland
2SENAMHI, Lima, Peru
3Federal Office of Meteorology and Climatology MeteoSwiss, Zurich, Switzerland
4Department of Geography, University of Zurich, Switzerland
Received: 31 December 2010 – Revised: 17 July 2011 – Accepted: 25 July 2011 – Published: 16 August 2011
Abstract. In the frame of a Swiss-Peruvian climate change adaptation initiative (PACC), operational and
historical data series of more than 100 stations of the Peruvian Meteorological and Hydrological Service (SENAMHI) are now accessible in a dedicated data portal. The data portal allows for example the comparison of data series or the interpolation of spatial fields as well as download of data in various data formats. It is thus a valuable tool supporting the process of data homogenisation and generation of a regional baseline climatol-ogy for a sound development of adequate climate change adaptation measures. The procedure to homogenize air-temperature and precipitation data series near Cusco city is outlined and followed by an exemplary trend analysis. Local air temperature trends are found to be in line with global mean trends.
1 Introduction
The impacts of climatic changes are unequally distributed over the globe. The reason for this is on the one hand be-cause climatic trends have a spatial variability (e.g. Groves et al., 2008) and on the other hand because different regions and systems are dissimilarly vulnerable and sensitive to changes (Schneider et al., 2007). With regard to ongoing international
efforts (e.g. Adaptation Fund (AF) and the new Climate Fund
under the United Nations Framework Convention on Climate Change, UNFCCC) for developing and implementing ade-quate adaptation measures, reliable climate data baselines on a regional – or even local – level become increasingly impor-tant. Successful and sustainable adaptation measures require knowledge on regional climatic trends and must be embed-ded in their regional and local context, that is, they must be developed in close collaboration with the people affected and considering their cultural, political and environmental con-text (Yohe et al., 2007).
Within the frame of a Peruvian-Swiss climate change adaptation initiative (PACC; Salzmann et al., 2009) for the
Central Peruvian Andes, substantial efforts have been
un-dertaken to provide a climatological baseline for the region
Correspondence to: M. Rohrer ([email protected])
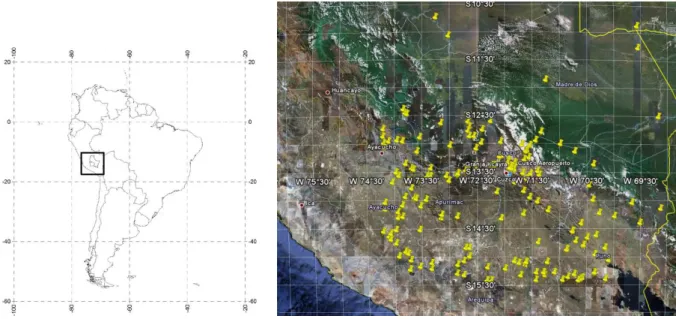
Cusco-Apurimac in the Central Peruvian Andes (Fig. 1). It is aimed at completing and homogenizing available data records and consequently provide reliable, long-term climate time series in order to (i) derive and analyse climatic trends in the target region, to (ii) compute scenarios (statistical down-scaling of GCM results), and eventually to (iii) serve as the climatological basis for developing and implementing ade-quate adaptation measures. Additionally, the performance of alternative data sets has been analysed for the region, such as satellite precipitation estimations from TRMM (Scheel et al., 2010).
Figure 1. Region Cusco-Apurimac in the Peruvian Central Andes and the respective available climate stations. The plots, as shown, are provided in the PACC data portal.
Moreover, a strategy is described on how to generate reli-able long-term daily climate time series in a remote mountain region with typically relatively low spatial and temporal data coverage. In an exemplary manner, results for the station Granja Kcayra (near Cusco) are shown and analyzed.
2 Methods
In Peru, measuring and maintaining hydrological and me-teorological data is under the responsibility of the National Service for Meteorology and Hydrology (SENAMHI). Data records are stored as hard copies, and the process of digi-tizing this data is currently ongoing. SENAMHI publishes daily data of the past few years on their webpage (www. senamhi.gob.pe). For access to longer historical time series, SENAMHI must be contacted personally.
For the purposes and goals of PACC, a data portal has been established which is described in the following section.
2.1 Data portal
In remote mountain regions proper measurement of meteoro-logical data and station maintenance is typically challenging, and human as well as financial resources are often very lim-ited, data series are incomplete, implausible and inhomoge-neous. Prior to use these data records for climatic analyses, it is required to first quality check, treat, complete and ho-mogenize these data (Begert et al., 2005; Appenzeller et al., 2008). Currently, there is an increasing demand of reliable climate time series by scientists and decision makers alike for the purposes of past climate trend analyses, scenario con-struction and impact assessment, and eventually as a basis for
adequate development of adaptation measures. Therefore, tools and strategies must be developed to ease data homoge-nization processes, even and particularly in remote mountain regions, where spatial climate variability is high and often complex due to strong topographic influences. The set-up of a data portal can thereby be a critical initial step and a helpful tool. It allows for an overview and initial exploration of the available data in a specific region, and for transparent and centrally managed data update. That is, a data portal is a management and initial exploring tool, rather than a substi-tute for scientific data analysis tools.
The initiation of a data portal goes naturally along with easy access of many valuable data, which opens many pos-sibilities for new studies. Communication and declaration about data policy, including access, use and eventual publi-cation of data is thus critical and appropriate attention should be given to this issue at a very early stage of the implemen-tation.
M. Schwarb et al.: A data portal for regional climatic trend analysis 221
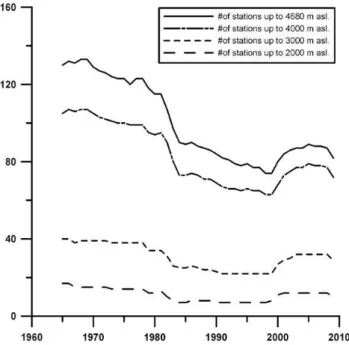
Figure 2.Frequency distribution per altitude class of climatologi-cal stations in the Cusco-Apurimac region that are accessible in the PACC data portal.
Furthermore, the PACC data portal also includes data from alternative sources like satellites (Tropical Rainfall
Measur-ing Mission; TRMM) or hydrological run offdata and
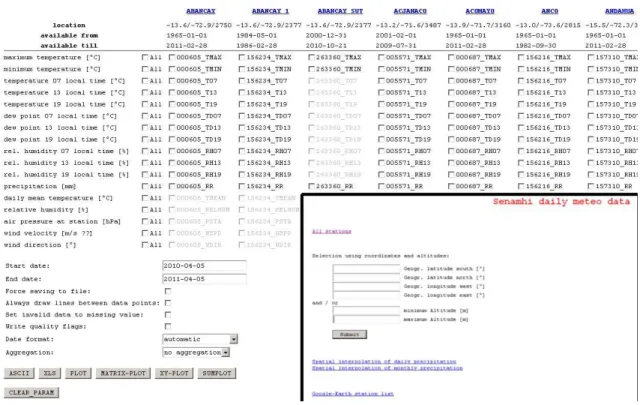
pro-vides several useful functionalities to screen, explore, visu-alize, export, etc. data (Fig. 3). In the following some of the most important features are described.
2.1.1 Metadata access
Proper metadata description and access is a critical element of a data portal, in particular when a portal is aimed at sup-porting data homogenization processes. The PACC data por-tal allows for easy access to all available meta data for each data record (Fig. 4). For each station, geographical longi-tude, latitude and altitude is indicated. A click on the station name leads to a outline map of the station. If a station reloca-tion is known, then the stareloca-tion-ID changes, the stareloca-tion name is indexed and a separate metadata-file is provided. For each station the range of each variable is listed. The lower and up-per limits for a variable can actively be set in the portal and outliers can optionally be turned into missing values.
2.1.2 Temporal and spatial comparison of data records
The PACC portal enables temporal and spatial comparison of time series through several plotting possibilities.
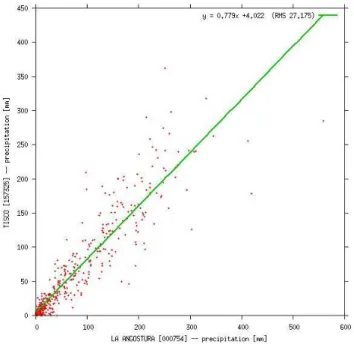
The function xy-plot allows for comparison of two sta-tions (Fig. 5). The example in Fig. 5 shows a good corre-lation, with a root mean square deviation (RMS) of 27 mm for monthly precipitation of the stations La Angostura and
Tisco. These two stations are about 20 km apart and differ in elevation by some meters only.
The xy-plot function (Fig. 5) may be used for finding sta-tions with similar climatic characteristics in order to fill data gaps, or for getting a rapid impression about the meteorolog-ical variability within a region.
The function matrix-plot (Fig. 6) allows (i) for a rapid overview of available data (daily or temporal aggregated, see Sect. 2.1.3) within a defined time period (in red: missing val-ues) and (ii) for a visual impression about the seasonality and inter-annual variability of precipitation sum.
The sumplot function (Fig. 9) allows for enhanced double-mass curve homogeneity testing (Craddock-test). In the data portal enhanced double-mass curve functionality allows for a first homogeneity test. The double-mass curve is a popular tool to check homogeneity (e.g. Buishand, 1982). This curve is obtained by plotting the cumulative amounts of the consid-ered station, against the cumulative amounts of one or a set of neighbouring stations. The plotted points tend to fall along a straight line under conditions of homogeneity. Instead of the double-mass curve one can also plot the cumulative devi-ations from some average value, as it is implemented in the portal. The cumulative deviations have the advantage that changes in the mean amount of rainfall are easier recognized (Craddock, 1979). The graph of the cumulative deviations is sometimes called a residual mass curve. A more current application of the “craddock” method can be found e.g. in Brunetti et al. (2006).
2.1.3 Temporal data aggregation
The data portal allows for temporal data aggregation. The data in the portal is stored as daily values, which can be tem-porally aggregated to monthly or annual means or sums. The temporal aggregation can then be visualized with the tools presented above and may be exported in aggregated form (see also Sect. 2.1.5).
2.1.4 Spatial interpolation of daily/monthly precipitation fields
Figure 3. Data portal of the PACC project with the possibility of pre-selecting stations by a geographical criterion, as a latitude-longitude and/or an altitude range (lower right corner). In the main screen of the data portal, a station-parameter combination can be selected for download, analysis or graphical representation of meteorological data.
Figure 4. Metadata in the PACC data portal, here for the Station Granja Kcayra. The metadata includes a link to Google Earth, with the geographic location of each station. The thresholds for plausible values are also indicated.
For the application of more sophisticated interpolation methods in order to produce final interpolation maps, the data can be exported in order to apply specific and more so-phisticated interpolation methods (e.g. PRISM (Parameter-elevation Regressions on Independent Slopes Model); see Daly et al., 1994)
2.1.5 Export and download functionalities
M. Schwarb et al.: A data portal for regional climatic trend analysis 223
Figure 5. XY-plot for the two high-altitude precipitation sta-tions La Angostura (15.18◦S, 71.65◦W, 4150 m a.s.l.) and Tisco
(15.35◦S, 71.45◦W, 4175 m a.s.l.). Shown are monthly
precipita-tion sums (red crosses), the equaprecipita-tion of the line of best fit (green line) and the RMS value.
Figure 6. Matrix plot of monthly (aggregated from daily val-ues) precipitation sums for the precipitation station La Angostura (15.18◦S, 71.65◦W, 4150 m a.s.l.) from January 1965 to
Decem-ber 2010. The red bars are for monthly values having less than the predefined minimum number of plausible daily values required for the calculation of a monthly mean or sum.
2.1.6 Data plausibility
The process of data homogenization (see next section) in-cludes the check of data series regarding their plausibility and the detection and replacement of implausible or erro-neous values. The above presented data portal tools provide several ways to check data records regarding their plausibil-ity. Figure 7 shows an example of a detected implausible value. While precipitation sums of the three stations Janacan-cha, La Angostura and Tisco have similar monthly sums
be-Figure 7.Detection of an unplausible value in a precipitation data series of the stations Janacancha (15.18◦S, 71.77◦W, 4320 m a.s.l.,
in red), La Angostura (15.18◦S, 71.65◦W, 4150 m a.s.l., in green)
and Tisco (15.35◦S, 71.45◦W, 4175 m a.s.l., in blue).
tween 1970 and 1988, it is evident from the comparison with the other two stations that for La Angostura in February 1984 the monthly sum is implausibly high. This error may be in-troduced by technical problems with the measurement sta-tion, misreading of the value by the person who transmitted the data etc. In a first step, this value may be turned into “missing value” in the data portal. In a second step, the rea-son for the implausible value either is found and corrected or a plausible value is estimated through interpolation.
2.2 The homogenization approach
As stated above, plausible, complete and homogeneous cli-mate data series are an absolute prerequisite for any clicli-mate related trend analysis (e.g. Appenzeller et al., 2008). De-spite this importance, quality-proofed and homogenized data series are often not available, particularly for mountain re-gions. A reasonable explanation herefore is probably that data quality control, completion and homogenization is gen-erally a challenging and time consuming task, particularly in remote high mountain regions where data is scarce and to-pography raises additional complexity (Begert et al., 2005; Auer et al., 2007).
In the region of Cusco-Apurimac, there is a significant number of data series available (see above and Fig. 1) and many of them with data records starting as early as 1965. On the one hand, however, station records and station history are often fragmentary or lost, among other reasons also as a result of armed conflicts in the region, particularly in the 1980s, and during the past decades, many stations also have been relocated. On the other hand, methods and measuring techniques have remained the same in the Cusco-Apurimac region during the entire measuring period.
Figure 8. Comparison between daily minimum (Tn, in light blue) and maximum Temperature (Tx, in orange) of Granja Kcayra sta-tion (13.56◦S, 71.88◦W, 3219 m a.s.l., near Cusco city), hourly
METAR air temperature observations (in light grey) and NCDC Tx and Tn data records of the nearby station of Cusco-Airport (13.56◦S, 71.88◦W, 3219 m a.s.l., in grey), and the respective
cor-rections made for Granja Kcayra (in dark red and dark blue) for the year 2005.
possible. The strategy followed here is based on known re-gional climatic trends and thus requires complete, long-term time series, which, however, are not available for the Cusco-Apurimac region. To overcome this limitation, instead of using a single long-term record as a reference station,
clus-ters/ensembles of available station series where used which
then served as a substitute for one single, “reference” sta-tion. This is similar to the procedure described in Brunetti et al. (2006), where the a priory existence of a homogeneous reference series is also not necessary. In the following, our approach is outlined in more detail for the example for the
station cluster around Granja Kcayra, near Cusco (13.56◦S,
71.88◦W, 3219 m a.s.l.; data record back to 1965).
In the vicinity of the station Granja Kcayra, two additional data sources provide time series of climate variables; the Me-teorological Aerodrome Records (METARs) and data from the National Climate Data Center (NCDC) for Cusco
Air-port (13.54◦S, 71.94◦W, 3249 m a.s.l.). METAR-records can
be downloaded e.g. from NOAA (NOAA, 2011). These two additional data sources can be used for homogenization and data correction. As shown in Fig. 8, e.g. erroneous min-imum and maxmin-imum temperatures can be corrected. The METARs of Cusco Airport, unlike to most other airports worldwide, provide additional variables, such as hourly pre-cipitation sums. With this basis, e.g. daily prepre-cipitation val-ues wrong by the factor 10 can be detected and corrected.
Four more stations are situated within 50 km horizontal
distance and with less than 200 m elevation difference:
Acomayo (13.92◦S, 71.68◦W, 3160 m a.s.l.), Anta
An-cachuro (13.47◦S,72.22◦W, 3340 m a.s.l.), Paruro (13.77◦S,
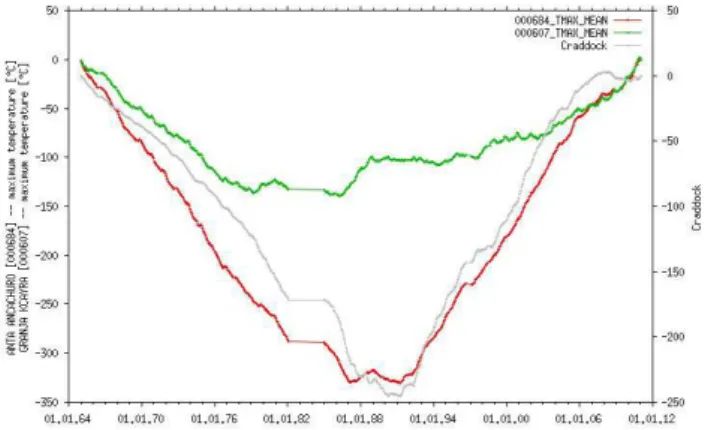
Figure 9. The craddock test (Craddock, 1979), as available in the PACC data portal shows a strong inhomogeneity in the Anta Ancachura-Granja Kcayra relation of monthly mean maximum temperature.
71.84◦W, 3084 m a.s.l.) and Paucartambo (13.32◦S, 71.59◦W, 3042 m a.s.l.).
The homogeneity of the station cluster can than be checked with the data portal by forming station couples and applying the craddock test (Craddock, 1979). Figure 9 shows the result of the Craddock test for maximum tem-perature of the station couple Granja Kcayra vs. Anta An-cachuro. A strong inhomogeneity for the values before and after March 1988 is indicated by the strong deviation of the cumulative deviation from average. As the station couple Paucartambo vs. Anta Ancachuro also shows this inhomo-geneity, but not Paucartambo vs. Granja Kcayra, or Acomayo vs. Granja Kcayra, it is very likely that maximum tempera-ture at Anta Ancachuro is not homogeneous before and af-ter March 1988. Consequently, the time series of Anta
An-cachuro is homogenized by adding the monthly mean diff
er-ences between March 1988 and 2010 to the respective mean maximum temperature of the other stations. Precipitation is homogenized in a similar way using the respective quotients of the monthly sums between the stations to be homogenized and the reference station cluster. As also stated by Brunetti et al. (2006), it is problematic to homogenize small breaks (craddock curve deviates only slightly from straight line) with no indication from metadata. Therefore, small breaks are not homogenized here, neither.
3 Trend analysis for the station Granja Kcayra,
Cusco
M. Schwarb et al.: A data portal for regional climatic trend analysis 225
Figure 10. Air temperature and linear and gaussian low-pass filtered trends for the homogeneous time series of Granja Kcayra (−13.56◦S,
−71.88◦E, 3219 m a.s.l.). Linear trend is 0.3◦C decade−1 between 1965 and 2010. This trend is significant
at the 0.02 level with Mann-Kendall test.
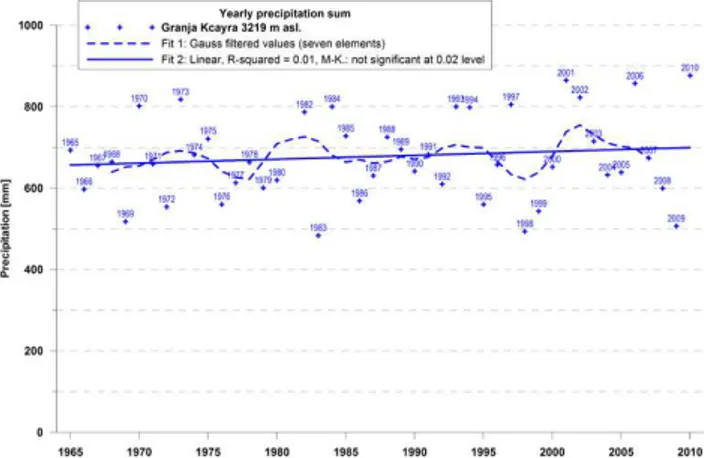
Figure 11. Yearly precipitation sum and linear and gaussian low-pass filtered trends for the homogeneous time series of Granja Kcayra (−13.56◦S,−71.88◦E, 3219 m a.s.l.). Linear trend between
1965 and 2010 is not significant at the 0.02 level with Mann-Kendall test.
1965 and 1988 (Fig. 10). Yearly precipitation sums show vir-tually no trend for the mentioned period, but a considerable year-to-year variation of up to about 400 mm, the long-term mean being around 700 mm (Fig. 11).
Putting these trends in a more continental/global
con-text, we can state that from visual comparison the linear air temperature trends found so far found for the Cusco area are in line with the large-scale global air
tempera-ture trends (IPCC, 2007). Compared to observed trends
e.g. in Europe, the trends for Cusco are however lower. The trend of the mean yearly air temperature in Granja
Kcayra is about 0.30◦C decade−1for 1965 to 2010, whereas
e.g. for Zurich-Fluntern (Switzerland) the respective trend is
0.43◦C decade−1for the same period (MeteoSchweiz, 2011).
The lower trend of Granja Kcayra air temperature may be related the so called “global dimming” or “decreasing clear sky visibility over land” in the last few decades, as described e.g. in Wild (2009) or in Wang et al. (2009). While there was a “European brightening” since the mid-80s, global dimming continued, particularly over Asia, South America, Australia and Africa.
Regarding precipitation sums, it seems that there is a slight increase since mid 1960s for Cusco (Fig. 11). However, this very weak trend is not significant with a Mann-Kendall test at 0.02 level. In the central Andes region, wet season precip-itation is rather depending on large scale wind conditions in the upper troposphere than on ENSO as stated e.g. by Lenters and Cook (1999); Garreaud and Aceituno (2001) and Rohrer et al. (2010). So, the rather pronounced year-to-year vari-ations in precipitation may be correlated to the continental upper air wind regime.
4 Conclusion and perspectives
The challenges of adapting to adverse impacts of climatic changes require solid data baselines on regional to local scales. In mountain regions, where impacts are expected to be particularly high and the adaptive capacity of the people is often low, reliable long-term climate time series are rare and spatial and temporal data coverage is typically low. There-fore, straightforward tools and methods are needed, to gen-erate a data baseline, that is, reliable long-term climate time series. Here, we presented a data portal tool, developed in the frame of the PACC program. We found the data por-tal a particularly valuable tool for data collection, screening, homogenization and distribution. The study also shows that search for alternative data (e.g. METAR) can be well worth as they can serve as important data sources in a data quality control, interpolation and homogenization process.
Our experience has furthermore shown, that a common cli-mate data platform such as the described data portal can ful-fil an important role for interdisciplinary research in climate change adaptation. It also stimulates an enhanced open in-teraction between various government agencies involved in planning adaptation measures. In this sense, our data portal approach could be a model case for other adaptation projects at the local to national level, especially in developing coun-tries.
Currently, the portal is open for PACC collaborators only, for ongoing studies in the fields of hydrology, food security, and disaster risk reduction. In future, however, it might be-come accessible also for a wider scientific community.
Acknowledgements. We thank the Swiss Agency for Develop-ment and Cooperation (SDC) and the Ministry of EnvironDevelop-ment of Peru for enabling the studies on which this work is based through the Programa de Adaptacion al Cambio Climatico (PACC) in Peru.
Edited by: M. Brunet-India
Reviewed by: three anonymous referees
The publication of this article is sponsored by the Swiss Academy of Sciences.
References
Appenzeller, C., Begert, M., Zenklusen, E., and Scherrer, S. C.: Monitoring climate at Jungfraujoch in the high Swiss Alpine re-gion, Sci. Total Environ., 391, 262–268, 2008.
Auer, I., B¨ohm, R., Jurkovic, A., Lipa, W., Orlik, A., Potzmann, R., Sch¨oner, W., Ungersb¨ock, M., Matulla, C., Briffa, K., Jones, P. D., Efthymiadis, D., Brunetti, M., Nanni, T., Maugeri, M., Mercalli, L., Mestre, O., Moisselin, J. M., Begert, M., M¨uller-Westermeier, G., Kveton, V., Bochnicek, O., Stastny, P., Lapin, M., Szalai, S., Szentimrey, T., Cegnar, T., Dolinar, M., Gajic-Capka, M., Zaninovic, K., Majstorovic, Z., and Nieplova, E.: HISTALP – Historical Instrumental Climatological Surface Time Series of the Greater Alpine Region, Int. J. Climatol., 27, 17–46, 2007.
Begert, M., Schlegel, T., and Kirchhofer, W.: Homogeneous tem-perature and precipitation series of Switzerland from 1864 to 2000, Int. J. Climatol., 25, 65–80, 2005.
Brunetti, M., Maugeri, M., Monti, F., and Nanni, T.: Temperature and precipitation variability in Italy in the last two centuries from homogenised instrumental time series, Int. J. Climatol., 26, 345– 381, 2006.
Buishand, T.: Some methods for testing the homogeneity of rainfall records, J. Hydrol., 58, 11–27, 1982.
Craddock, J. M.: Methods of comparing annual rainfall records for climatic purposes, Weather, 34, 332–346, 1979.
Daly, C., Neilson, R. P., and Phillips, D. L.: A Statistical-Topographic Model for Mapping Climatological Precipitation over Mountainous Terrain, J. Appl. Meteor., 33, 140–158, 1994. Garreaud, R. D. and Aceituno, P.: Interannual rainfall variability over the South American Altiplano, J. Clim., 14, 2779–2789, 2001.
Groves, D. G., Yates, D., and Tebaldi, C.: Developing and ap-plying uncertain global climate change projections for regional water management planning, Water Resour. Res., 44, W12413, doi:10.1029/2008WR006964, 2008.
IPCC: The Physical Science Basis. Contribution of Working Group I to the Fourth Assessment Report of the Intergovernmental Panel on Climate Change, edited by: Solomon, S., Qin, D., Manning, M., Chen, Z., Marquis, M., Averyt, K. B., Tignor, M., and Miller, H. L., Cambridge University Press, Cambridge UK, 235–336, 2007.
KNMI Climate Explorer: http://climexp.knmi.nl/, last access: 21 December 2010.
Lenters, J. D. and Cook, K. H.: Summertime precipitation variabil-ity over South America: Role of large-scale circulation, Mon. Weather Rev., 127, 409–431, 1999.
MeteoSchweiz: http://www.meteoschweiz.admin.ch/web/de/klima/ klima heute/homogene reihen.html, last access: 20 April 2011. NASA-GISS: http://data.giss.nasa.gov/, last access: 21 December
2010.
NOAA: ftp://tgftp.nws.noaa.gov/data/observations/metar, last ac-cess: 12 July 2011.
Peterson, Th., Russell, C., and Vose, S.: An Overview of the Global Historical Climatology Network Temperature Database, B. Am. Meteorol. Soc., 78, 2837–2849, 1997.
Rohrer, M., Acu˜na, D., Calanca, P., Huggel, C., Konzelmann, T., Salzmann, N., Schwarb, M., and Silvestre, E.: Dependence of wet season precipitation in the Central Andes on Pacific-SST anomaly patterns, tropospheric temperature, pressure and hu-midity fields, Poster presented during the American Geophys-ical Union Meeting of the Americas, 8–12 August 2010, Foz de Iguassu, Brasil, http://www.meteodat.ch/pdf/AGUFOZ.pdf, 2010.
Schneider, S. H., Semenov, S., Patwardhan, A., Burton, I., Mag-adza, C. H. D., Oppenheimer, M., Pittock, A. B., Rahman, A., Smith, J. B., Suarez, A., and Yamin, F.: Assessing key vulnera-bilities and the risk from climate change, Climate Change 2007: Impacts, Adaptation and Vulnerability, Contribution of Working Group II to the Fourth Assessment Report of the Intergovernmen-tal Panel on Climate Change, edited by: Parry, M. L., Canziani, O. F., Palutikof, J. P., van der Linden, P. J., and Hanson, C. E., Cambridge University Press, Cambridge, UK, 779–810, 2007. Salzmann, N., Huggel, C., Calanca, P., D´ıaz, A., Jonas, T., Jurt,
C., Konzelmann, T., Lagos, P., Rohrer, M., Silverio, W., and Zappa, M.: Integrated assessment and adaptation to climate change impacts in the Peruvian Andes, Adv. Geosci., 22, 35–39, doi:10.5194/adgeo-22-35-2009, 2009.
Scheel, M. L. M., Rohrer, M., Huggel, C., Santos Villar, D., Sil-vestre, E., and Huffman, G. J.: Evaluation of TRMM Multi-satellite Precipitation Analysis (TMPA) performance in the Cen-tral Andes region and its dependency on spatial and tempo-ral resolution, Hydrol. Earth Syst. Sci. Discuss., 7, 8545–8586, doi:10.5194/hessd-7-8545-2010, 2010.
Wang, K., Dickinson, R. E., and Liang, S: Clear Sky Visibility Has Decreased over Land Globally from 1973 to 2007, Science, 323, 1468–1470, 2009.
Wild, M: Global dimming and brightening: A review, J. Geophys. Res., 114, 1–31, 2009.