www.nat-hazards-earth-syst-sci.net/13/2717/2013/ doi:10.5194/nhess-13-2717-2013
© Author(s) 2013. CC Attribution 3.0 License.
Natural Hazards
and Earth System
Sciences
The role of GIS in urban seismic risk studies: application to the city
of Almería (southern Spain)
A. Rivas-Medina, J. M. Gaspar-Escribano, B. Benito, and M. A. Bernabé
ETSI Topografía, Geodesia y Cartografía, Universidad Politécnica de Madrid, Madrid, Spain
Correspondence to:J. M. Gaspar-Escribano (jorge.gaspar@upm.es)
Received: 31 July 2012 – Published in Nat. Hazards Earth Syst. Sci. Discuss.: – Revised: 27 May 2013 – Accepted: 12 June 2013 – Published: 5 November 2013
Abstract.This work describes the structure and character-istics of the geographic information system (GIS) developed for the urban seismic risk study of the city of Almería (south-ern Spain), identifying the stages in which the use of this tool proved to be very beneficial for adopting informed decisions throughout the execution of the work.
After the completion of the regional emergency plans for seismic risk in Spain and its subsequent approval by the National Civil Defence Commission, the municipalities that need to develop specific local seismic risk plans have been identified. Hence, the next action is to develop urban seismic risk analyses at a proper scale (Urban Seismic Risk Evalua-tion – Risk-UR).
For this evaluation, different factors influencing seismic risk such as seismic hazard, geotechnical soil characteristics, vulnerability of structures of the region, reparation costs of damaged buildings and exposed population are combined. All these variables are gathered and analysed within a GIS and subsequently used for seismic risk estimation. The GIS constitutes a highly useful working tool because it facilitates data interoperability, making the great volume of information required and the numerous processes that take part in the cal-culations easier to handle, speeding up the analysis and the interpretation and presentation of the results of the different working phases.
The result of this study is based on a great set of vari-ables that provide a comprehensive view of the urban seis-mic risk, such as the damage distribution of buildings and dwellings of different typologies, the mean damage and the number of uninhabitable buildings for the expected seismic motion, the number of dead and injured at different times of the day, the cost of reconstruction and repair of buildings,
among others. These results are intended for interpretation and decision making in emergency management by unspe-cialised users (Civil Defence technicians and managers).
1 Introduction
The Spanish Basic Directive of Civil Defence against Seismic Risk (DBPCRS, 1995, and its modification, Mod DBPCRS, 2004) discloses the guidelines for the develop-ment of region-specific risk studies that must be applied to 12 of Spain’s autonomous communities. They also indicated the conditions for the preparation of municipal-scale emer-gency plans. Andalusia, located in southern Spain, is one of those communities, and its regional emergency plan (the SIS-MOSAN plan) was approved in 2008. The SISSIS-MOSAN plan determined that one of the Andalusian cities that required an urban-scale seismic risk plan was Almería. This implies that the focus of the risk study needs to be narrowed from the entire region of Andalusia to the city of Almería, entailing the realisation of a new study at a scale of greater detail. At the same time, the goal and the approach followed in both types of risk study differ: in the first case, the goal was find-ing the municipalities with the greatest risk of the region. In the urban risk study, the objective is assessing the degree of expected losses associated with different seismic scenarios that may be considered for the city.
several destructive events, such as the 1522 event, with an EMS intensity of IX and 2500 fatalities, and others of lower intensity in 1487 and 1658. Since about 1960, no earth-quake has been registered with magnitude higher than 4.5, al-though they have occurred in neighbouring cities with similar seismotectonic environment (Adra in 1993 withMw=5.0). The last seismic activity was registered on July 2010, with about 80 microearthquakes (Mw: 1.5–3.5) in the Alborán Sea, 15 km from the city. Several neotectonic and palaeo-seismic studies indicate that the area is active and contains seismic sources capable of producing earthquakes of con-siderable magnitudes (Martínez-Díaz and Hernández-Enrile, 2004; Gracia et al., 2006).
The risk potential of Almería makes this city suitable for the development of the present study. The use of geographic information system (GIS) in the assessment of this type of risks has been a common practice in recent years. Some ex-amples of application can be found in the following projects: the RISMUR Project (Benito et al., 2008), the SISMOSAN Project (Benito et al., 2007), and the RISNA Project (Rivas-Medina et al., 2010), among others. At the urban level, the city of Barcelona (Lantada et al., 2003) has been used to carry out the last seismic risk studies. Here the importance of the use of this type of tools in the assessment of the vul-nerability of a city stands out.
2 Objectives
The objective of this article is to show how a GIS can help to estimate and understand an urban seismic risk study, in this case of the city of Almería. The objective of using a GIS in the study is to facilitate the interpretation of the calculation variables and project results. Moreover, it is actively used as a calculation tool in some phases of the study, such as the geographical assignment of vulnerability.
3 The RISK-UR GIS
The development of a seismic risk study is a multidisci-plinary task that counts on the participation of geologists, seismologists, engineers and architects. Hence, it requires the integration of a large set of heterogeneous information: data of different nature with varying size and formats. The GIS plays a fundamental role as a common storage space that allows the consistent homogenisation of all these data. Hence, the use of a GIS facilitates the joint analysis of all the involved and guides the decisions adopted in the execu-tion of this study. Addiexecu-tionally, the GIS facilities for the car-tographic representation of the variables and results of the study are especially efficient for the monitoring and interpre-tation of all the stages of the risk analysis, particularly for end users such as emergency managers, etc.
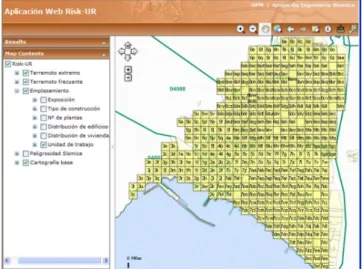
Fig. 1.Web visualiser showing the working units.
3.1 GIS characteristics
The main characteristics of the GIS used in the development of the seismic risk analysis of Almería are described in this section.
3.1.1 Working unit
The working unit is the geographical entity in which the cal-culations will be computed, hereby controlling the geograph-ical resolution of the study. The definition of the working unit depends strongly on two factors: the geographical unit in which the original data are expressed and the scale of the study. In the present urban-scale seismic risk study, a 200 m squared grid was considered appropriate to cover the entire city of Almería (Fig. 1), totalling an amount of 400 equal cells or working units. This size of the working unit is com-patible with the size in which the original data are provided – small enough to detect lateral variations of the outputs and big enough to save computation time.
3.1.2 Reference system
For the realisation of this study, the ETRS89 (European Ter-restrial Reference System, 1989) was adopted, coinciding with the official reference system of Spain.
3.1.3 Working tool
3.2 Initial information
The data used in the risk study comprise different types of information from different sources:
– Seismic data encompass all data required to reproduce the seismic ground motion expected in the city:
– Data on active faults that are considered to char-acterise the source for each earthquake scenario considered. These are obtained for the Quater-nary Active Faults Database of Iberia (IGME, 2011). It is a vector layer, in polyline format. – Seismic catalogue is used to relate the location
and size of past earthquakes with actual active sources. It is a vector layer in point format ob-tained from the Spanish Instituto Geográfico Na-cional (IGN, 2011).
– The maps of maximum expected ground mo-tions of previous studies (Benito et al., 2010) and the hazard-consistent controlling earthquakes are obtained by hazard deaggregation for Almería (Gaspar-Escribano et al., 2010).
– Microzonation map of Almería is in terms of the po-tential ground motion amplification due to site effects, as derived by the analysis of data such as subsoil structure and soil characteristics, predominant periods, and average shear-wave velocities in the uppermost 30 m-thick layer (VS30 values) (Navarro et al., 2001; Gaspar-Escribano et al., 2010). This is a vector layer, in format polygon.
– Cadastral data are used for assigning vulnerability classes to buildings and for constraining the amount of exposed building occupants and human and eco-nomic losses. These data include the cadastral value, number of buildings and dwellings, built area, year of construction and land use. This information is ob-tained from the General Directorate for Cadastre (http: //www.catastro.meh.es/).
– Population data of the city, obtained from the Na-tional Statisics Institute (INE, http://www.ine.es/en/ welcome.shtml). as a vector layer, help to estimate the population exposed in each census tract.
– Administrative data are used for the cartographic ref-erence and include districts, census tracts, toponomy and other geographic data concerning the study zone and surroundings. These data are vector layer obtained from IGN.
4 Role of the GIS in the phases of the risk assessment study
An urban seismic risk study comprises several phases: defini-tion of the seismic acdefini-tion, assessment of seismic vulnerabil-ity distribution, expected damage estimation and calculation of human and economic losses. The GIS plays a role as a useful tool in this scheme, as shown in the following section.
4.1 In the seismic hazard evaluation
Several earthquake scenarios can be envisaged to define the seismic action for the seismic risk assessment of Almería. Deterministic approaches addressing a worst-case scenario would consider the strongest earthquake likely to occur in the surrounding areas, regardless of its occurrence probabil-ity. Such a devastating event could be a magnitude 7.0 (or above) earthquake related to the rupture of the Carboneras fault or another seismogenic fault located in the Alboran Sea and along the northern African coast. The rupture of offshore fault segments could also generate a tsunami wave that would enhance the damage (Álvarez-Gómez et al., 2011).
Probabilistic approaches would include the definition of hazard-consistent earthquake scenarios derived through haz-ard deaggregation. The resulting controlling earthquakes are those presenting the highest hazard contribution to pre-scribed ground motion levels. This is the approach followed in this study because it allows specifying a meaningful prob-ability level to the seismic action.
Thus, the results of the regional seismic hazard study of Andalusia obtained in the SISMOSAN Project (Benito et al., 2010) were deaggregated for two hazard-consistent tar-get motions, corresponding to the expected peak ground ac-celerations (PGAs) and spectral acac-celerations (SAs) for ex-ceedance probability levels of 0.1 in 50 and 100 yr (Gaspar-Escribano et al., 2010). These levels coincide with the re-turn periods of 500 and 1000 yr prescribed in the Spanish seismic code NCSE-02 for the earthquake-resistant design of normal- and special-importance structures. According to hazard deaggregation results, two controlling earthquakes were obtained, which we refer to as frequent and extreme earthquakes, respectively. These earthquakes, consistent with the results of the probabilistic seismic hazard approach, are used to establish deterministic seismic scenarios at urban scale. No references to tsunami-related damages are included in the calculations.
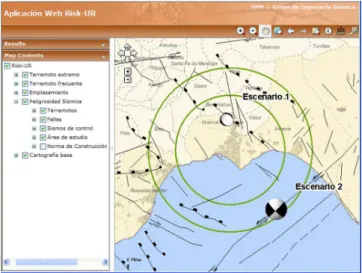
Fig. 2.Web visualiser with the two studied seismic scenarios. The location areas of the control earthquakes are indicated in green.
controlling earthquakes (Martínez-Díaz, 2000; Silva et al., 2003; Martínez-Díaz and Hernández-Enrile, 2004; Marín-Lechado et al., 2005; Martínez-Martínez et al., 2006; Gracia et al., 2006; Sanz de Galdeano et al., 2006; Reicherter and Hübscher 2007).
In this phase of the study, the use of the GIS was very use-ful as it enabled, within the same visualisation environment, the joint inspection of the influence areas of the controlling events, the geometry and location of active faults within the influence area and the distribution of seismicity. In this way it was easy to find the active faults at source-to-site distances consistent with controlling distances as well as those capable of generating earthquakes with magnitudes consistent with controlling magnitudes (Fig. 2).
According to the outcome of this analysis, the frequent earthquake scenario corresponds to a magnitude 5.0 event generated in a normal fault limiting the lower basin of the Andarax River and located at short distances (5 km). The extreme event scenario is associated with a magnitude 6.5 earthquake generated in the marine segment of the strike-slip Carboneras fault, located about 15 km from Almería. This choice of studying two hazard-consistent scenarios would provide insightful results on expected damage trends, and should be regarded as some of the realistic scenarios that can be put forward to estimate urban seismic risk in Almería.
Next, the ground motion corresponding to the two selected scenarios in Almería should be characterised. For this pur-pose it is necessary to use a ground motion prediction equa-tion (GMPE) that allows estimating the ground moequa-tion at a given site as a function of source-to-site distance, earthquake magnitude, faulting style and other geometric characteristics of the fault, among other parameters. Additionally, several site-specific parameters, such asVS30 values, are provided. Due to the absence of equations for the prediction of spec-tral accelerations derived for the study area, a combination
of recent empirical GMPEs developed for different regions of the world are used in this study (Berge-Thierry et al., 2003; Ambraseys et al., 2005; Akkar and Bommer, 2010; Abra-hamson and Silva, 2008; Iddriss, 2008; Chiou and Youngs, 2008; Campbell and Bozorgnia, 2008; Boore and Atkinson, 2008). For each model, the data of each seismic scenario are introduced, at least including the magnitude, the source placement distance and the ground type.
The estimations of all the models are weighted to provide a single specific response spectrum at the different city place-ments, including their characteristic soil type. With the GIS we can examine how each model acts and the influence of the ground in the amplification of the final acceleration. For instance, Fig. 3 shows the expected PGA associated with the frequent event, as predicted by the different GMPEs consid-ered. Two effects primarily control the distribution of pre-dicted PGA values: the amplification due to site effects, more patent in the area covered by softer soils (south-eastern part of the city), and the source-to-site distance, which is the pre-dominant effect at these very short distances (below about 7 km) and displays a decay of expected PGA values from the source (located to the north-east of the city limits) towards the south-east.
Not only PGA values are used to characterise the seismic ground motion in the risk study. The full response spectrum at each site is calculated and subsequently used as the seis-mic action associated with each seisseis-mic scenario, represent-ing the demand spectrum for the exposed structures at each site.
4.2 In the vulnerability assessment and exposure estimation
The city information used in this study was obtained from the the General Directorate for Cadastre, a public institution providing the Spanish cadastral information through a spa-tial data infrastructure, assisting in the queries of multiple attributes of the cadastral units of a city.
Land use, uses of the building, surface built for each use, dwellings in the building, number of floors and date of con-struction were extracted from the available information. The study area was selected, and the queries were made with KML files. In order to make iterative queries to cadastral units different than the working unit, a querying programme for the information web environment was created. The re-sult of the queries was a database with the cadastral registers found in the study area.
Fig. 3. Expected acceleration in Almería according to different
at-tenuation models.
of dwellings in this area. Figure 5 shows that most of these buildings (more than five floors) were built in the 1970s, co-inciding with a great increment in the number of dwellings in the city. Presumably they should be reinforced concrete (RC) constructions, and therefore only slightly vulnerable.
The assignment of vulnerability to the structures of Almería was carried out considering the type of construc-tion and seismic resistant design of the structure, related to their year of construction and the number of floors. For this purpose the Risk-UE classification was used (Lungu et al., 2001). The distribution of masonry and reinforced concrete per working unit is shown in Fig. 6.
Fig. 4. Geographic distribution of buildings and dwellings per
working unit. Geographic distribution of the average number of floors of the buildings per working unit.
Fig. 6.Web visualiser image showing the distribution of masonry (yellow) and reinforced concrete (green) in every working unit.
According to Murphy (2010), the real estate in Almería is made up essentially of four types of buildings: regular masonry wall structure and wooden framework without di-aphragm effect (M11), wall structure of brick and wooden framework without diaphragm effect (M31), wall brick struc-ture and reinforced concrete framework with diaphragm ef-fect (M34) and reinforced concrete portico-like structure (RC1). Their vulnerability also varies depending upon the number of storeys and the level of earthquake-resistant de-sign. Buildings are classified as low-rise (L), medium-rise (M) and high-rise (H) as they have up to 2 storeys, 3 to 5 storeys, and 6 or more storeys, respectively. They are di-vided into pre-code, low-code and high-code depending on their null, low or high level of seismic design. Combining these three categories, namely building typology, number of storeys and level of earthquake-resistant design, differ-ent vulnerability classes may be defined. A total of 12 dif-ferent vulnerability types are found in Almería: M11L-pre, M11M-pre, M31L-pre, M31M-pre, M34L-pre, M34M-pre, M34H-pre, RC1M-pre, RC1H-pre, RC1L-low, RC1M-low and RC1H-low. Note that the three first characters denote the building type; the fourth character refers to the number of storeys and the last ones to the level of earthquake-resistant design, respectively.
Figure 7 shows the distribution of buildings and dwellings per building typology in Almería. About 65 % of the build-ings are masonry structures and 35 % reinforced concrete. Additionally, the amount of masonry buildings and dwellings is similar, indicating that most masonry buildings correspond to single dwelling buildings. By contrast, the number of dwellings sited on RC buildings is much larger than the num-ber of RC buildings. The largest proportion of dwellings of Almería (77 %) is located in RC buildings. Since con-crete buildings are less vulnerable, one may expect a smaller
Fig. 7.Distribution of buildings (in red) and dwellings (in blue) per
vulnerability class in the city of Almería. See text for more infor-mation.
Fig. 8.Web visualiser image showing the distribution of the popu-lation within the city.
number of victims (due to the breakdown of dwellings in res-idential RC buildings) during night-time earthquakes.
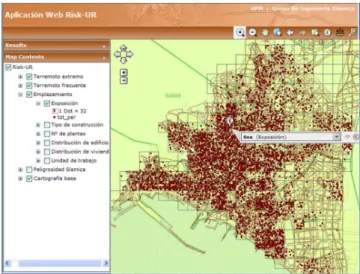
After having identified the vulnerability of the existing building typologies in the city, the other parameters affecting risk such as the distribution of the population within the city should be included. This parameter represents exposure and it is necessary to estimate the victims. Human exposure was retrieved from the INE database. Figure 8 shows the popula-tion distribupopula-tion in Almería.
4.3 In damage and loss assessment
Fig. 9.Web visualiser image showing damage distribution by city
sectors with an extreme event.
buildings) and degree of losses (human and economic) for the previously defined seismic scenario.
To determine expected damage to structures, the ca-pacity spectrum method was followed, using the caca-pacity and fragility curves proposed by Lagomarsino and Giov-inazzi (2005). The capacity spectrum of each building was compared with the demand spectrum at each working unit. The intersection of these curves gives the performance point. For each performance point, a distribution of damage can be obtained from the building-specific fragility curves. The different degrees of physical damage considered are null, slight, moderate, extensive and complete. The description of each one of them may be looked up in Milutinovic and Trendafiloski (2003). Figure 9 shows the damage distribu-tion in Almería caused by the extreme earthquake scenario. Spatial variations of buildings exposed and undergoing dam-age can be appreciated. Note that whereas total amount of damaged buildings is smaller in the south-western part of the city (the closest one to the earthquake source), the rel-ative amounts of moderate, extensive and complete damage are higher. This exemplifies the advantages of using a GIS also in the interpretation and analysis of results. In addition to the number of damaged buildings, two other indicators of physical damage are provided in this study: the number of uninhabitable buildings and the metric tons of rubble gener-ated by the shaking.
The losses may be classified into two groups: human losses (fatalities and injured people) due to the breakdown of buildings, and monetary losses concerning the costs of re-construction and repair of damaged structures.
To estimate the number of people affected, the empiri-cal model of Coburn and Spence (2002) was used. The cost of losses was evaluated from the mean cadastral value of Almería (as given by the General Directorate for Cadastre), which defines the value of full building construction. The
cost of repairing extensive, moderate and slight damage is based on the cost of reconstruction (Vacareanu et al., 2004).
5 Dissemination: web application
As indicated in the previous section, the result of this study comprises a large set of variables which provide a compre-hensive view of the urban risk. These results are intended for interpretation and decision taking of (eventually) non-specialised personnel, such as economic managers, politi-cians and civil defence technipoliti-cians whose final objective is to assess the possible emergency derived from a future disas-ter. For this reason the accurate transmission of the results is considered an especially important part within the study.
Having in mind the nature of the resulting variables and the need of conveying them in an intuitive, easy-to-interpret manner, it was decided to create a collection of maps and ta-bles to show the partial and end results of the study. In this context and with the idea of facilitating their access to the end users, a web visualiser was created. This web applica-tion supports access to the database through guided queries, and it also facilitates access to the geographic information providing a dynamic view of the seismic risk of the city.
For each seismic scenario (frequent seism and extreme seism), the following information is presented:
– Number and distribution of buildings predicted to end up with a different type of damage (slight, moderate, extensive and complete (Fig. 9).
– Number of dwellings predicted to end up uninhabit-able and number of persons who would remain home-less.
– Number of victims (dead and injured) predicted de-pending on the time of occurrence of the earth-quake (three possible “subscenarios”: 10:00 19:00 and 02:00 LT).
– Expected costs due to repair and reconstruction of buildings.
– Estimated metric tons of rubble due to destruction of buildings.
The combination of these parameters allows obtaining a hier-archy of zones in need of more or less help when faced with a possible seismic emergency.
The web application was divided into 5 different working spaces (Fig. 9) to make its handling easier.
– Scenario 1 displays the results of the seismic risk study for the frequent earthquake scenario.
– Site shows the characteristics of the city under study, including vulnerability class, exposure estimates and soil type of each working unit.
– Seismic hazard shows expected ground motions, active faults of the influence area, and the location of control-ling earthquakes.
– Base cartography contains the base cartography of the zone through web map service (WMS) links to spa-tial data infrastructures of official institutions, includ-ing the General Directorate for Cadastre, WMS of the Spanish Spatial Data Infrastructure (IDEE in the Span-ish acronym) and WMS of CartoCiudad.
6 Conclusions
The GIS has remarkably contributed to the realisation of the objectives of this study. In this respect, three main points must be highlighted: (1) the capability of the GIS in as-sisting data compilation, organization in working units, geo-referencing and display in a common environment; (2) the usefulness for making spatial analysis of input variables and results, which help to understand the relations between in-puts and outin-puts of the study; (3) the usefulness of develop-ing a GIS-based web application which would facilitate the analysis of results by different end users, not necessarily spe-cialised in risk calculations. More specifically, other aspects in which the GIS led to a more insightful analysis include the following:
– In decision making, when defining the seismic scenar-ios associated with the controlling earthquakes and the seismotectonic framework of the influence area. – In the acquisition of information from the General
Directorate for Cadastre, when using the spatial data infrastructure of the Cadastre, integrating it into the database of the project, and assigning vulnerability classes to the buildings contained in the working units. – In the integration of all the inputs of the study for the estimation of risk, such as hazard results, geotechnical characteristics of the ground, the vulnerability and the exposure of working units.
– In the interpretation of the studied variables, enabling the understanding of the influence and spatial distri-bution of each variable through the whole calculation process.
– In the analysis of the final results.
– In the dissemination of the results through a web map visualiser, enabling anybody interested in the study to see the results remotely, without the need to rely on or know how to handle a specific GIS programme.
Acknowledgements. The present study has been partly funded by the research project “Análisis de sensibilidad a la peligrosidad sísmica incorporando resultados de estudios recientes de tectónica activa en Centroamérica. Aplicación a la mitigación del riesgo sísmico en el SE de España”, reference CGL2009-14405-C02-01, of the Spanish Ministry of Science and Innovation. We are especially grateful to M. Navarro for the estimation of the local effect, to P. Murphy for the estimation of the vulnerability, to D. Navarro for obtaining the cadastral database, to L. E. Quirós for the estimation of the physical damage, and to Y. Torres for the estimation of the monetary and human losses. The authors acknowledge the constructive reviews of N. Chachava and two anonymous reviewers, which notably enriched the document.
Edited by: R. Crockett
Reviewed by: N. Chachava and two anonymous referees
References
Abrahamson, N. A. and Silva, W. J.: Summary of the Abrahamson & Silva NGA ground-motion relations, Earthq. Spectra, 24, 67– 97, 2008.
Akkar, S. and Bommer, J. J.: Prediction of elastic displacement response spectra in Europe and the Middle East, Earthq. Eng. Struct. Dyn., 36, 1275–1301, 2008.
Álvarez-Gómez, J. A., Aniel-Quiroga, ´l., Gonález, M., and Otero, L.: Tsunami hazard at the Western Mediterranean Spanish coast from seismic sources, Nat. Hazards Earth Syst. Sci., 11, 227– 240, doi:10.5194/nhess-11-227-2011, 2011.
Ambraseys, N. N., Douglas, J., Sarma, S. K., and Smit, P. M.: Equa-tions for the Estimation of Strong Ground MoEqua-tions from Shallow Crustal Earthquakes Using Data from Europe and the Middle East: Horizontal Peak Ground Acceleration and Spectral Accel-eration, Bull. Earthquake Eng., 3, 1–53, 2005.
Benito, B., Jiménez, E., García-Rodríguez, M. J., Gaspar-Escribano, J. M., Pastor, J. A., Navarro, M., and Murphy, P.: Eval-uación de la peligrosidad y el riesgo sísmico en Andalucía, Final Report of the SISMOSAN Project, 4, 164 pp., 2007.
Benito, B., Gaspar-Escribano, J. M., Martínez-Díaz, J. J., García-Rodríguez, M. J., Jiménez Peña, E., Canora, C., and Álvarez-Gómez, J. A.: The RISMUR Project: Seismic Risk Assessment of the Murcia Province (SE Spain), Boll. Geof. Teor. Appl., 49, 3–15, 2008.
Benito, B., Navarro, M., Vidal, F., Gaspar-Escribano, J. M., García-Rodríguez, M. J., and Martínez-Solares, J. M.: A new seismic hazard assessment in the region of Andalusia (Southern Spain), Bull Earthq. Eng., 8, 739–766, 2010.
Berge-Thierry, C., Cotton, F., Scotti, O., Griot-Pommera, D. A., and Fukushima, Y.: New Empirical Response Spectral Attenuation Laws for Moderate European Earthquakes, J. Earthquake Eng., 7, 193–222, 2003.
Boore, D. M. and Atkinson, G. M.: Ground-motion prediction equa-tions for the average horizontal component of PGA, PGV, and 5 %-damped PSA at spectral periods between 0.01 s and 10.0 s, Earthq. Spectra, 24, 99–138, 2008.
Chiou, B. and Youngs, R. R.: An NGA model for the average hor-izontal component of peak ground motion and response spectra, Earthq. Spectra, 24, 173–215, 2008.
Coburn, A. W. and Spence, R. J.: Earthquake Protection, 2nd Edn., John Wiley & Sons, Chichester, UK, 2002.
Gaspar-Escribano, J. M., Navarro, M., Benito, B., García-Jerez, A., and Vidal, F.: From regional- to local-scale seismic hazard as-sessment: examples from Southern Spain, Bull. Earthquake Eng., 8, 1547–1567, 2010.
Gracia, E., Pallas, R., Soto, J. I., Comas, M., Moreno, X., Masana, E., Santanach, P., Diez, S., Garcia, M., Danobeitia, J., and Sci-entific Party HITS: Active faulting offshore SE Spain (Albo-ran Sea): implications for earthquake hazard assessment in the Southern Iberian Margin, Earth Planet. Sci. Lett., 241, 734–749, 2006.
Idriss, I. M.: An NGA empirical model for estimating the horizontal spectral values generated by shallow crustal earthquakes, Earthq. Spectra, 24, 217–242, 2008.
IGME: Online Database of the IGME (Instituto Geológico y Minero Español), QAFI v2.0., available at: http://www.igme. es/infoigme/aplicaciones/qafi/ (last access: 20 December 2011), 2011.
IGN: Database online of the IGN, (Instituto Geográfico Nacional), available at: http://www.ign.es/ign/layout/sismo.do?locale=en (last access: 20 December 2011), 2011.
Lagomarsino, S. and Giovinazzi, S.: Macroseismic and mechanical models for the vulnerability assessment of current buildings, in: Bull. Earthquake Eng., special Issue: The RISK-UE project— methodology, edited by: Spence, R. and LeBrun, B., 2005. Lantada, N., Pujades, L., and Barbat, A.: Las herramientas SIG en el
análisis de vulnerabilidad y escenarios de riesgo, IX Conferencia Iberoamericana de SIG, VII Congreso Nacional de la AESIG, 2003.
Lungu, D., Aldea, A., Arion, A., Vacareanu, R., Petrescu, F., and Cornea, T.: WP1 report European distinctive features, inventory database and typology, RISK-UE project of the EC: an advanced approach to earthquake risk scenarios with applications to differ-ent European towns, 2001.
Marín-Lechado, C., Galindo-Zaldívar, J., Rodríguez-Fernández, L. R., Serrano, I., and Pedrera, A.: Active faults, seismicity and stresses in an internal boundary of a tectonic arc (Campo de Dalías and Níjar, southeastern Betic Cordilleras, Spain), Tectonophysics, 396, 81–96, 2005.
Martínez-Díaz, J. J.: Análisis sismotectónico de la serie sísmica de Adra: mecanismo de terremotos compuestos como respuesta a la interacción entre fallas activas en el sureste de la Cordillera Bética, Rev. Soc. Geol. España, 13, 31–44, 2000.
Martínez-Díaz, J. J. and Hernández-Enrile, J. L.: Neotectonics and morphotectonics of the southern Almería region (Betic Cordillera-Spain), Kinematic implications, Int. J. Earth Sci., 93, 189–206, 2004.
Martínez-Martínez, J. M., Booth-Rea, G., Azañon, J. M., and Tor-cal, F.: Active transfer fault zone linking a segmented extensional system (Betics, southern Spain): insight into heterogeneous ex-tension driven by edge delamination, Tectonophysics, 422, 159– 173, 2006.
Milutinovic, Z. V. and Trendafiloski, G. S.: Vulnerability of current buildings, September report 2003, RISK-UE, Work Package 4 An advanced approach to earthquake risk scenarios with appli-cations to different European towns, Nice, 2003.
Murphy, P.: Evaluación de la vulnerabilidad en Almería, Final re-port of the Risk-UR Project, 3, 2010.
Navarro, M., Enomoto, T., Sanchez, F. J., Matsuda, I., Iwatate, T., Posadas, A. M., Luzón, F., Vidal, F., and Seo, K.: Surface soil effects study using short-period microtremor observations in Almeria City, Southern Spain, Pure Appl. Geophys., 158, 2481– 2497, 2001.
Norma de la Construcción Sismorresistente Española (NCSE-02): Real Decreto 997/2002, of 27th September, whereby the standard of earthquake-resistant construction is approved: generalities and building (NCSR-02), Boletín Oficial del Estado, 2002.
Reicherter, K. and Hübscher, C.: Evidence for a seafloor rupture of the Carboneras Fault Zone (southern Spain): Relation to the 1522 Almeria earthquake?, J. Seismol., 11, 15–26, 2007.
Rivas-Medina, A., Gaspar-Escribano, J. M., Benito, B., and García-Rodríguez M. J.: Evaluación del riesgo sísmico con técnicas de información geográfica, Aplicación en Navarra, Mapping, 144, 6–18, 2010.
Romacho, M. J., García, J. M., Navarro, M., and Vidal, F.: Estudio preliminar de la sismicidad reciente de Almería, ISBN 84-8108-047-0, 235–260, 1994.
Sanz de Galdeano, C., Shanov, S., Galindo-Zaldívar, J., Radulov, A., and Nikolov, G.: Neotectonics in the Tabernas Desert (Almeria, Betic Cordillera, Spain), Geosciences, 2006, 75–79, 2006. Silva, P., Goy, J., Zazo, C., and Bardaji, T.: Fault-generated
Moun-tain fronts in southeast Spain: geomorphologic assessment of tec-tonic and seismic activity, Geomorphology, 50, 203–225, 2003. Vacareanu, R., Lungu, D., Aldea, A., and Arion C.: WP07, Report