Herpetologists' League
Allometric Analysis of the Ontogenetic Variation and Evolution of the Skull in Caiman Spix, 1825 (Crocodylia: Alligatoridae)
Author(s): Leandro R. Monteiro and Marcelo Soares
Source: Herpetologica, Vol. 53, No. 1 (Mar., 1997), pp. 62-69 Published by: Herpetologists' League
Stable URL: http://www.jstor.org/stable/3893243 .
Accessed: 24/01/2014 11:47
Your use of the JSTOR archive indicates your acceptance of the Terms & Conditions of Use, available at .
http://www.jstor.org/page/info/about/policies/terms.jsp
.
JSTOR is a not-for-profit service that helps scholars, researchers, and students discover, use, and build upon a wide range of content in a trusted digital archive. We use information technology and tools to increase productivity and facilitate new forms of scholarship. For more information about JSTOR, please contact [email protected].
.
Herpetologists' League is collaborating with JSTOR to digitize, preserve and extend access to Herpetologica.
climatic determination of scale size in a lizard. Syst. Zool. 21:97-105.
TAYLOR, H. L., AND D. BUSCHMAN. 1993. A mul-
tivariate analysis of geographic variation in the teiid lizard Cnemidophorus tigris septentrionalis. Her- petologica 49:42-51.
THORPE, R. S. 1976. Biometric analysis of geo- graphic variation and racial affinities. Biol. Rev. 51: 407-452.
1983. A review of the numerical methods for recognising and analyzing racial differentiation. Pp. 404-423. In J. Felsenstein (Ed.), Numerical Taxonomy: Proceedings of a NATO Advanced Studies Institute. NATO ASI Series, Vol. Gl, Springer-Verlag, Heidelberg, Germany.
. 1991. Clines and cause: Microgeographic variation in the Tenerife gecko (Tarentola dela- landii). Syst. Zool. 40:172-187.
THORPE, R. S., AND M. BAEZ. 1987. Geographic
variation within an island: Univariate and multi- variate contouring of scalation, size, and shape of the lizard Gallotia galloti. Evolution 41:256-268.
THORPE, R. S., AND R. P. BROWN. 1989a. Testing hypothesised causes of within-island variation in the colour of lizards. Experientia 45:397-400.
. 1989b. Microgeographic variation in the colour pattern of the lizard Gallotia galloti within the island of Tenerife. Distribution, pattern and hypothesis testing. Biol. J. Linn. Soc. 38:303-322.
VINEGAR, A. 1973. The effects of temperature on the growth and development of embryos of the indian python Python molurus (Reptilia: Ser- pentes: Boidae). Copeia 1973:171-173.
. 1974. Evolutionary implications of tem- perature induced anomalies of development in snake embryos. Herpetologica 30:72-74.
WADDLE, D. M. 1994. Matrix correlation tests sup- port a single origin for modern humans. Nature
368:452-454.
Accepted: 6 March 1996 Associate Editor: Stephen Tilley
Herpetologica, 53(1), 1997, 62-69
? 1997 by The Herpetologists' League, Inc.
ALLOMETRIC ANALYSIS OF THE ONTOGENETIC
VARIATION AND EVOLUTION OF THE SKULL IN
CAIMAN SPIX, 1825 (CROCODYLIA: ALLIGATORIDAE)
LEANDRO R. MONTEIRO' AND MARCELO SOARES2
Depto de Zoologia, UNESP caixa postal 199 cep: 13506-900, Rio Claro, SP, Brasil 2Setor de Herpetologia, Museu Nacional do Rio de Janeiro, Quinta da Boa Vista,
Sdo Crist6vdo, Rio de Janeiro, RJ cep: 20940-040, Brasil
ABSTRACT: We studied ontogenetic variation in the shape of the skull among species of Caiman
using principal component analysis. Comparison of multivariate allometric coefficients and onto- genetic trends between size and shape reveals that C. sclerops and C. yacare have similar ontogenetic processes, and they are more related to each other than either is to C. latirostris. Allometric relationships of the characters measured are similar in all species studied. The greater differences were in the width measurements, with higher coefficients in shape (second principal component) for C. latirostris, and length measurements with higher coefficients in shape for C. yacare and C. sclerops. The ontogenetic process leading to change in skull shape in the group seems to be plesiomorphic for elongation and derived for broadening. Statistical comparison of the ontogenetic trends with models of allometric heterochrony suggests that C. latirostris has diverged from the other species by a neotenic process, and that C. sclerops is separated from C. yacare by ontogenetic scaling (progenesis).
Key words: Allometry; Heterochrony; Caiman; Skull ontogeny
THE species of Caiman (C. latirostris,
C. sclerops, and C. yacare, sensu Medem, 1983) are widely distributed through South America. Caiman latirostris ranges from northern to southern Brazil along the At- lantic Coast, west into Paraguay and into the northern part of Argentina; C. yacare
viduals also prey on birds and mammals
(Ayarzague-na, 1983; Carvalho, 1951; Van- zolini and Gomes, 1979).The study of growth in crocodilians is an interesting subject, which has received little attention. These animals are thought to have unlimited growth (Jacobsen and Kushlan, 1989) and, consequently, have a large range of size during their lifespans. Because the crocodilian skull is solid, it is an appropriate subject for studies of vari- ation in shape in relation to size. Most mor- phometric studies of crocodilians deal with a single species or compare the skulls of unrelated species. Studies on allometric growth have been carried out on Alligator mississippiensis (Dodson, 1975), Caiman crocodilus (Ayarzaguena, 1983; Gans, 1980; Vanzolini and Gomes, 1979), Paleo- suchus trigonatus (Vanzolini and Gomes, 1979), and Crocodylus novaeguinae (Hall and Portier, 1994). None of these com- pared the allometries of different species. However, the embryonic growth of un- related species of crocodilians was studied and quantified by Deeming and Ferguson (1990), and morphometric analyses were performed on Crocodylus porosus by Webb and Messel (1978).
Herein we compare the allometric re- lationships of several cranial characters in three species of Caiman using multivariate allometric coefficients, and ontogenetic trends between size and shape. Such an approach is important to evolutionary studies, because it allows a study of the evolutionary process (allometric hetero- chrony) that leads to a given phylogenetic pattern (Kluge, 1988; Reis, 1988). If we consider the statement of McKinney (1988), that heterochronic processes play a major role in evolution (at least in small scale), the models developed for the study of heterochrony deserve special attention (Kluge, 1988). However, these are rarely applied to real problems, as in Reis et al.
(1988).
MATERIALS AND METHODS
Sample
The sample was composed of 46 skulls from the collections of the Museu Nacional
do Rio de Janeiro and the Department of Zoology-UNESP-Rio Claro. This in- cluded 11 specimens of Caiman sclerops (basicranial axis length range 31.15-236.00 mm), 13 specimens of C. yacare (BAL range 29.10-306.00 mm), and 22 speci- mens of C. latirostris (BAL range 42.95- 284.00 mm). The specimens of C. latiros- tris (with geographic data) are mainly from the states of Espirito Santo and Rio de Ja- neiro (very close populations in southeast- ern Brazil). The specimens of C. sclerops are from the states of Mato Grosso and Roraima, respectively, in western and northern Brazil, and those of C. yacare are from the state of Mato Grosso. However, most skulls are from old specimens (col- lected >40 yr ago) that lack data.
Measurements
Nineteen measurements, designed to re- flect skull shape (Fig. 1), were as follow: basicranial axis length (BAL, measured from the tip of the snout to the occipital condyle), rostral width at the level of the fourth premaxillary tooth (RWP), rostral width at the level of the ninth maxillary tooth (RWM), orbital width (OW), orbital length (OL), cranial roof width (CRW), frontal width (FW), palatine length (PL), palatine width (PW), nasal length (NL), palatine fenestra length (PFL), palatine fe- nestra width (PFW), cranial width at quadrate level (CWQ), external mandib- ular fenestra height (MFH), external man- dibular fenestra length (MFL), dentary dorsal length (DDL), mandibular arch length (MAL), retroarticular process length (RPL), and mandibular height at the ex- ternal fenestra level (MH). The paired measurements were taken on both sides (whenever possible) and averaged.
Statistical Analysis
9
4
13
10
16F1
167
FIG. 1.-Schematic alligatorid skull and mandible showing the measurements taken for the analysis: 1- BAL, 2-RWP, 3-RWM, 4-OW, 5-OL, 6-CRW, 7-FW, 8-PL, 9-NL, 10-PFL, 11-PFW, 12- PW, 13-CWQ, 14-MFH, 15-MFL, 16-DDL, 17-MAL, 18-RPL, 19-MH.
variation within a set of variables, and the subsequent components (number of com- ponents = number of variables) account for decreasing amounts of variance within the sample. The coefficient of a given vari- able on a principal component is the cosine of the angle that variable forms with the component (or the eigenvector of the vari- ance-covariance matrix). Therefore, the larger the coefficient of a variable, the larger the contribution of that variable to the variance of the component (Marcus, 1990). The sign of the coefficients denotes the direction of variation of a variable on a given component.
The analysis assumes that the direction of maximum variation is the same among groups in the case that heterogeneous groups are being examined. This assump-
tion can be tested by calculating
the vec-
tor-correlation
coefficients between the
within-group first principal components
(Strauss and Fuiman, 1985). These coef- ficients are calculated as the inner product of the matrix containing two columns of coefficients of the first within-group prin- cipal components. As common correlation coefficients, these may be calculated only for two groups at a time, and values near 1.0 indicate coincidence of the vectors, whereas values near zero indicate ortho- gonality of the vectors (Reis et al., 1988).When the coefficients of the first prin- cipal component have the same sign, it can be interpreted as a general size factor (be- cause all variables have the same direction of variation). If the remaining components have coefficients with positive and nega- tive signs, they can be interpreted as shape factors (because the variables have differ- ent directions of variation, giving infor- mation about ratios of the diverse char- acters) (Marcus, 1990). If these conditions are true for an analysis, we can obtain mul- tivariate allometric coefficients from the first principal component (Jolicoeur, 1963). The multivariate allometry coefficient of a character in relation to general size is the standardized first principal component coefficient of that character divided by
vT7ii,
where p is the number of variables(Cavalcanti and Lopes, 1993; Cheverud, 1982). This is equivalent to dividing each coefficient by the grand average of the coefficients. Values > 1.0 indicate positive allometry, whereas values equal to 1.0 in- dicate isometry, and values < 1.0 indicate negative allometry (Gould, 1966; Shea, 1985). We performed four analyses, one for each species and one combining all samples.
Heterochrony Models
The scores obtained from the projection of the eigenvectors on the logarithmically transformed data of the combined sample were plotted on the space of the first two principal components and the ontogenetic trajectories estimated for each species by linear regression between them.
A
/B
/C
hypermorphosis /aceleration pre-displacement / / 0
H A// e= / / t /
SIZ / ~~neoteny/
post-displacement Z
SiZE
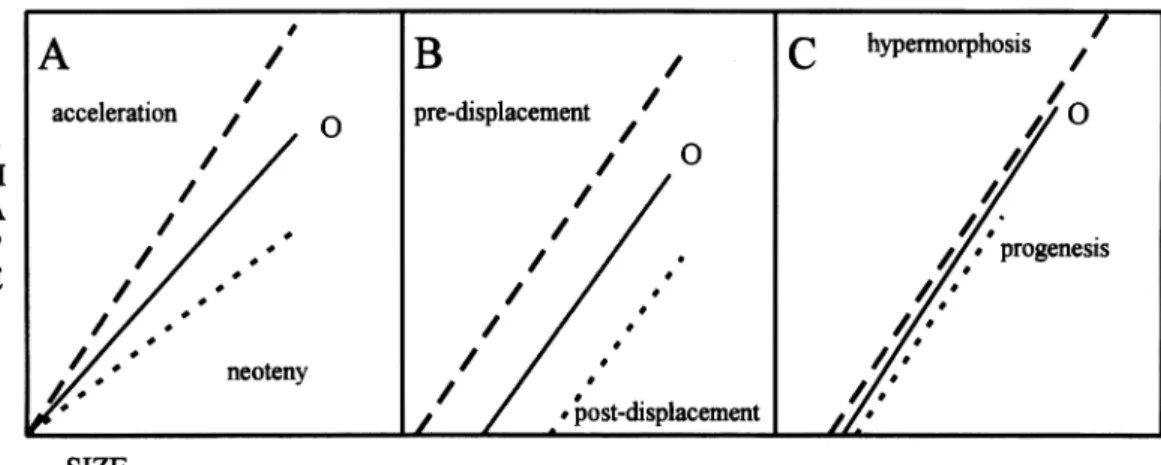
FIG. 2.-Pure heterochrony models for the comparison between ontogenetic trajectories. Dotted lines correspond to paedomorphic processes, dashed lines correspond to peramorphic processes. Continuous lines (0) correspond to the trajectory of the outgroup. A = differences in slope, B = differences in Y-intercept, C = differences in cessation of growth.
lometric heterochrony models developed by Alberch et al. (1979). This model states that ontogenetic trajectories between size and shape factors can be compared by three parameters (Fig. 2); the differences in these parameters are used to test hypotheses about allometric heterochronic processes. Allometric heterochrony is the term used for heterochronic processes when studied by size, rather than age. The parameters are slope (differences in slope being linked to neoteny or acceleration), onset of growth or Y-intersect (accounting for post or pre- displacement), and cessation of growth or extent of ontogeny (relating to hypermor- phosis or progenesis). Differences in these parameters can be tested by simple statis- tical procedures. Slopes and Y-intercepts are tested for equality by analysis of co- variance (ANCOVA). Differences in ex- tent are tested by an analysis of variance (ANOVA) on the first principal component or size factor. The ANOVA is recom- mended because any hypothesis testing re- quires at least three species (one in the outgroup and two in the ingroup: Kluge, 1988).
The multivariate analyses were per- formed on PCA software written by Pe Dr. J. S. Moure. Univariate analyses (ANO- VA, ANCOVA, and linear regressions) were performed following the procedures explained in Sokal and Rohlf (1981).
RESULTS
The vector correlation coefficients in- dicated a high level of coincidence be- tween the first eigenvectors in the pairwise comparison of samples (>0.98), satisfying the assumption that the direction of max- imum variation is the same in the three groups studied.
The two first principal components ac- count for 98.5% of the variation in the combined sample, 98.2% for Caiman la- tirostris, 99.5% for C. sclerops, and 99.5% for C. yacare. The remaining eigenvectors were not considered, because their eigen- values were too low. The first principal component was interpreted as a size factor in each individual sample and in the com- bined one, because all the characters had positive loadings and high correlation co- efficients (P < 0.0001). Following the as- sumption above, the multivariate allome- tric coefficients were calculated for the characters measured, separately for each species (Table 1).
TABLE 1. -Coefficients (PCI) of the first principal component for 19 measurements taken for each species. Also provided are the correlation coefficient of each character with the first principal component (r) and the
multivariate allometric coefficients for each measure (k).
C. latirostris C. sclerops C. yacare Character PCI r k PCI r k PCI r k
BAL 0.2173 0.94 0.959 0.2285 0.99 1.009 0.2322 0.99 1.025 RWP 0.2467 0.99 1.089 0.2463 0.99 1.087 0.2444 0.99 1.078 RWM 0.2234 0.99 0.986 0.2023 0.99 0.893 0.2034 0.98 0.898 OW 0.1560 0.98 0.688 0.1580 0.99 0.698 0.1598 0.91 0.705 OL 0.1554 0.97 0.686 0.1557 0.99 0.687 0.1673 0.95 0.738 CRW 0.1848 0.99 0.815 0.1749 0.99 0.772 0.1701 0.96 0.751 FW 0.2882 0.96 1.272 0.2475 0.99 1.093 0.2400 0.89 1.059 PL 0.1971 0.98 0.870 0.2383 0.99 1.052 0.2109 0.50 0.931 PW 0.2210 0.94 0.975 0.2142 0.98 0.946 0.2288 0.93 1.010 NL 0.2708 0.98 1.195 0.3036 0.99 1.340 0.2941 0.95 1.298 PFL 0.2018 0.99 0.890 0.2096 0.99 0.925 0.2203 0.96 0.972 PFW 0.2080 0.97 0.918 0.1961 0.99 0.866 0.1838 0.91 0.811 CWQ 0.2454 0.99 1.083 0.2334 0.99 1.030 0.2251 0.98 0.993 MFH 0.2698 0.96 1.191 0.2551 0.98 1.126 0.2508 0.84 1.107 MFL 0.2394 0.98 1.056 0.2202 0.99 0.972 0.2483 0.85 1.096 DDL 0.2266 0.99 1.000 0.2488 0.99 1.098 0.2399 0.94 1.059 MAL 0.2371 0.99 1.046 0.2433 0.99 1.074 0.2458 0.90 1.085 RPL 0.2597 0.97 1.146 0.2673 0.98 1.180 0.2732 0.96 1.206 MH 0.2569 0.99 1.134 0.2597 0.99 1.147 0.2671 0.96 1.179
palatine fenestra. Also shared is the isom- etry of the basicranial axis length and pal- ate width. Caiman sclerops and C. yacare share more common features than either does with C. latirostris. Slight differences in some allometric coefficients between C.
sclerops and C. yacare do not account for divergence in ontogenetic patterns, except that the positive allometry of the palatine in C. sclerops might indicate that the skull is proportionally longer in this species than in C. yacare. However, skulls of adult C. yacare and C. sclerops are hardly distin- guishable by shape, although they do dif- fer in some osteological characters and ab- solute size. The main difference between
C. latirostris and the other species is the positive allometry of the cranial width be- tween the quadrates in C. latirostris and isometric in the others. Also, variation of rostral width at the maxilla level (RWM) is isometric in C. latirostris, but negatively allometric in the other species. The man- dibular characters have similar allometric trends in all three species. Adults have thicker mandibles than the newborns, be- cause the height-related characters have a highly positive allometry and the length characters are isometric.
Analysis of the combined sample indi-
cates that the major interspecific differ-
ences are in shape, because the onset and
extent of growth (size variation)
is similar
(although
skulls of adult Caiman sclerops
are smaller
than of the other species). Dur-
ing ontogeny, the head of C. latirostris
becomes stout, increasing greatly in cra-
nial width; this is reflected in the fact that
the most significant coefficients for this
species are in the width variables
(positive
eigenvectors of variables increasing up-
wards in the shape component-PCII)
(Ta-
ble 2, Fig. 3). The skulls of C. sclerops
and
C. yacare elongate; the larger coefficients
for these species are in the length variables
(negative coefficients of variables with
negative
directions
of variation
in the shape
component-PCII).
The mandible
variables
seem to differ little among the species;
their
coefficients in the shape component are
low, and the allometric coefficients are
similar
in each of the species. Examination
of the principal
component
scatter reveals
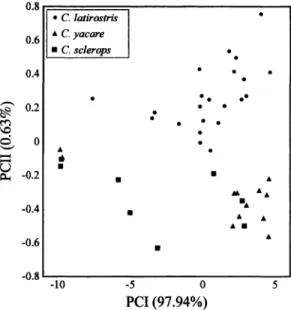
that C. latirostris and C. yacare differ
greatly from C. sclerops with respect to
size range, whereas C. yacare and C. scler-
ops differ from C. latirostris primarily
in
shape.
TABLE 2.-Coefficients (PCI and PCII) of the prin- cipal component analysis for 19 measurements taken for the combined sample of the species of Caiman.
Symbols as in Table 1.
Character PCI PCII r
BAL 0.2257 -0.0948 0.99 RWP 0.2501 0.1873 0.99 RWM 0.2150 0.3600 0.96 OW 0.1575 -0.0376 0.98 OL 0.1622 -0.0876 0.98 CRW 0.1743 0.0220 0.99 FW 0.2565 0.1211 0.97 PL 0.2087 -0.4877 0.80 PW 0.2241 -0.4949 0.92 NL 0.2838 -0.2011 0.98 PFL 0.2083 0.0715 0.98 PFW 0.1969 0.4534 0.98 CWQ 0.2352 0.1322 0.99 MFH 0.2610 0.0193 0.97 MFL 0.2371 0.1039 0.98 DDL 0.2380 -0.1592 0.99 MAL 0.2420 -0.0257 0.99 RPL 0.2682 0.1164 0.99 MH 0.2641 0.0006 0.99
nificant results for all species (Fig 4). The homogeneity test between the regression slopes did not show a significant difference between C. sclerops and C. yacare (F =
0.031, P = 0.861), but the slopes were sig- nificantly different between these two spe- cies and C. latirostris (F = 8.715, P =
0.006). The ANCOVA was used only to test for differences between the Y-inter- cepts of the regressions for the two former species (because of the slope equality). The difference was also insignificant (F = 1.052, P = 0.318). The ANOVA performed on the size component (PCI) to test for dif- ferences among the species in the extent parameter of the ontogenetic trends showed significant results (P < 0.05) only separating Caiman sclerops from the other species.
DISCUSSION
The comparison of the ontogenetic trends revealed that the skulls of three spe- cies of Caiman have similar shapes at birth but that differences appear early in the ontogenetic process. The final adult shape (particularly in C. latirostris) is often ev- ident in young animals, and the shape of the skull changes little with subsequent de- velopment. The ontogenetic trends of C.
0.8
* C. latirostris 0.6 A C. yacare
* C. sclerops
0.4 .
p 0.2 0 0
6 0
A0
P -0.2 *
A
-0.4 MAA
A U
-0.6 A
-0.80
-10 -5 0 5
PCI (97.94%)
FIG. 3.-Scatterplot of the combined sample in the space of the first two principal components. The num- bers in parentheses are the percentage of contribution of each component to the total variance in the sample.
sclerops and C. yacare lead to similar skull shapes in the adults.
Dispersion of the specimens in the space of the size and shape components suggests
0.8
0.6
0.4
C. latirostris
0.2
~.1 0
2 -0.2 C yacare
-0.4
C. scierops -0.6
-0.81
-10 -8 -6 -4 -2 0 2 4 6
SIZE (PCI)
FIG. 4.-Ontogenetic trends of the species studied. The regression equations, correlation coefficients (r),
and significance probabilities (P) are: Caiman lati-
rostris (Y = 0.228 + 0.052X, r = 0.592, P < 0.01);
C. yacare (Y = -0.298 - 0.023X, r = -0.664, P <
0.05); C. sclerops (Y = -0.439 - 0.027X, r = -0.720,
that a heterochronic
mechanism was in-
volved in the evolution of Caiman lati-
rostris. The mechanism
might be neoteny
(a paedomorphic process), a model in
which the ontogenetic
trajectory
of a given
species is not as steep as those of a sister
species and the outgroup (Kluge, 1988).
Retention of juvenile characters
in adults
and posterior ontogenetic re-patterning
(Wake, 1989) is the only way to explain
such divergence found in the ontogenetic
trajectory of C. latirostris. The ontoge-
netic process involving the elongation of
the skull (observed in C. sclerops and C.
yacare) probably
is the plesiomorphic
con-
dition in the group, because it occurs also
in Melanosuchus
niger (Monteiro,
unpub-
lished data), which may be considered as
an outgroup
to the species of Caiman. The
process that forms a broader skull (and a
divergent trajectory from the other spe-
cies) probably
is the derived condition
and
an apomorphy
of C. latirostris. The allo-
metric pattern observed in this species is
unique among crocodilians.
Whereas Caiman sclerops and C. ya-
care have similar ontogenetic trajectories
in the parameters
slope and Y-intercept,
they differ significantly
in extent (cessation
of growth). As the outgroup
for this species
(C. latirostris)
has a greater
size range than
C. sclerops and is not significantly
differ-
ent from C. yacare; C. sclerops probably
differentiated
from C. yacare by a heter-
ochronic process of progenesis (another
paedomorphic
process).
Thus, it seems that
diversification
of skull shape in this group
has been achieved by paedomorphic
pro-
cesses-i.e., neoteny and progenesis-with
the former occurring before the latter.
Acknowledgments.-We thank A. S. Abe, R. P. Bastos, and M. J. Cavalcanti for useful comments on earlier versions of this manuscript. S. F. dos Reis provided useful discussions about allometric hetero- chrony. We also are indebted to J. R. Somera for help with the line drawings.
LITERATURE CITED
ALBERCH, P., S. J. GOULD, G. F. OSTER, AND D. B.
WAKE. 1979. Size and shape in ontogeny and phylogeny. Paleobiology 5:296-317.
AYARZAGUE&A, J. 1983. Ecologia del caiman de anteojos o baba (Caiman crocodilus L.) en los lianos
de Apure (Venezuela). Donana Acta Vertebrata 10: 1-34.
BRAZAITIS, P. 1973. The identification of living crocodilians. Zoologica 58:59-105.
CARVALHO, A. L. 1951. Os jacar6s do Brasil. Ar- quivos do Museu Nacional 42:127-152.
CAVALCANTI, M. J., AND P. R. D. LOPES. 1993. An- alise morfometrica multivariada de cinco especies de Serranidae (Teleostei, Perciformes). Acta Biol. Leopoldensia 15:53-64.
CHEVERUD, J. M. 1982. Relationships among on- togenetic, static and evolutionary allometry. Am.
J. Phys. Anthropol. 59:139-149.
DEEMING, D. C., AND M. W. J. FERGUSON. 1990.
Morphometric analysis of embryonic development in Alligator mississipiensis, Crocodylus johnstoni
and Crocodylus porosus. J. Zool. Lond. 221:419- 439.
DODSON, P. 1975. Functional and ecological sig- nificance of relative growth in Alligator. J. Zool. Lond. 175:315-355.
GANS, C. 1980. Allometric changes in the skull and brain of Caiman crocodilus. J. Herpetol. 14:297- 301.
GOULD, S. J. 1966. Allometry and size in ontogeny and phylogeny. Biol. Rev. 41:587-640.
GROOMBRIDGE, B. 1987. The distribution and status of world crocodilians. Pp. 9-22. In G. J. W. Webb, S. C. Manolis, and P. J. Whitehead (Eds.), Wildlife Management: Crocodiles and Alligators. Surrey Beatty & Sons PTY Limited, Chipping Norton, New South Wales, Australia.
HALL, P. M., AND K. M. PORTIER. 1994. Cranial morphometry of New Guinea crocodiles (Croco- dylus novaeguineae): Ontogenetic variation in rel- ative growth of the skull and an assessment of its utility as a predictor of the sex and size of individ- uals. Herpetol. Monogr. 8:203-225.
JACOBSEN, T., AND J. A. KUSHLAN. 1989. Growth dynamics in the American alligator (Alligator mis- sissippiensis). J. Zool. Lond. 219:309-328.
JOLICOEUR, P. 1963. The multivariate generaliza- tion of the allometry equation. Biometrics 19:497- 499.
KLUGE, A. G. 1988. The characterization of ontog- eny. Pp. 57-81. In C. J. Humphries (Ed.), Ontogeny and Systematics. Columbia University Press, New York, New York.
MARCUS, L. 1990. Traditional morphometrics. Pp. 77-122. In F. J. Rohlf and F. L. Bookstein (Eds.), Proceedings of the Michigan Morphometrics Workshop. Special Publication 2, University of Michigan Museum of Zoology, Ann Arbor, Mich- igan.
McKINNEY, M. L. 1988. Classifying heterochrony. Allometry, size and time. Pp. 17-34. In M. L. Mckinney (Ed.), Heterochrony in Evolution. Ple- num Press, New York, New York.
MEDEM, F. 1983. Los Crocodylia de Sur America. Volumen II. Colciencias, Bogota, Colombia.
NEFF, N. A., AND L. F. MARCUS. 1980. A survey of multivariate methods for systematics. Privately published.
variada em biologia evolutiva. Rev. Bras. Zool. 4:571-580.
REIS, S. F., J. F. CRUZ, AND C. J. VON ZUBEN. 1988. Analise multivariada da evolueao craniana em roe- dores caviineos: convergencia de trajetorias onto- gen6ticas. Rev. Bras. Genet. 11:633-641.
SHEA, B. T. 1985. Bivariate and multivariate growth allometry: Statistical and biological considerations. J. Zool. Lond. (A) 206:367-390.
SOKAL, R. R., AND F. J. ROHLF. 1981. Biometry. W. H. Freeman and Co., New York, New York.
STRAUSS, R. E., AND L. A. FUIMAN. 1985. Quanti- tative comparisons of body form and allometry in larval and adult pacific sculpins (Teleostei: Cotti- dae). Can. J. Zool. 63:1582-1589.
VANZOLINI, P. E., AND N. GOMES. 1979. Notes on the ecology and growth of Amazonian caimans (Crocodylia, Alligatoridae). Papeis Avulsos Zool. S. Paulo 32:205-216.
WAKE, D. B. 1989. Phylogenetic implications of ontogenetic data. Geobios 12:369-378.
WEBB, G. J. W., AND H. MESSEL. 1978. Morpho- metric analysis of Crocodylus porosus (Reptilia- Crocodilia) from the north coast of Arnhem Land, Northern Australia. Aust. J. Zool. 26:1-27.
Accepted: 12 February 1996