Volume 29, número 1, 2004
www.scielo.br/eq
Thermoanalytical study of purine derivatives compounds
E. Schnitzler1, M. Kobelnik1, G. F. C. Sotelo2, G. Bannach3, M. Ionashiro3
1Departamento de Química – UEPG - CEP 84030-000 - Ponta Grossa – PR - Brasil 2Departamento de Engenharia de Materiais – UEPG - CEP 84030-000 - Ponta Grossa – PR - Brasil
3Instituto de Química – UNESP – CEP 14801-970 – Araraquara – SP - Brasil
Abstract: Thermal methods of analysis are now used in a very large range of scientific investigations. In
this work simultaneous thermogravimetry-differential thermal analysis (TG-DTA), X-Ray powder diffractometry and infrared spectroscopy were used to study the derivative compounds of purine, i. e. aminophylline, theophylline, caffeine and uric acid. The results led to informations about the thermal stability and thermal decomposition of these compounds.
Keywords: aminophylline; theophylline; caffeine; uric acid; TG; DTA.
Introduction
Several investigations have been carried out on the application of thermoanalytical techniques for the study of drug substances, excipients and drug substances in dosage forms. Montagut and co-work [1] investigated dipyrone by employing DTA and TG, and examined the possibility of applying TG in quantitative studies. Wendlandt and Collins [2] used DTA and TG as aids in the characterization and identification of commercial non-preescription analgesics. Other investigations of the use of thermoanalytical techniques for the study of drug substances and for applications in routine pharmaceutical analysis and in the pharmaceutical industry have also been described [3-20].
In this paper derivative compounds of purine were investigated by using thermoanalytical techniques (TG, DTA), X-ray diffractometry and infrared spectroscopy.
Experimental
Caffeine 1,3,7-trimeyhyl-1H-purine-2,6-dione); Theophylline
(3,7-dihydro-1,3dimethyl-1H-purine-2,6-dione) and Aminophylline (3,7-dihydro-1,3-dimethyl-1H-purine-2,6-dione compd. with ethylenediamine) were obtained from Quimidrol LTDA. Uric Acid (7,9-dihydro-1H-purine-2,6,8(1H,3H,9H)-trione) was obtained from Riedel de Haen.
The formula of these compounds are shown in scheme I
TG, DTG and DTA curves were obtained by using a simultaneous SDT 2960 from TA Instruments. The purge gas was nitrogen flow of 100 mL min-1, heating of 20ºC min-1 and with
a sample weighing about 6-8 mg. Alumina crucible was used for the TG, DTG and DTA studies.
X-ray powder patterns were obtained with a Simens D-500 X-ray diffractometer using CuK? radiation (?=1,544 Å) and setting of 40 kV and 20 m A. Infrared spectra for these compounds were run on a spectrophotometer model FTIR-8400 Shimadzu, within the 4000-400 cm-1
ran-ge. The solid samples were pressed into KBr pellets.
Results and Discussion
Theophylline
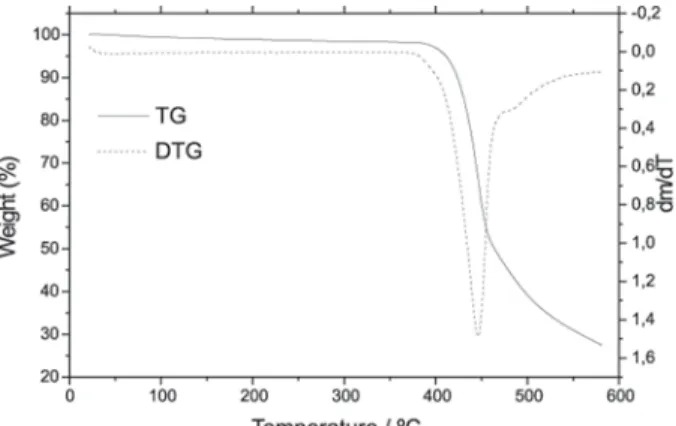
The TG, DTG curves of theophylline are shown in Fig. 1. These curves show that the compound is stable up to 250ºC, and between 250-375ºC the mass loss occurs in a single step, without formation of residue.
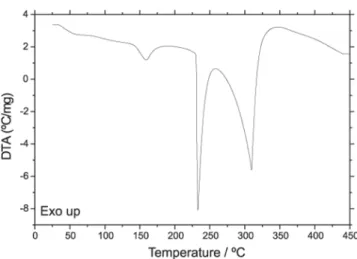
The DTA curve, Fig. 2, shows an endotherm between 256 and 375ºC with two peaks
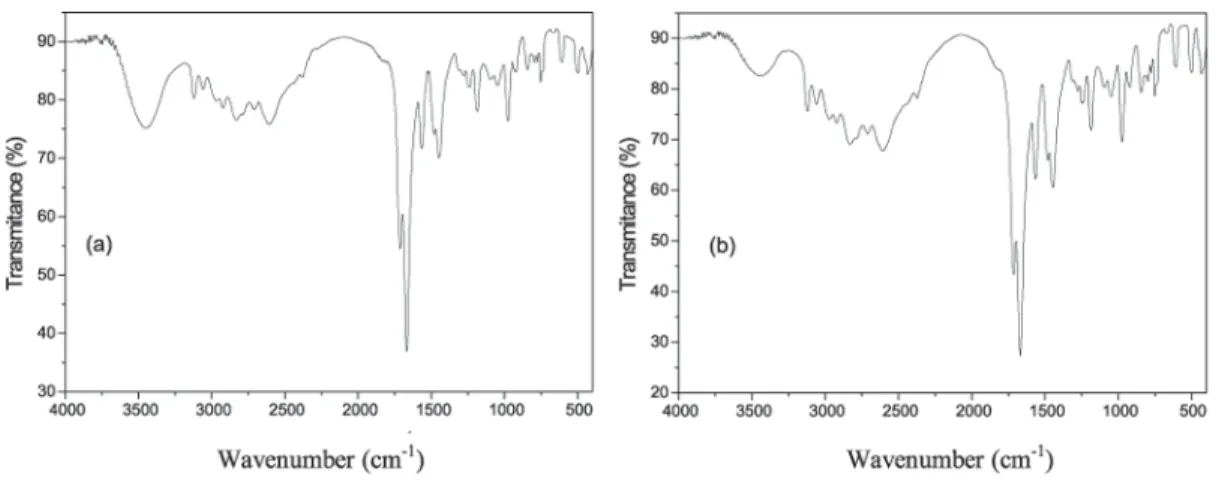
at 273ºC and 350ºC, respectively. The first endothermic peak is due to the fusion of the compound and in agreement with the literature [21]. The second endothermic peak is due to evaporation of the compound and in agreement with the TG curve, where the total mass loss is observed. The evaporation of the compound occurs without decomposition, in compliance with the infrared spectra of theophylline, and solidified sample collected after evaporation, as can be seen in the Fig. 3.
Figure 1- TG and DTG curves of theophylline sample ( mi = 6.640 mg).
Aminophyline
The TG and DTG curves of aminophylline are shown in Fig. 4. These curves show that the compound is stable up to 78ºC, and this temperature the TG curve suggests mass loss in two steps, although the DTG curve shows three steps, being the two first as overlapping steps. The mass loss that occurs between 78 and 144ºC is ascribed to the loss of ethylenediamine (TG=14.41%); Calcd=14,30%), with formation of theophylline. The second step that occurs between 238 and 362ºC with total mass loss
Figure 2 - DTA curve of theophylline sample ( mi = 6.640 mg).
Figure 3 - FTIR spectra of (a) theophylline sample at room temperature (b) sample collected after condensation.
is due to evaporation of theophylline.
Figure 4 - TG and DTG curves of the aminophylline sample (mi = 8.607 mg).
Figure 5 - DTA curve of aminophylline sample (mi = 8.607 mg).
Caffeine
The TG and DTG curves of caffeine are shown in Fig. 7. These curves show that the compounds are stable up to 175ºC and between 175-315ºC, the total mass loss occurs in a single step.
The DTA curve of caffeine is shown in Fig. 8. The first endothermic peak at 163ºC is due to a change of crystalline structure in compliance with
the X-ray powder patterns, as can be seen in Fig. 9 and in agreement with the literature [10]. The endotherm between 225-320ºC, with two peaks at 270ºC and 312ºC are due to fusion and evaporation respectively. The evaporation of caffeine occurs without decomposition, in compliance with the infrared spectra of caffeine and solidified sample collected after evaporation, as can be seen in Fig. 10.
Figure 7 - TG and DTG curves of caffeine sample (mi = 7.435 mg).
Figure 9 - X-ray diffraction powder patterns of the caffeine sample at room temperature and at 200 °C.
Uric Acid
The TG and DTG curves of uric acid are shown in Fig. 11, these curves shows that compound is stable up to 375ºC, and above this temperature the mass loss beginning through a fast process up to 480ºC, followed by a slow process
between 480 and 600ºC, with loss of 60% and 29%, respectively. These curves also show that the mass loss is still being observed up to 600ºC.
The DTA curve of uric acid is shown in Fig. 12. The endothermic ascribed to thermal decomposition corresponding to the fast mass loss of the TG and DTG curves.
Figure 11 - TG and DTG curves of uric acid sample ( mi = 7.581 mg).
Figure 12 - DTA curve of uric acid sample( mi = 7.5809 mg).
Conclusion
The TG, DTG, DTA curves, infrared spectroscopic spectra and X-ray powder patterns, provided information on the thermal stabilities and thermal decomposition of these compounds.
Acknowledgement
The authors thank FINEP - Brazil (Proc. RC: 312-0023/98) for financial support.
E. Schnitzler, M. Kobelnik, G. F. C. Sotelo, G. Bannach, M. Ionashiro. Estudo termoanalítico de compostos derivados da purina.
Resumo: Os métodos térmicos em análises estão sendo atualmente muito utilizados nas investigações
cientificas. Neste trabalho a termogravimetria-análise térmica diferencial simultânea (TG-DTA), difratometria de raios X pelo método do pó, espectroscopia de absorção na região do infravermelho foram utilizadas para estudar os compostos derivados da purina. Sendo estes: aminofilina. teofilina, cafeína e ácido úrico. Os resultados forneceram informações com respeito à estabilidade térmica e de-composição térmica sobre esses compostos.
Palavras-chave: aminofilina; teofilina; cafeína; ácido úrico; TG; DTA.
References
[1] M. Montagut, L. Codern, J. Carulla, Afinidad 25 (1963) 316. [2] W. W. Wendlandt, L. W. Collins, Anal. Chim. Acta 71 (1974) 411.
[3] G. Margomenou-Leonipoulou, K. Theodoratos, G. G. Macris, Arch. Pharm. 30 (1974) 100.
[4] E. Domagalina, T. Slawik, Acta Pol. Pharm. 33 (1976) 623. [5] A. Chauvet, J. Masse, J. Trav. Sec. Pharm. Montpellier 38 (1978) 31.
[6] A. Rodecki, M. Wesolowski, J. Thermal Anal. 17 (1979) 73. [7] M. Wesolowski, Mikrochim. Acta 1(1980) 199.
[8] M. Wesolowski, Acta Pharm. Iugosl. 32 (1982) 303. [9] C. Martinez Recari, J. M. Sanches Monge, J. A. Perez de Ciriza, F. Marcótegni, Rev. Asoc. Esp. Farm. Hosp. 6 (1982) 57. [10] E. Colacio-Rodriguez, J. M. Salas-Peregrin, M. P. Sanchez-Sanchez, A. Mata-Arjona, Thermochim. Acta 66 (1983) 245. [11] D. J. Ager, K. S. Alexander, A. S. Bhatti, J. S. Blackbum, D. Dollimore, T. S. Koogan, K. A. Mooseman, G. M. Muhvic,
B. Sims, V. J. Webb, J. Pharm. Sci. 75 (1986) 77. [12] D. Giron, J. Pharm. Biomed. Anal. 4 (1986) 755. [13] G. Gupchup, K. Alexander, D. Dollimore, Thermochim. Acta 196 (1992) 279.
[14] M. Sh. Lvova, E. I. Kozlov, I. A. Wishnevezkaya, J. Therm. Anal. 40 (1993) 405.
[15] D. Giron, Thermochim. Acta 248 (1995) 1.
[16] M. Epple, H. K. Cammenga, S. M. Sarge, R. Diedrich, V. Balek, Thermochim. Acta 250 (1995) 29.
[17] Y. A. Ribeiro, J. D. S. Oliveira, M. I. G. Leles, S. A. Juiz, M. Ionashiro, J. Therm. Anal. 46 (1996) 1645.
[18] Y. A. Ribeiro, A. C. F. Caíres, N. Baralle, M. Ionashiro, Thermochim. Acta 279 (1996) 177.
[19]E. Schnitzler, M. A. S. Carvalho-Filho, C. C. Stadler, A. M Volpato, M. Ionashiro, Ecl. Quím. 26 (2001) 41.
[20] M. Wesolowski, P. Szynkaruk, J. Therm. Anal. Cal. 65 (2001) 599.