TCD
5, 3221–3258, 2011Distributed temperature-radiation
index model, Hurd Peninsula Glaciers
U. Y. Jonsell et al.
Title Page
Abstract Introduction
Conclusions References
Tables Figures
◭ ◮
◭ ◮
Back Close
Full Screen / Esc
Printer-friendly Version
Interactive Discussion
Discussion
P
a
per
|
Dis
cussion
P
a
per
|
Discussion
P
a
per
|
Discussio
n
P
a
per
|
The Cryosphere Discuss., 5, 3221–3258, 2011 www.the-cryosphere-discuss.net/5/3221/2011/ doi:10.5194/tcd-5-3221-2011
© Author(s) 2011. CC Attribution 3.0 License.
The Cryosphere Discussions
This discussion paper is/has been under review for the journal The Cryosphere (TC). Please refer to the corresponding final paper in TC if available.
Sensitivity of a distributed
temperature-radiation index melt model
based on a four melt season AWS record
from Hurd Peninsula glaciers, Livingston
Island, Antarctica
U. Y. Jonsell1,2, F. J. Navarro1, M. Ba ˜n ´on3, J. J. Lapazaran1, and J. Otero1
1
Departamento de Matem ´atica Aplicada, E.T.S.I. Telecomunicaci ´on, Universidad Polit ´ecnica de Madrid, Av. Complutense, 30, 28040 Madrid, Spain
2
Swedish Polar Research Secretariat, P.O. Box 50003, 104 05 Stockholm, Sweden 3
Observatorio Meteorol ´ogico de Alicante, Agencia Estatal de Meteorolog´ıa (AEMET),
C/ Regidor Oca ˜na, 26, 03011 Alicante, Spain
Received: 27 October 2011 – Accepted: 6 November 2011 – Published: 28 November 2011
Correspondence to: U. Y. Jonsell (ulf.jonsell@polar.se)
Published by Copernicus Publications on behalf of the European Geosciences Union.
TCD
5, 3221–3258, 2011Distributed temperature-radiation
index model, Hurd Peninsula Glaciers
U. Y. Jonsell et al.
Title Page
Abstract Introduction
Conclusions References
Tables Figures
◭ ◮
◭ ◮
Back Close
Full Screen / Esc
Printer-friendly Version
Interactive Discussion
Discussion
P
a
per
|
Dis
cussion
P
a
per
|
Discussion
P
a
per
|
Discussio
n
P
a
per
|
Abstract
We use an automatic weather station and mass balance dataset spanning four melt seasons collected on Hurd Peninsula Glaciers, South Shetland Islands, to investigate the point surface energy balance, to determine the absolute and relative contribution of the various energy fluxes acting on the glacier surface and to estimate the sensitivity 5
of melt to ambient temperature changes. Long-wave incoming radiation is the main energy source for melt, while short-wave radiation is the most important flux controlling the variation of both seasonal and daily mean surface energy balance. Short-wave and long-wave radiation fluxes do in general balance each other, resulting in a high correspondence between daily mean net radiation flux and available melt energy flux. 10
We calibrate a distributed melt model driven by air temperature and an expression for the incoming short-wave radiation. The model is calibrated with the data from one of the melt seasons and validated with the data of the three remaining seasons. The model results deviate at most 0.14 m w.e. from the corresponding observations using the glaciological method. The model is very sensitive to changes in ambient tempera-15
ture: a 0.5◦C increase results in 56 % higher melt rates.
1 Introduction
1.1 Background
Retreating and thinning glaciers have come at sharp focus in relation with increased atmospheric temperatures attributed to anthropogenic greenhouse emissions. Air tem-20
perature changes and their associated changes in meteorological conditions will, in different ways and to different extent, affect the various fluxes providing energy for
TCD
5, 3221–3258, 2011Distributed temperature-radiation
index model, Hurd Peninsula Glaciers
U. Y. Jonsell et al.
Title Page
Abstract Introduction
Conclusions References
Tables Figures
◭ ◮
◭ ◮
Back Close
Full Screen / Esc
Printer-friendly Version
Interactive Discussion
Discussion
P
a
per
|
Dis
cussion
P
a
per
|
Discussion
P
a
per
|
Discussio
n
P
a
per
|
quantify the contributing fluxes and form a basis for understanding the coupling be-tween meteorological conditions and glacier melt. As a prognostic tool for the response in energy fluxes, and eventually melt rates, to perturbations in meteorological condi-tions, SEB models have the advantage of being physically based but the disadvan-tage of involving a complicated extrapolation procedure to distribute the fluxes over the 5
glacier surface (Hock, 2005). To overcome this complexity, the simpler temperature-index models, based on the coupling between energy fluxes and temperature, are widely used. They perform best in environments where long-wave radiation and sen-sible heat are the dominating energy sources, as those fluxes are strongly coupled to temperature (Ohmura, 2001), while in environments dominated by solar radiation the 10
model performance is reduced (Sicart et al., 2008). In many glaciated areas of the world, long-wave radiation is the major energy source for melt, but short-wave radia-tion plays a dominant role for the diurnal, daily and inter-seasonal variaradia-tion of energy available for heat and melt (Greuell and Genthon, 2004). Therefore models including representations of a combination of temperature and short-wave radiation are com-15
monly used (e.g. Hock, 1999; Pellicciotti, et al., 2005; Schuler et al., 2005; M ¨oller et al., 2011).
An increasing number of studies based on AWS data combined with glaciologi-cal mass balance data are continuously improving the understanding of glacier SEB and its geographical differences (e.g. Andreasssen et al., 2008; Giesen et al., 2008;
20
Hulth et al., 2010). In this paper we present an AWS record extending over four melt seasons and its associated SEB from a region scarcely represented in the lit-erature, namely the Hurd Peninsula on Livingston Island, South Shetland Islands, an archipelago parallel to the northwestern extreme of the Antarctic Peninsula (Fig. 1). The Antarctic Peninsula region has experienced a remarkable warming during the 25
last decades (Vaughan et al., 2003; Turner et al., 2009). The 41-year long tem-perature record from Bellinghausen research station on King George Island, located about 90 km to the NE of Hurd Peninsula, shows a 0.25◦C per decade warming (http://www.nerc-bas.ac.uk/icd/gjma/temps.html). The impact of the warming in the
TCD
5, 3221–3258, 2011Distributed temperature-radiation
index model, Hurd Peninsula Glaciers
U. Y. Jonsell et al.
Title Page
Abstract Introduction
Conclusions References
Tables Figures
◭ ◮
◭ ◮
Back Close
Full Screen / Esc
Printer-friendly Version
Interactive Discussion
Discussion
P
a
per
|
Dis
cussion
P
a
per
|
Discussion
P
a
per
|
Discussio
n
P
a
per
|
region on glacier dynamics (Rott et al., 1996; Rignot et al., 2004; Scambos et al., 2004; Pritchard and Vaughan, 2007), glacier extent (Rau et al., 2004; Cook et al., 2005), mass balance and melt rates (Braun and Hock, 2004; van den Broeke, 2005; Turner et al., 2005, 2009; Vaughan, 2006) are key scientific questions for understand-ing the contribution of grounded ice losses from this region to future sea level rise. The 5
Hurd Peninsula glaciers mass balance record (Navarro et al., 2011) is the only currently ongoing mass balance programme from the Antarctic Peninsula with both summer and winter balances listed at the World Glacier Monitoring Service, thus providing a par-ticularly suitable field data source for studying the coupling between meteorological conditions and mass balance.
10
We use the AWS record to briefly outline the meteorological conditions at the site and to quantify the absolute fluxes and their relative contribution to melt. We also apply a distributed temperature-radiation index melt model, which is calibrated with in-situ mass balance data obtained using the glaciological method (Navarro et al., 2011). We compare the melt rates obtained from SEB and temperature-index model at the point 15
scale, and use the four years of AWS data to compare the distributed modelled and measured melts. We use the calibrated model to analyze its sensitivity to changes in meteorological conditions. Furthermore, we present a novel approach to handle sub-daily albedo data that reduces the diurnal variations arisen due to measurement deficiencies but keeps the diurnal variations due to changes in cloud cover.
20
1.2 Physical setting
The Hurd Peninsula ice cap (62◦39–42′S, 60◦19–25′W; Fig. 1) covers an area of about 13.5 km2 and spans an altitude range from sea level to about 330 m a.s.l. It is partly surrounded by mountains that reach elevations between 250 and 400 m. Hurd Penin-sula ice cap can be subdivided into two main glacier systems, Johnsons glacier, a 25
tidewater glacier, flowing north-westwards, that terminates on an ice cliff about 50 m
TCD
5, 3221–3258, 2011Distributed temperature-radiation
index model, Hurd Peninsula Glaciers
U. Y. Jonsell et al.
Title Page
Abstract Introduction
Conclusions References
Tables Figures
◭ ◮
◭ ◮
Back Close
Full Screen / Esc
Printer-friendly Version
Interactive Discussion
Discussion
P
a
per
|
Dis
cussion
P
a
per
|
Discussion
P
a
per
|
Discussio
n
P
a
per
|
zero in the snouts of Sally Rocks, Argentina and Las Palmas. Two other basins are also part of the ice cap, both flowing eastwards towards False Bay. However, these are not included in this study because they are heavily crevassed icefalls preventing field measurements. The local ice divide separating Johnsons and Hurd lies between 250 and 330 m a.s.l. Hurd glacier has an average surface slope of about 3◦, though the 5
small westward flowing glacier tongues Argentina and Las Palmas are much steeper (approx. 13◦). Typical slopes for Johnsons glacier range between 10◦in its northern ar-eas and 6◦in the southern ones. The average ice thickness of the ice cap, determined from ground-penetrating radar data in 2000/2001, was 93.6±2.5 m, with maximum val-ues about 200 m in the accumulation area of Hurd glacier (Navarro et al., 2009). The 10
ice surface velocities of Johnsons glacier increase downstream from the ice divide, reaching annual-averaged values up to 65 m a−1at the fastest part of the calving front (Otero et al., 2010), while the largest ice velocities for Hurd glacier are typically about 5 m a−1(Otero, 2008). The Hurd Peninsula ice cap is a polythermal ice mass, showing an upper layer of cold ice, several tens of metres thick, in the ablation area (Molina et 15
al., 2007; Navarro et al., 2009). The cold layer is rather uniform in Hurd glacier, while in Johnsons glacier the layer is more patchy.
The Spanish Antarctic Station Juan Carlos I (JCI) is located very close to Hurd Penin-sula ice cap (Fig. 1). Meteorological measurements are maintained in JCI all year round by an AWS, and are complemented by manual meteorological observations dur-20
ing the summer. In December 2006, an AWS was installed on the upper ablation area of Johnsons Glacier (Fig. 1). The latter provides the main meteorological data source used in this paper and will be further described in the next section.
The Hurd Peninsula ice cap is subjected to the maritime climate of the western Antarctic Peninsula region, with some particularities due to local conditions. The orog-25
raphy of Livingston Island alters the regional prevailing northwesterly dominating wind direction. At JCI and Johnsons Glacier the predominant wind direction is from NNE, fol-lowed by SSW (JCI), ENE (Johnsons Glacier). Average wind speeds are about 4 m s−1, but gusts wind speeds above 30 m s−1 are frequent. The highest wind speeds come
TCD
5, 3221–3258, 2011Distributed temperature-radiation
index model, Hurd Peninsula Glaciers
U. Y. Jonsell et al.
Title Page
Abstract Introduction
Conclusions References
Tables Figures
◭ ◮
◭ ◮
Back Close
Full Screen / Esc
Printer-friendly Version
Interactive Discussion
Discussion
P
a
per
|
Dis
cussion
P
a
per
|
Discussion
P
a
per
|
Discussio
n
P
a
per
|
from East and North-East directions and are associated with deep westward facing low pressure systems passing north of Livingston Island.
The annual average temperature at JCI during the period 2000–2010 was −1.1◦C, with average summer (DJF) and winter (JJA) temperatures of 2.8◦C and−4.4◦C,
re-spectively, with maximum/minimum registered temperatures of 15.5◦C and−22.1◦C.
5
The cloudiness is high, with an average of 6/8 and, consequently, insolation is small, with 2 h day−1 of average insolation during summer and spring, though the cloud-free days during such seasons show a high irradiance. The relative humidity is very high, with average values above 80 % at JCI and 90 % on the glacier (unpublished data from Agencia Estatal de Meteorolog´ıa, AEMET).
10
On the glacier, mass gain is dominated by direct snowfall and wind redistribution of snow, without any contribution from snow avalanches. The glacier ice hardly receives any debris from the surrounding mountains, except at the lowest elevations of its out-lets. Tephra layers from the recent eruptions of the neighbouring Deception Island, however, are a common feature of these glaciers (Pall `as et al., 2001).
15
2 Methods
2.1 AWS data record
The meteorological data used for SEB analysis and as input to the temperature-radiation index melt model was obtained from the AWS located on Johnsons glacier (62◦40.266′N, 60◦21.672′W, 178 m a.s.l. at installation). The AWS (Table 1) was in-20
stalled on the glacier on 16 December 2006, and the record used herein extends to 15 March 2010. During austral winters, major data gaps exist in the record due to energy shortage. However, for the melt seasons, which we focus on, the data gaps are minor. An ultra-sonic ranger was installed next to the AWS, and was used to measure the relative surface height changes caused by ablation or accumulation. Due to malfunc-25
TCD
5, 3221–3258, 2011Distributed temperature-radiation
index model, Hurd Peninsula Glaciers
U. Y. Jonsell et al.
Title Page
Abstract Introduction
Conclusions References
Tables Figures
◭ ◮
◭ ◮
Back Close
Full Screen / Esc
Printer-friendly Version
Interactive Discussion
Discussion
P
a
per
|
Dis
cussion
P
a
per
|
Discussion
P
a
per
|
Discussio
n
P
a
per
|
The data sampling and averaging intervals of the AWS logger differ between the
sum-mer seasons, when regular visits to the AWS are done from the nearby JCI research station, and the unmanned winter seasons. The majority of the data corresponds to the summer seasons, but still a portion was collected during winter mode of opera-tion. Thus, temporal averages of the meteorological parameters are based on different
5
number of readings. In case of missing data due to gaps or preposterous registra-tions, hourly averages are calculated down to the representation of at least one read-ing durread-ing the time interval; else linear interpolation between the adjacent time steps was made for gaps up to four hours. A gap in the temperature and relative humidity records due to sensor malfunctioning, spanning the period 16–24 December 2009 was 10
replaced with temperature data from a T107 thermistor installed on the AWS and with RH data from JCI. Offsets calculated from data two days before and after the gap were
applied. The temperature sensor was unventilated, which at high short-wave radiation fluxes and low wind speeds exaggerates temperatures and we therefore applied the correction to overheating suggested by Smeets (2006) on all air temperature data. 15
2.2 Correction of short-wave radiation and albedo
Large pseudo-diurnal variations in albedo (Fig. 2),α, may arise from the poor cosine response of the pyranometeres at high zenith angles and from an instrument set-up non-parallel to the glacier surface. The bias is mainly introduced by the upward facing sensor as incoming solar radiation flux is less diffuse compared to the outgoing (van
20
den Broeke, 2004). As changes of surface conditions affectingα are of gradual nature,
with the exception of snow falls, van den Broeke (2004) presented an approach to im-prove the accuracy of the incoming short-wave fluxes by filtering out diurnal variations using a 24 h running mean “accumulated” albedo, αd (Eqs. 1 and 2). This approach
was subsequently adapted by others (Andreassen et al., 2008; Giesen et al., 2008). 25
αdis calculated as the ratio between the sums of the instant (measured) outgoing flux,
Sr, and the measured incoming solar radiation flux,Si, with the timing of measurement
TCD
5, 3221–3258, 2011Distributed temperature-radiation
index model, Hurd Peninsula Glaciers
U. Y. Jonsell et al.
Title Page
Abstract Introduction
Conclusions References
Tables Figures
◭ ◮
◭ ◮
Back Close
Full Screen / Esc
Printer-friendly Version
Interactive Discussion
Discussion
P
a
per
|
Dis
cussion
P
a
per
|
Discussion
P
a
per
|
Discussio
n
P
a
per
|
as midpoint. A corrected incoming short-wave flux,Sd, is there after calculated.
αd =
t+12 h
X
t−12 h
Sr/ t+12 h
X
t−12 h
Si
!
, (1)
wheretis time in hours (h).
Sd = Sr/αd (2)
Equation (1) produces a smooth diurnal signal ofαdthat leaves out the extreme values
5
arisen from measurement shortcomings, which normally occur at high zenith angles. Asαdis based on the sums of the short-wave fluxes, the low fluxes occurring at high
zenith angles reduces the impact of the measurement deficiencies onαdandSd.
How-ever, this approach filters out the rapid variations inαassociated with changes in cloud cover also during midday hours when short-wave fluxes are high, which may have sig-10
nificant impact on SEB. The rapid variations are an effect of clouds absorbing radiation
to a higher degree in the near-infrared spectra, leaving a higher portion of the visible wave lengths to reach the ground, for which the snow reflectance is higher. This effect
is further enhanced by multiple reflections between the surface and the cloud base (Warren, 1982; Cutler and Munro, 1996).
15
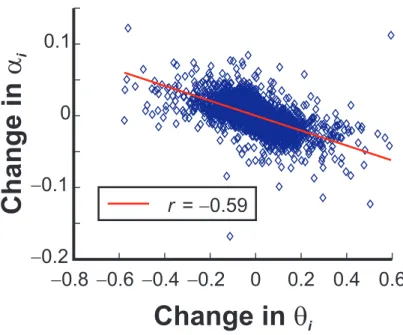
With Eqs. (3) and (4) we present and use an extension of Eq. (1) which yields a corrected albedo,αc, and corrected short-wave flux,Sc, that restore the effect of clouds
reasonably well:
αc =
t+12 h
X
t−12 h
Sr/ t+12 h
X
t−12 h
Si + λ(θi−θd)
!
(3)
Sc = Sr/αc (4)
20
whereλis the slope of the linear relation between the change in instant albedo,αi,and
TCD
5, 3221–3258, 2011Distributed temperature-radiation
index model, Hurd Peninsula Glaciers
U. Y. Jonsell et al.
Title Page
Abstract Introduction
Conclusions References
Tables Figures
◭ ◮
◭ ◮
Back Close
Full Screen / Esc
Printer-friendly Version
Interactive Discussion
Discussion
P
a
per
|
Dis
cussion
P
a
per
|
Discussion
P
a
per
|
Discussio
n
P
a
per
|
between two subsequent recording time steps (Fig. 3). The term restoring the effect of
clouds is proportional to the difference betweenθ
iand its corresponding 24 h running
mean,θd, and scaled byλ.θiis calculated as
θi =
Sc
Itoa
, (5)
where the top of atmosphere radiation,Itoa,is given by
5
Itoa = IS(d /dm)2cos Z, (6)
ISis the solar constant (1366 W m
−2
),d anddmare the instant and mean Sun to Earth
distance, andZ is the local solar zenith angle. A freely available Matlab code based on Reda and Andreas (2008) was used to calculate the required parameters. An iterative procedure is needed for solving Eq. (3) and subsequently Eq. (4) as Eq. (5) usesScas
10
input. The result normally stabilizes after less than five iterations.
Regression analysis to obtain the linear slope λ was applied to each of the four seasonal data sets on all data when zenith angle was 80◦ or less. The resulting four
λ values were all within−0.09±0.01 with correspondingr-values between−0.59 and −0.48. Consequently,λ was statically set to−0.09 in Eq. (3). The daily meanαwill be 15
the same regardless of usingSi,SdorSc as incoming short-wave flux.
Jonsell et al. (2003) found only a limited effect of clouds onα during ice conditions,
probably because the multiple reflection of radiation will be limited due to lower α. The location of the AWS was snow covered during the period of data collection, with the exception of a few days at the end of the melt season 2006/2007, but still withα
20
exceeding 0.55, and therefore we applied Eqs. (3) and (4) to the full data set. The rapid shifts in αc due to sudden changes in Sc are well represented. During early
morning and late afternoon hours an offset towards higher α
c is present. This is due
to reducedθi caused by the longer atmospheric pathway and increased scattering of
solar radiation at high zenith angles, and thus it is not primarily an effect of clouds.
25
However, during the morning and afternoon hoursScis small and the impact on SEB is
TCD
5, 3221–3258, 2011Distributed temperature-radiation
index model, Hurd Peninsula Glaciers
U. Y. Jonsell et al.
Title Page
Abstract Introduction
Conclusions References
Tables Figures
◭ ◮
◭ ◮
Back Close
Full Screen / Esc
Printer-friendly Version
Interactive Discussion
Discussion
P
a
per
|
Dis
cussion
P
a
per
|
Discussion
P
a
per
|
Discussio
n
P
a
per
|
limited, while the correction by Eqs. (3) and (4) during midday hours, whenScis large,
will have greater importance for SEB.
2.3 Energy balance calculation
We calculate SEB, using hourly mean AWS data, to investigate the absolute and rela-tive contribution of the energy fluxes involved in glacier heating and melt. The energy 5
balance condition at the glacier surface is represented by the equation
Sn + Lin + Lout+H+E+G+M = 0, (7)
WhereSnis the net short-wave flux,Lin and Loutare the incoming and outgoing
long-wave fluxes, respectively,His the sensible heat flux, andEis the latent heat flux, which summed up are expressed as the atmospheric energy fluxes, A, and must balance 10
the sum of ground heat flux,G, and melt energy flux, M. A flux is considered to be positive when directed towards the surface. We do not quantify the energy from the sensible heat of rain fall due to lack of precipitation measurements on the glacier, but this term is generally small (Hock, 2005). The long-wave radiation components are, in contrast to their short-wave counterparts, treated separately. This division mirrors 15
better their different physical nature and their different response to atmospheric and
surface conditions (Ohmura, 2001).
We use the bulk aerodynamic method based on Monin-Obukhov length following Hock and Holmgren (2005). No field measurements of the roughness length for mo-mentum (Z0w) are available for the site. Although Z0w is expected to vary with time
20
(Brock et al., 2000; Hock, 2005), we useZ0w as a constant-in-time model parameter to
fit the SEB to the ablation rates estimated from the surface lowering registered by the ultra-sonic ranger. Conversion from surface lowering to mass loss was made by using depth density relations from snow pits dug in the area. The roughness lengths for heat,
Z0T, and moisture, Z0e, are treated as functions of Z0w following Andreas (1987). For
25
TCD
5, 3221–3258, 2011Distributed temperature-radiation
index model, Hurd Peninsula Glaciers
U. Y. Jonsell et al.
Title Page
Abstract Introduction
Conclusions References
Tables Figures
◭ ◮
◭ ◮
Back Close
Full Screen / Esc
Printer-friendly Version
Interactive Discussion
Discussion
P
a
per
|
Dis
cussion
P
a
per
|
Discussion
P
a
per
|
Discussio
n
P
a
per
|
for unstable conditions the expression by Panofsky and Dutton (1984). The best fit was obtained usingZ0w =1×10
−4
m. Surface temperature,Ts, in
◦
C, is calculated fromLoutassuming emissivity of unity:
Ts =
(
(Lout/σ) (1/4)
−273.15 0
, Lout≤315.6 Wm
−2
, , Lout>315.6 Wm
−2
, (8)
whereσis the Stefan-Boltzmann constant (5.67×10⁻⁸).
5
WhenE is negative, the phase change is considered as sublimation, while when it is positive it is considered as condensation or as resublimation, depending on whether
Ts equals or is lower than 0
◦
C.
G could not be captured by any of the sensors of the AWS. On a perfectly temper-ate glacier G is by definition zero. The Hurd Peninsula glaciers are of polythermal 10
type (Navarro at al., 2009) and during the melt seasonG will be directed to heat the cold surface layer. From other studies (see table in Ohmura, 2001) we conclude that the averageG will be limited to a few W m−2, but will occasionally be high due to the release of latent heat at refreezing of melt water upon the first onset of melt in the sum-mer, and during subsequent recommences of melt-refreeze cycles. During the ablation 15
season, melting conditions at the Hurd Peninsula glaciers are repeatedly interrupted by refreezing events. In other modelling approaches, the quantification of the energy com-pensation needed to reach melting conditions after a period of freezing and cooling of the surface (negativeA) differs from full compensation (van de Wal and Russel, 1994)
to no compensation (Hock and Holmgren, 2005). The latter means that, as soon asA
20
turns positive, melting is resumed. Hock and Holmgren (2005) argued that the positive compensation flux will just be a part of the accumulated negative flux, because the latent heat from percolating refreezing melt water will make a significant contribution to the reheating of the cooled volume when melt conditions resume at the surface.
We consider the surface to be melting whenTs>−0.5
◦
C and we setG constant to 25
5 W m−2 during melting. The temperature offset from zero degrees is made to allow
for melting at depths below the surface skin layer thatTs is representing. Sub-surface
TCD
5, 3221–3258, 2011Distributed temperature-radiation
index model, Hurd Peninsula Glaciers
U. Y. Jonsell et al.
Title Page
Abstract Introduction
Conclusions References
Tables Figures
◭ ◮
◭ ◮
Back Close
Full Screen / Esc
Printer-friendly Version
Interactive Discussion
Discussion
P
a
per
|
Dis
cussion
P
a
per
|
Discussion
P
a
per
|
Discussio
n
P
a
per
|
melting at sub-zeroTscan occur because of the ability of short-wave radiation to
pene-trate into the snow cover, where the thermal conductivity is low (Koh and Jordan, 1995). We consider that the surface is refreezing and cooling whenAturns negative, and to be heated to resume to melt conditions whenA is positive andTs<−0.5
◦
C. Thus G
balances Aduring non-melting conditions. In practice this implies that the refreezing 5
flux (negativeA) is compensated by the positive flux ofAwhenTs<−0.5
◦
C. Melt rates calculated via the energy balance are converted to water equivalent (w.e.) using the latent heat of fusion (334×10−3J kg−1).
Following Sicart et al. (2008), we describe the relative contribution of the energy fluxes to the variation ofAas
10
ρx =
rxσx
σA , (9)
where rx is the correlation coefficient of flux x to A, and σx,σA are their respective standard deviations. The sum ofρxfor all fluxes contributing toAis one.
2.4 Temperature index model description
We performed the surface melt modelling and the sensitivity analysis to perturbations 15
in meteorological conditions using a grid-based distributed temperature-radiation index model following Hock (1999):
Mxy =
Txy(Dxyδsnow/ice+m), Txy ≥ 0
0 , Txy ≤ 0
(10)
where Mxy is the modelled melt at a specific grid cell. The melt factor, m, and the
surface specific radiation factor,δsnow/ice, are model parameters obtained via
calibra-20
tion. The temperature at a specific grid cell, Txy, is given by the AWS temperature
record with an offset based on altitude difference and air temperature lapse rate. Dis
TCD
5, 3221–3258, 2011Distributed temperature-radiation
index model, Hurd Peninsula Glaciers
U. Y. Jonsell et al.
Title Page
Abstract Introduction
Conclusions References
Tables Figures
◭ ◮
◭ ◮
Back Close
Full Screen / Esc
Printer-friendly Version
Interactive Discussion
Discussion
P
a
per
|
Dis
cussion
P
a
per
|
Discussion
P
a
per
|
Discussio
n
P
a
per
|
conditions usingθi:
D = I
S(
d dm)
2(cosβcosZ + sinβsinZ cos(Ω
−Θ))θi, (11)
where Z is the solar zenith angle,Ωis the solar azimuth,βis the surface slope angle
and Θis the surface aspect. We consideredZ and Ωto be spatially constant in the
study area, while we calculated β and Θ from a digital elevation model (DEM). The
5
DEM has a grid cell resolution of 25 m and was obtained by kriging interpolation from 852 points surveyed in 2000/2001. The surrounding rock topography was digitized from Servicio Geogr ´afico del Ej ´ercito 1:25000 map for Hurd Peninsula (SGE, 1991).
A shaded grid cell implies thatDis set to zero. We calculated the shading of grid cells by applying standard geometry on the DEM. When the AWS is shaded in the sunset, 10
the preceding non-shaded value ofθiis used to calculate non-shaded grid cells, while
the subsequent non-shaded value is used in the sunrise.
We initialized the model with a distributed snow cover thickness which is continuously reduced with the daily modelled melt and increased in case snow fall was registered by the ultra-sonic ranger. We distributed the snow fall following the mean accumulation 15
pattern obtained from determining the mass balance by the glaciological method for the period 2001–2010 (Navarro et al., 2011). We obtained the initial snow cover grid of each season by interpolating snow depth measurements conducted simultaneously to the first stake height reading, and converting it into mass loss using the density measurements from three snow pits conducted at the beginning of the melt season. 20
2.5 Temperature-radiation index model calibration
The model calibration is based on comparing the mass balance, b, of a number of stakes obtained by the glaciological method (Navarro et al., 2011) and the model results for the grid cells corresponding to the stake positions. As Eq. (10) is set to compute melt during a specific period and notb, snow fall rates registered by the ultra-25
TCD
5, 3221–3258, 2011Distributed temperature-radiation
index model, Hurd Peninsula Glaciers
U. Y. Jonsell et al.
Title Page
Abstract Introduction
Conclusions References
Tables Figures
◭ ◮
◭ ◮
Back Close
Full Screen / Esc
Printer-friendly Version
Interactive Discussion
Discussion
P
a
per
|
Dis
cussion
P
a
per
|
Discussion
P
a
per
|
Discussio
n
P
a
per
|
melt to produce comparable figures. We assumed a snow density of 300 kg m−3 for fresh snow.
We converted the stake height differences into water equivalents using the density
measurements from three snow pits at the beginning and the end of the melt season. As densification of the snow pack due to refreezing of melt water is expected during 5
the melt season, the total mass loss at each stake in the end of the calibration period is given by the beginning of the season mass minus the end of the season mass. On average, the end of melt season densities were 14 % higher. Snow density is however expected to show local variations and introduces a source of error. Based on extensive density measurements during 2004–2010 on Johnsons and Hurd glaciers (Navarro et 10
al., 2011), the relative double standard deviation of all measured snow densities was 13 % and provides an indication on the error involved. Where the model indicates ice at the surface, we used a density of 900 kg m−3to convert into water equivalents.
Among the four seasons with data available from the AWS, we chose the period 29/11/2008–10/02/2009 as calibration period as it provided the best combination of the 15
following criteria: number of stakes, length of calibration period, high ablation rates, and number of stakes on ice surface at the end of the period. For the calibration period 2008/2009 the total snowfall registered by the ultra-sonic ranger was 0.05 m w.e.
We calibrated the model parameters to obtain the least mean root square error be-tween modelled and measured b (Fig. 5, Table 2), with the criteria that σice>σsnow
20
to reflect the higher absorption of short-wave radiation on an ice surface. As pointed out by others (Hock, 1999; Schuler et al., 2007), the calibration of the current for-mulation of the model is not unambiguous as it is possible to find different sets of
tuning parameters giving equally good fits to the observed data. Based on best per-formance in the subsequent validation of the model, we usedm=0.092 mm h−1K−1,
25
δsnow = 1.9×10
−3
mm m2W−1h−1K−1,and δice=4.4×10
−3
TCD
5, 3221–3258, 2011Distributed temperature-radiation
index model, Hurd Peninsula Glaciers
U. Y. Jonsell et al.
Title Page
Abstract Introduction
Conclusions References
Tables Figures
◭ ◮
◭ ◮
Back Close
Full Screen / Esc
Printer-friendly Version
Interactive Discussion
Discussion
P
a
per
|
Dis
cussion
P
a
per
|
Discussion
P
a
per
|
Discussio
n
P
a
per
|
3 Results and discussion
3.1 Temperature and energy fluxes during the melt seasons
For simple comparison, we set the periods of SEB analysis to a standard melt season 15 December–15 March, which corresponds to the period with most surface melt. Melt seasons are characterized by a mean temperature close to zero (Table 3). Hourly mean 5
temperature rarely deviates more than±5◦C from zero (Fig. 6), due to the maritime
setting of the glaciers. Maximum (minimum) hourly mean temperature during the four seasons was 6.8◦C (−8.2◦C) and the four seasonal mean temperatures ranged within 0.7◦C. Seasonal meanα showed only small variations and was lowest in 2006/2007, which was the only season when ice surfaced at the location of the AWS.
10
For all seasons the main energy source (sink) was Lin (Lout) and the resulting
mean long-wave net flux was negative. The net short-wave flux, Sn, together with
Lin, show the highest inter-seasonal variations, but are opposing each other yielding a
reduced variation in mean seasonalAto a maximum of 5 W m−2, which is equivalent to 0.11 m w.e. of melt for a full melt season. The inter-seasonal variation inSnis driven, 15
with similar weights, by the variations inαandSc.Snwas for all seasons the individual
source with best fit toA (Table 4) and was also, expressed as ρ, the flux having the highest influence on the variation ofA. In 2009/2010ρ was 120 %, as the variation was counteracted byLin. The generally negative coupling betweenLin andSn is mainly an
effect of their different response to cloud cover. ρforLin varies between the individual
20
seasons from positive, through insignificant, to negative. This reflects the complex bal-ancing ofAas a response to the meteorological conditions and is exemplified in Fig. 7. During 2009/2010 the anti-correlation betweenSn and Lin was strong and days with
high daily meanAwere in general associated with the outer ranges ofSncompared to
the season 2006/2007, when anti-correlation was weak and days with highAwere in 25
general associated with intermediate daily meanSn. The standard deviation ofScwas
higher in 2009/2010, indicating a season with more contrast between clear and cloudy days, which may explain the different modes.
TCD
5, 3221–3258, 2011Distributed temperature-radiation
index model, Hurd Peninsula Glaciers
U. Y. Jonsell et al.
Title Page
Abstract Introduction
Conclusions References
Tables Figures
◭ ◮
◭ ◮
Back Close
Full Screen / Esc
Printer-friendly Version
Interactive Discussion
Discussion
P
a
per
|
Dis
cussion
P
a
per
|
Discussion
P
a
per
|
Discussio
n
P
a
per
|
The negative coupling betweenLinandSnresults in a high correspondence between
net radiation,R, andA.R explains up to 82 % of the variation ofAfor an individual sea-son. The turbulent fluxes,H andE, have, considering their low mean absolute values, a proportionally large impact on the variation ofAthat was largest in 2008/2009, when they together explain a third of the variance ofAwhile the influence ofSnwas reduced.
5
The coupling between Tair and the energy fluxes constituting A is the physical basis
of the temperature-index models. Tair was best correlated withA during the seasons
2006/2007 and 2008/2009, coinciding with the highestρofLin.TairandSnwere slightly
negatively or insignificantly correlated, with the highest correlation factor (−0.47) occur-ring in 2007/2008. The generally low correspondence betweenAandTair, in particular
10
for 2007/2008 and 2009/2010, is discouraging for using a solely temperature-driven ablation model, both at point scale and distributed over the glacier. The degree of ex-planation for the variation ofAwhen using a combination ofTairandSnbecomes similar
for all seasons and is just slightly lower than the corresponding degree of explanation forR. In a combination whereSn is substituted by D, thus corresponding to the input
15
parameters in the temperature radiation-index model (Fig. 8), the degree of explana-tion is only slightly lower. Using a distributed model driven byD instead ofSnreduces the complexity and avoids the source of error associated with introducing a spatial and temporal modelling ofα that is required for a model driven bySn.
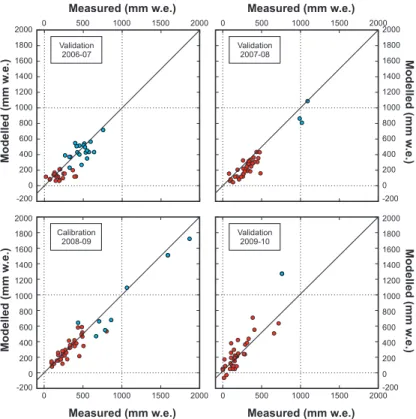
3.2 Model validation and sensitivity analysis
20
The calibrated model was run on three periods from other melt seasons for which corresponding stake measurements and data from AWS were available (Table 2). The period from season 2006/2007 is significantly shorter than the others because the installation of the AWS took place several weeks after the first stake reading of the season and thus the period of correspondence starts with the second set of stake 25
readings of the season.
TCD
5, 3221–3258, 2011Distributed temperature-radiation
index model, Hurd Peninsula Glaciers
U. Y. Jonsell et al.
Title Page
Abstract Introduction
Conclusions References
Tables Figures
◭ ◮
◭ ◮
Back Close
Full Screen / Esc
Printer-friendly Version
Interactive Discussion
Discussion
P
a
per
|
Dis
cussion
P
a
per
|
Discussion
P
a
per
|
Discussio
n
P
a
per
|
underestimates b by 0.14 m w.e., which is slightly larger than the typical error of the glaciological method (ca. 0.1 m w.e.; Jansson, 1999). The scatter from a linear relation between observed and modelledb is large for the short validation period 2006/2007. This might be explained by the fact that during the validation period a large part of the surface at the position of the stakes changed from snow to ice conditions, and thus the 5
actual more gradual transition between snow and ice compared to the model’s binary set-up, may reduce the model performance. b in 2009/2010 was small because of a combination of little melt and extensive snow fall. The discrepancies between the modelled and the observed distributions of the snow fall possibly introduces a signifi-cantly larger error compared to the other years, which is exemplified by an outlier that 10
was falsely modelled as ice surface for much of the period. The difference in seasonal
meanTairandDis modest. A higher inter-seasonal variation, reflecting more
contrast-ing weather conditions between the periods, would possibly have enhanced the validity test of the model.
We analyzed the sensitivity of the model by applying perturbations to the calibrated 15
model parameters, and to the meteorological parameters by manipulating the original AWS data corresponding to the calibration period.
Changes in m by ±10 % produce a change in melt of a few percent (Fig. 9), while a similar change inδsnow/ice varies the total modelled melt by about±10 % (or
±0.05 m w.e.). A change by±50 % in snow cover thickness over the entire glacier
sur-20
face, that influences the temporal and spatial distribution of snow and ice represented in the model through variations in the use ofδsnow orδice, changes the melt rates by
less than 10 %.
We run the model with a step increase of 0.5◦C in Tair, which is of the same
mag-nitude as one standard deviation of the summer mean temperature for the last 30 25
years from the nearest long-term temperature instrument record (Bellinghausen Sta-tion on King George Island) and close to half a standard variaSta-tion of the daily meanTair
for the calibration period. The corresponding modelled melt rates increased by 56 % to 0.81 m w.e. A temperature decrease of the same magnitude resulted in a reduction
TCD
5, 3221–3258, 2011Distributed temperature-radiation
index model, Hurd Peninsula Glaciers
U. Y. Jonsell et al.
Title Page
Abstract Introduction
Conclusions References
Tables Figures
◭ ◮
◭ ◮
Back Close
Full Screen / Esc
Printer-friendly Version
Interactive Discussion
Discussion
P
a
per
|
Dis
cussion
P
a
per
|
Discussion
P
a
per
|
Discussio
n
P
a
per
|
of melt by 44 % to 0.30 m w.e. There is a strong temperature threshold effect which is
illustrated by the change in number of grid cells integrated over all the time steps where the model indicates melting conditions. For the temperature increase (decrease) sce-nario the change was+52 % (−54 %).
MeanTair for the validation period 2009/2010 was 0.5
◦
C colder than that of the cal-5
ibration season 2008/2009, whileD and Sn registered at the AWS were similar. The
periods are of similar lengths and we note that the measured melt rate in 2009/2010 was 38 % lower than the melt measured in 2008/2009, which is close to the modelled response to a 0.5◦C temperature decrease on the 2008/2009 data.
Because of the limited elevation range of the glacier, the entire glacier area experi-10
ences temperatures flickering around zero during summer time. This leads to a high sensitivity to temperature changes during the melt seasons.
We perturbed the radiation climate represented in the model by changingθi, as the
other inputs to obtainDare not related to the meteorological conditions on the glacier. We run the model with a step change inθithat, just as in theTairscenario, corresponds
15
to half a standard deviation of the daily means (0.06). An increase inθi(implying more
direct solar radiation) leads to 15 % more melt (0.08 m w.e.), and a similar decrease in melt for a corresponding decrease inθi.
Tair and θi are anti-correlated in the AWS record, meaning that under present
cli-mate a temperature increase is in general associated with a cloudier sky. Extrapolating 20
this to a temperature increase driven by climate change implies that an increased melt due to higher temperature will to some extent be balanced by reduced direct radia-tion. However, climate change at these latitudes will probably be mainly driven by the associated changes in cyclonic activity and pathways, hence changes will neither be static nor solely impact a single meteorological parameter, and the model sensitivity as 25
TCD
5, 3221–3258, 2011Distributed temperature-radiation
index model, Hurd Peninsula Glaciers
U. Y. Jonsell et al.
Title Page
Abstract Introduction
Conclusions References
Tables Figures
◭ ◮
◭ ◮
Back Close
Full Screen / Esc
Printer-friendly Version
Interactive Discussion
Discussion
P
a
per
|
Dis
cussion
P
a
per
|
Discussion
P
a
per
|
Discussio
n
P
a
per
|
4 Conclusions
We have used an AWS record located on Hurd Peninsula glaciers, Livingston Island, to analyse the SEB for four melt seasons (2006/2007–2009/2010). Further, we set up and run a temperature-radiation index model. The model was calibrated and validated with
bobtained with the glaciological method. A novel correction method ofαi, which adds
5
the diurnal variation of clouds on a 24 h running mean α, is presented and adopted. The advantage of the method is that the rapid and large variations during the high fluxes at midday in the short-wave balance are better reproduced. The following main conclusions can be drawn from our analysis:
1. Snis the most important individual energy flux impacting on the variation inA, but
10
using the combined expression of the radiation fluxes,R, the degree of explana-tion increases and can account for 76–82 % of the variaexplana-tion inA. This high degree of explanation is due to a balancing of the generally anti-correlated fluxesSnand
Lin, which is mainly an effect of their different response to cloud cover.
2. The seasonal means of Tair at the AWS site are close to zero during the four
15
melt seasons, and due to the small altitude range of the glaciers their whole area shows temperatures flickering around zero degrees during the summer season. The poor correlation factors between daily meanTair andAquestions the
perfor-mance of a solely temperature-based melt model, both at point scale and dis-tributed over the glacier, and supports the use of a temperature radiation-index 20
model. A combination of Tair with Sn orD increases the correlation factor at the
point scale.
3. The modelled mass balance is in good agreement with that obtained by the glacio-logical method, showing differences model-observations generally below the
typ-ical error of the glaciologtyp-ical method (ca. 0.1 m w.e., Jansson, 1999), with no sig-25
nificant bias.
TCD
5, 3221–3258, 2011Distributed temperature-radiation
index model, Hurd Peninsula Glaciers
U. Y. Jonsell et al.
Title Page
Abstract Introduction
Conclusions References
Tables Figures
◭ ◮
◭ ◮
Back Close
Full Screen / Esc
Printer-friendly Version
Interactive Discussion
Discussion
P
a
per
|
Dis
cussion
P
a
per
|
Discussion
P
a
per
|
Discussio
n
P
a
per
|
4. The model results show that these glaciers are very sensitive to air tempera-ture changes. An increase (decrease) in temperatempera-ture of 0.5◦C implies an in-crease (dein-crease) of the melt rates by about 56 % (44 %), which is an effect of
the strong zero degree threshold for onset of melt. The high model sensitivity of these glaciers to temperature change are indicative, but it must be noted that it 5
only provides a first level of understanding of the response of the glacier mass balance to real climatic changes.
5. An increase (decrease) in the fraction of potential top of atmosphere radiation that reaches the ground,θi, by half a standard deviation of its daily mean leads to an
TCD
5, 3221–3258, 2011Distributed temperature-radiation
index model, Hurd Peninsula Glaciers
U. Y. Jonsell et al.
Title Page
Abstract Introduction
Conclusions References
Tables Figures
◭ ◮
◭ ◮
Back Close
Full Screen / Esc
Printer-friendly Version
Interactive Discussion
Discussion
P
a
per
|
Dis
cussion
P
a
per
|
Discussion
P
a
per
|
Discussio
n
P
a
per
|
List of symbols
A – atmospheric energy fluxes=R+H +E
b – mass balance
danddm – instant and mean Sun to Earth distance
D – representation of the direct solar radiation flux (according to Eq. 11)
E – latent heat flux
G – ground heat flux
H – sensible heat flux
IS – solar constant (1366 W m
−2 ) Itoa – top of atmosphere radiation
LinandLout – incoming and outgoing long-wave fluxes
m – melt factor
M – melt energy flux
rx – correlation coefficient of fluxxtoA
R – net radiation
Sc – corrected (according to Eq. 4) incoming short-wave flux Sd – corrected (according to Eq. 2) incoming short-wave flux Si – measured incoming solar radiation flux
Sn – net short-wave flux=Sc+Sr
Sr – instant measured outgoing short-wave flux
Tair – air temperature
Ts – surface temperature
Xxy – value of variableXat a specific grid cell
Z – solar zenith angle
Z0e – roughness length for moisture Z0T – roughness length for heat
Z0w – roughness length for momentum
α – albedo
αc – corrected (according to Eq. 3) albedo αd – corrected (according to Eq. 1) albedo
αi – instant albedo
β – surface slope angle
δsnow/ice – radiation factor of snow/ice
λ – slope of linear relation between the change inαiandθi, between two subsequent time steps
Ω – solar azimuth
ρx – relative contribution of the energy fluxxto the variation ofA σ – Stefan-Boltzmann constant (5.67×10⁻⁸)
σx – standard deviation ofx
θi – instant fraction of potential top of atmosphere radiation that reaches the ground
θd – 24 h running mean ofθi
Θ – surface aspect
TCD
5, 3221–3258, 2011Distributed temperature-radiation
index model, Hurd Peninsula Glaciers
U. Y. Jonsell et al.
Title Page
Abstract Introduction
Conclusions References
Tables Figures
◭ ◮
◭ ◮
Back Close
Full Screen / Esc
Printer-friendly Version
Interactive Discussion
Discussion
P
a
per
|
Dis
cussion
P
a
per
|
Discussion
P
a
per
|
Discussio
n
P
a
per
|
Acknowledgements. We thank all those who participated in the fieldwork, including
glaciolo-gists and meteorological and mountain technicians, as well as the teams of JCI station during
the different campaigns spanned by our study period. A special mention is owed to AEMET
technicians Jos ´e Vicente Albero and Jos ´e Juan Garc´ıa-Ayala. Marco M ¨oller is thanked for
fruit-ful comments on the manuscript. This research was funded by projects CGL2005-05483 and
5
CTM2008-05878/ANT from the Ministry of Science and Innovation.
References
Andreas, E. L.: A Theory for the Scalar Roughness and the Scalar Transfer-Coefficients over
Snow and Sea Ice, Bound-Lay. Meteorol., 38, 159–184, 1987.
Andreassen, L. M., van den Broeke, M. R., Giesen, R. H., and Oerlemans, J.: A 5 year record
10
of surface energy and mass balance from the ablation zone of Storbreen, Norway, J. Glaciol., 54, 245–258, 2008.
Beljaars, A. C. M. and Holtslag, A. A. M.: Flux Parameterization over Land Surfaces for Atmo-spheric Models, J. Appl. Meteorol., 30, 327–341, 1991.
Braun, M. and Hock, R.: Spatially distributed surface energy balance and ablation modeling of
15
the ice cap of King George Island (Antarctica), Global Planet. Change, 42, 45–48, 2004. Brock, B. W., Willis, I. C., Sharp, M. J., and Arnold, N. S.: Modelling seasonal and spatial
variations in the surface energy balance of Haut Glacier d’Arolla, Switzerland, Ann. Glaciol., 31, 53–62, 2000.
Cook, A. J., Fox, A. J., Vaughan, D. G., and Ferrigno, J. G.: Retreating glacier fronts on the
20
Antarctic Peninsula over the past half-century, Science, 308, 541–544, 2005.
Cutler, P. M. and Munro, D. S.: Visible and near-infrared reflectivity during the ablation period on Peyto Glacier, Alberta, Canada, J. Glaciol., 42, 333–340, 1996.
Giesen, R. H., van den Broeke, M. R., Oerlemans, J., and Andreassen, L. M.: Surface energy balance in the ablation zone of Midtdalsbreen, a glacier in southern Norway: Interannual
25
variability and the effect of clouds, J. Geophys. Res., 113, D21111, doi:1029/2008JD010390,
2008.
TCD
5, 3221–3258, 2011Distributed temperature-radiation
index model, Hurd Peninsula Glaciers
U. Y. Jonsell et al.
Title Page
Abstract Introduction
Conclusions References
Tables Figures
◭ ◮
◭ ◮
Back Close
Full Screen / Esc
Printer-friendly Version
Interactive Discussion
Discussion
P
a
per
|
Dis
cussion
P
a
per
|
Discussion
P
a
per
|
Discussio
n
P
a
per
|
edited by: Bamber, J. L. and Payne, A. J., 117–168, Cambridge University Press, Cambridge, UK, 2004.
Hock, R.: A distributed temperature-index ice- and snowmelt model including potential direct solar radiation, J. Glaciol., 45, 101–111, 1999.
Hock, R.: Glacier melt: a review of processes and their modelling, Prog. Phys. Geog., 29,
5
362–391, 2005.
Hock, R. and Holmgren, B.: A distributed surface energy-balance model for complex topogra-phy and its application to Storglaciaren, Sweden, J. Glaciol., 51, 25–36, 2005.
Hulth, J., Rolstad, C., Trondsen, K., and Rodby, R. W.: Surface mass and energy balance of Sorbreen, Jan Mayen, 2008, Ann. Glaciol., 51, 110–119, 2010.
10
Jansson, P.: Effect of uncertainties in measured variables on the calculated mass balance of
Storglaci ¨aren, Geogr. Ann., 81A, 633–642, 1999.
Jonsell, U., Hock, R., and Holmgren, B.: Spatial and temporal variations in albedo on Stor-glaciaren, Sweden, J. Glaciol., 49, 59–68, 2003.
Koh, G. and Jordan, R.: Subsurface melting in a seasonal snow cover, J. Glaciol., 41, 474–482,
15
1995.
Molina, C., Navarro, F. J., Calvet, J., Garc´ıa-Sell ´es, D., and Lapazaran, J. J.: Hurd Peninsula
glaciers, Livingston Island, Antarctica, as indicators of regional warming: ice volume changes during the period 1956–2000, Ann. Glaciol., 46, 43–49, 2007.
M ¨oller, M., Finkelnburg, R., Braun, M., Hock, R., Jonsell, U., Pohjola, V., Scherer, D., and
20
Schneider, C.: Climatic mass balance of the ice cap Vestfonna, Svalbard – a spatially dis-tributed assessment using ERA-Interim and MODIS data, J. Geophys. Res., 116, F03009, doi:10.1029/2010JF001905, 2011.
Navarro, F. J., Otero, J., Macheret, Yu. Ya., Vasilenko, E. V., Lapazaran, J. J., Ahlstrøm, A. P., and Mach´ıo, F.: Radioglaciological studies on Hurd Peninsula glaciers, Livingston Island,
25
Antarctica, Ann. Glaciol., 50, 17–24, 2009.
Navarro, F. J., Jonsell, U. Y., Corcuera, M. I., and Mart´ın-Espa ˜nol, A.: Decelerated mass loss
of Hurd and Johnsons glaciers, Livingston Island, Antarctic Peninsula, in spite of continued regional warming, in prep., 2011.
Ohmura, A.: Physical basis for the temperature-based melt-index method, J. Appl. Meteorol.,
30
40, 753–761, 2001.
Otero, J.: Generaci ´on autom ´atica de malla de elementos finitos en modelos evolutivos de din ´amica de glaciares, PhD thesis, Universidad Polit ´ecnica de Madrid, Spain, 131 pp., 2008.
TCD
5, 3221–3258, 2011Distributed temperature-radiation
index model, Hurd Peninsula Glaciers
U. Y. Jonsell et al.
Title Page
Abstract Introduction
Conclusions References
Tables Figures
◭ ◮
◭ ◮
Back Close
Full Screen / Esc
Printer-friendly Version
Interactive Discussion
Discussion
P
a
per
|
Dis
cussion
P
a
per
|
Discussion
P
a
per
|
Discussio
n
P
a
per
|
Otero, J., Navarro, F. J., Mart´ın, C., Cuadrado, M. L., and Corcuera, M. I.: A three-dimensional
calving model: numerical experiments on Johnsons Glacier, Livingston Island, Antarctica, J. Glaciol., 56, 200–214, 2010.
Pall `as, R., Smellie, J. L., Casas, J. M., and Calvet, J.: Using tephrochronology to date temper-ate ice: correlation between ice tephras on Livingston Island and eruptive units on Deception
5
Island volcano (South Shetland Islands, Antarctica), Holocene, 11, 149–160, 2001.
Panofsky, H. A. and Dutton, J. A.: Atmospheric turbulence: models and methods for engineer-ing applications, Wiley-Interscience, New York, USA, 397 pp., 1984.
Pellicciotti, F., Brock, B., Strasser, U., Burlando, P., Funk, M., and Corripio, J.: An enhanced temperature-index glacier melt model including the shortwave radiation balance:
develop-10
ment and testing for Haut Glacier d’Arolla, Switzerland, J. Glaciol., 51, 573–587, 2005. Pritchard, H. D. and Vaughan, D. G.: Widespread acceleration of tidewater glaciers on the
Antarctic Peninsula, J. Geophys. Res., 112, F03S29, doi:10.1029/2006JF000597, 2007. Rau, F., Mauz, F., De Angelis, H., Ja ˜na, R., Arigony Neto, J., Skvarca, P., Vogt, S., Saurer, H.,
and Gossmann, H.: Variations of glacier frontal positions on Northern Antarctic Peninsula,
15
Ann. Glaciol., 39, 525–530, 2004.
Reda, I. and Andreas, A.: Solar position algorithm for solar radiation application, National Renewable Energy Laboratory (NREL), Golden, Colorado, USA, Technical Rep. NREL/TP-560-34302, 56 pp., 2008.
Rignot, E., Casassa, G., Gogineni, P., Krabill, W., Rivera, A., and Thomas, R.: Accelerated ice
20
discharge from the Antarctic Peninsula following the collapse of Larsen B ice shelf, Geophys. Res. Lett., 31, L18401, doi:10.1029/2004GL020697, 2004.
Rott, H., Skvarca, P., and Nagler, T.: Rapid Collapse of Northern Larsen Ice Shelf, Antarctica, Science, 271, 788–792, doi:10.1126/science.271.5250.788, 1996.
Scambos, T. A., Bohlander, J. A., Shuman, C. A., and Skvarca, P.: Glacier acceleration and
25
thinning after ice shelf collapse in the Larsen B embayment, Antarctica, Geophys. Res. Lett., 31, L18402, doi:10.1029/2004GL020670, 2004.
Schuler, T. V., Hock, R., Jackson, M., Elvehoy, H., Braun, M., Brown, I., and Hagen, J. O.: Dis-tributed mass-balance and climate sensitivity modelling of Engabreen, Norway, Ann. Glaciol., 42, 395–401, 2005.
30
TCD
5, 3221–3258, 2011Distributed temperature-radiation
index model, Hurd Peninsula Glaciers
U. Y. Jonsell et al.
Title Page
Abstract Introduction
Conclusions References
Tables Figures
◭ ◮
◭ ◮
Back Close
Full Screen / Esc
Printer-friendly Version
Interactive Discussion
Discussion
P
a
per
|
Dis
cussion
P
a
per
|
Discussion
P
a
per
|
Discussio
n
P
a
per
|
Servicio Geogr ´afico del Ej ´ercito (SGE): Livingston Island, Hurd Peninsula, 1:25000 map, 1 Edn., Madrid, Spain, 1991.
Sicart, J. E., Hock, R., and Six, D.: Glacier melt, air temperature, and energy balance in different
climates: The Bolivian Tropics, the French Alps, and northern Sweden, J. Geophys. Res., 113, D24113, doi:10.1029/2008JD010406, 2008.
5
Smeets, C. J. P. P.: Assessing unaspirated temperature measurements using a thermocou-ple and a physically based model, in: The mass budget of Arctic glaciers. Extended ab-stracts, Workshop and GLACIODYN Planning Meeting, 29 January-3 February 2006, Ober-gurgl, Austria, published by the Institute for Marine and Atmospheric Research, Utrecht, The Netherlands, 99-101, 2006.
10
Turner, J., Colwell, S. R., Marshall, G. J., Lachlan-Cope, T. A., Carleton, A. M., Jones, P. D., Lagun, V., Reid, P. A., and Iagovkina, S.: Antarctic climate change during the last 50 years, Int. J. Climatol., 25, 279–294, 2005.
Turner, J., Bindschadler, R. A., Convey, P., Di Prisco, G., Fahrbach, E., Gutt, J., Hodgson, D. A., Mayewski, P. A., and Summerhayes, C. P.: Antarctic Climate Change and the Environment,
15
Scientific Committee on Antarctic Research, Cambridge, UK, 555 pp., 2009.
van de Wal, R. S. W. and Russel, A. J.: A comparison of energy balance calculations measured ablation and runoffnear Sondre Stromfjord, West Greenland, Global Planet. Change, 9, 29–
38, 1994.
van den Broeke, M., van As, D., Reijmer, C., and van de Wal, R.: Assessing and improving
20
the quality of unattended radiation observations in Antarctica, J. Atmos. Ocean. Tech, 21, 1417–1431, 2004.
van den Broeke, M.: Strong surface melting preceded collapse of Antarctic Peninsula ice shelf, Geophys. Res. Lett., 32, L12815, doi:10.1029/2005GL023247, 2005.
Vaughan, D. G.: Recent trends in melting conditions on the Antarctic Peninsula and their
im-25
plications for ice-sheet mass balance and sea level, Arct. Antarct. Alp. Res., 38, 147–152., 2006.
Vaughan, D. G., Marshall, G. J., Connolley, W. M., Parkinson, C., Mulvaney, R., Hodgson, D. A., King, J. C., Pudsey, C. J., and Turner, J.: Recent rapid regional climate warming on the Antarctic Peninsula, Climatic Change, 60, 243–274, 2003.
30
Warren, S. G.: Optical-Properties of Snow, Rev. Geophys., 20, 67–89, 1982.
TCD
5, 3221–3258, 2011Distributed temperature-radiation
index model, Hurd Peninsula Glaciers
U. Y. Jonsell et al.
Title Page
Abstract Introduction
Conclusions References
Tables Figures
◭ ◮
◭ ◮
Back Close
Full Screen / Esc
Printer-friendly Version
Interactive Discussion
Discussion
P
a
per
|
Dis
cussion
P
a
per
|
Discussion
P
a
per
|
Discussio
n
P
a
per
|
Table 1.Instruments of the AWS.
Parameter Sensor Accuracy
Relative humidity Vaisala HMP45C RH±2 %@0◦C
Air temperature Vaisala HMP45C Tair±0.3◦C@0◦C
Radiation, four components Kipp&Zonen CNR1 ±10% daily total
Wind speed and direction Young 05103-45 ±0.3 m s−1
,±3◦
TCD
5, 3221–3258, 2011Distributed temperature-radiation
index model, Hurd Peninsula Glaciers
U. Y. Jonsell et al.
Title Page
Abstract Introduction
Conclusions References
Tables Figures
◭ ◮
◭ ◮
Back Close
Full Screen / Esc
Printer-friendly Version
Interactive Discussion
Discussion
P
a
per
|
Dis
cussion
P
a
per
|
Discussion
P
a
per
|
Discussio
n
P
a
per
|
Table 2.Characteristics of model calibration and validation runs.
Season Type Period No. of No. of Modelled Modelled Snow fall Modelledb rms D Tair S Measuredb Measured
days stakes melt melt rate (mm w.e.) (mm w.e.) (Wm−2) (◦C) (Wm−2) (mm w.e.) melt rate
(mm w.e.) (mm day−1
) (mm day−1
)
2006/2007 Validation 25 Jan–24 Feb 31 41 280 9.0 15 276 142 142 0.5±1.1 48.7 290 9.8
2007/2008 Validation 05 Dec–20 Feb 78 37 322 4.1 57 280 196 196 −0.2±1.4 47.2 420 6.1
2008/2009 Calibration 29 Nov–10 Feb 74 42 529 7.1 51 481 115 197 0.1±1.2 49.5 430 6.5
2009/2010 Validation 09 Dec–01 Mar 82 36 301 3.7 159 196 161 198 −0.4±1.4 48.0 170 4.0