www.the-cryosphere.net/6/841/2012/ doi:10.5194/tc-6-841-2012
© Author(s) 2012. CC Attribution 3.0 License.
The Cryosphere
Surface and snowdrift sublimation at Princess Elisabeth station,
East Antarctica
W. Thiery1, I. V. Gorodetskaya1, R. Bintanja2, N. P. M. Van Lipzig1, M. R. Van den Broeke3, C. H. Reijmer3, and P. Kuipers Munneke3
1Department of Earth and Environmental Sciences, University of Leuven, Leuven, Belgium 2KNMI (Royal Netherlands Meteorological Institute), De Bilt, The Netherlands
3Institute for Marine and Atmospheric Research, Utrecht University, Utrecht, The Netherlands Correspondence to:W. Thiery (wim.thiery@ees.kuleuven.be)
Received: 27 February 2012 – Published in The Cryosphere Discuss.: 17 April 2012 Revised: 9 July 2012 – Accepted: 15 July 2012 – Published: 9 August 2012
Abstract.In the near-coastal regions of Antarctica, a signifi-cant fraction of the snow precipitating onto the surface is re-moved again through sublimation – either directly from the surface or from drifting snow particles. Meteorological ob-servations from an Automatic Weather Station (AWS) near the Belgian research station Princess Elisabeth in Dronning Maud Land, East-Antarctica, are used to study surface and snowdrift sublimation and to assess their impacts on both the surface mass balance and the surface energy balance during 2009 and 2010. Comparison to three other AWSs in Dron-ning Maud Land with 11 to 13 yr of observations shows that sublimation has a significant influence on the surface mass balance at katabatic locations by removing 10–23 % of their total precipitation, but at the same time reveals anomalously low surface and snowdrift sublimation rates at Princess Elis-abeth (17 mm w.e. yr−1compared to 42 mm w.e. yr−1at Svea Cross and 52 mm w.e. yr−1at Wasa/Aboa). This anomaly is attributed to local topography, which shields the station from strong katabatic influence, and, therefore, on the one hand al-lows for a strong surface inversion to persist throughout most of the year and on the other hand causes a lower probabil-ity of occurrence of intermediately strong winds. This wind speed class turns out to contribute most to the total snowdrift sublimation mass flux, given its ability to lift a high number of particles while still allowing for considerable undersatura-tion.
1 Introduction
The surface mass balance (SMB) includes the input and/or removal of mass at the surface and hence constitutes an es-sential part of the total mass balance of glaciers and ice sheets. Consequently, its study is crucial for understanding the current and future evolution of the Antarctic ice sheet and associated sea-level changes. On a snow- or ice-covered surface, the SMB is given by
SMB=PR+RU+ERds+SUs+SUds (1)
with the different terms of the SMB being total (solid and liquid) precipitation (PR), liquid water runoff (RU), erosion (deposition) due to divergence (convergence) of horizontal snowdrift transport (ERds), surface sublimation (deposition) (SUs) and sublimation of drifting snow particles within a column extending from the surface to the top of the drift-ing snow layer (SUds) (Van den Broeke et al., 2004a). Note that in this definition, each term is defined negative when it removes mass from the surface.
As surface sublimation depends on near-surface tempera-ture, the process is marked by a strong seasonality (Takahashi et al., 1994; Bintanja and Van den Broeke, 1995; Reijmer and Oerlemans, 2002; Frezzotti et al., 2004). In addition, the process is characterised by a strong spatial variability: in the extremely cold interior of the Antarctic ice sheet, SUsis vir-tually absent (D´ery and Yau, 2002), whereas blue ice areas are associated with high sublimation rates (e.g. at Seal rock in the Sør Rondane mountains, Takahashi et al. (1992) recorded SUs rates from −200 to−280 mm w.e. yr−1over a blue ice
Whenever the friction velocity (u∗) becomes sufficiently
high for the drag force to overcome inter-particle bonding forces and gravity, snow particles are lifted from the surface to form “drifting snow” (Bintanja, 1998). Snowdrift is a very common phenomenon in Antarctica: over certain parts of the ice sheet, snowdrift events have been observed on approx-imately one out of four days (Mann, 1998), and in the ex-tremely windy Cape Denison, Terre Ad´elie (Wendler et al., 1997), snowdrift is even observed most of the year (Budd et al., 1966; Schwerdtfeger, 1984). During snowdrift events, continuous sublimation of the floating snow particles takes place, as the ambient air is usually undersaturated with re-spect to ice (Schmidt, 1982). Continuous ventilation of the floating particle thereby significantly enhances the transfer of moisture from the particle to the surrounding air (Bintanja, 1998). In addition, water vapour exchange takes place on all sides of each particle. Thus, snowdrift sublimation (SUds) – whenever it occurs – is more effective in ablating mass per unit of time than SUs(Van den Broeke et al., 2004a; Bintanja, 1998). From a model study, D´ery and Yau (2002) concluded that, on the scale of the Antarctic ice sheet, SUds removed 15.32 mm w.e. yr−1on average from 1979 to 1993. Although this average appears small compared to continental scale val-ues for the net SMB (149–171 mm w.e. yr−1; Vaughan et al., 1999; Van Lipzig et al., 2002b; Van de Berg et al., 2006), it masks a tremendous spatial variation, with virtually non-existent SUdsin the interior of Antarctica to one of the major contributions near the relatively warm and windy coast (Bin-tanja, 1998; D´ery and Yau, 2002).
In addition to the decrease in upward turbulent momen-tum flux, SUds constitutes a source of water vapour and a sink of sensible heat in the air (D´ery and Taylor, 1996; Bin-tanja, 2001b). In fact, sublimation of floating snow particles tends to saturate the entire surface layer, starting in the lowest levels and therewith inhibiting further sublimation (Bintanja, 2001a). From the large number of numerical models for snowdrift sublimation and transport that have been developed over the last two decades (Pomeroy et al., 1993; Mobbs and Dover, 1993; Uematsu, 1993; D´ery and Yau, 1999; Gall´ee, 1998; Liston and Sturm, 1998; Mann, 1998; Essery et al., 1999; Bintanja, 2000c; Liston and Elder, 2006; Lenaerts et al., 2010), several succeed in reproducing this self-limiting nature of snowdrift sublimation (Xiao et al., 2000).
In contrast, observing the different components of the SMB in Antarctica poses huge challenges. While precipi-tation measurements are disturbed by snowdrift, and SMB monitoring, using for instance stakes, requires reliable snow density measurements, it is nearly impossible to measure SUs, SUds and ERds directly. The Automatic Weather Sta-tion (AWS) program in Dronning Maud Land coordinated by the Institute for Marine and Atmospheric Research of Utrecht University (IMAU), aims to tackle these problems by collecting high-quality meteorological observations which allow the calculation of the SMB components. In Febru-ary 2009, this program was extended by installing AWS 16
near the Belgian Antarctic station Princess Elisabeth (http: //ees.kuleuven.be/hydrant). Data collected at this new station are valuable, not only because they fill a vast observational gap spanning over 1070 km between the coastal stations No-volazarevskaya (70◦
46′
S; 11◦
50′
E) and Syowa (69◦
00′
S; 39◦
35′
E), but even more as the station is located in a specific microtopographical setting, i.e. close to a mountain range.
The two main goals of this study are (i) to compare subli-mation rates calculated from AWS 16 to other, existing time series in Dronning Maud Land and (ii) to understand the ob-served differences from a physical perspective. In order to achieve this, first surface sublimation and snowdrift subli-mation were calculated for four AWSs, followed by an as-sessment of their relative contribution to the SMB. Next, the magnitude of the latent heat flux (LHF) in relation to other surface energy balance (SEB) components is inves-tigated through application of a SEB model developed for snow-covered terrain (Van den Broeke et al., 2005). Finally, a sensitivity analysis was conducted to find the meteorolog-ical variables controlling SUsand SUds. Combined with the study of the near-surface meteorology, these findings allow to attribute the sublimation anomaly at Princess Elisabeth.
2 Data and methods
2.1 AWS data
AWS 16 was deployed in the valley down Gunnestadbreen glacier, 300 m east of Utsteinen ridge (71◦57′S; 23◦21′E)
at the foot of the Sør Rondane mountains in the escarpment zone (Fig. 1). The Utsteinen ridge – oriented in a north-south direction and with an altitude of 1420 m a.s.l. – is 700 m long, a few meters wide and protrudes around 20 m above the sur-rounding snow surface (Gorodetskaya et al., 2010; Pattyn et al., 2009). Since February 2009, Utsteinen ridge hosts the Belgian scientific base Princess Elisabeth (Fig. 1b). The area is influenced both by cyclones that bring in heat and mois-ture from the warmer regions surrounding Antarctica and katabatic winds advecting cold air from the interior of the Antarctic Ice Sheet (Gorodetskaya et al., 2012).
AWS 5 is situated near the Antarctic stations Wasa and Aboa, on the coastal slopes of the ice sheet, just inland of the grounding line. AWS 6 at Svea Cross stands at the foot of the Heimefront Mountains and is strongly influenced by kata-batic winds. Finally, AWS 9 is located a few kilometres east of the German Antarctic station Kohnen, on Amundsenisen on the East Antarctic plateau (Van den Broeke et al., 2004a). AWS characteristics are listed in Table 1.
Table 1.AWS characteristics.∗: values from Van den Broeke et al. (2004a) for 1998–2001. The snow density at AWS 16 was retrieved from the first 85 cm of an ice core drilled in February 2009 near the station. Start and end of observation mark the first respectively last entry used in this study; all stations except AWS 6 are still operational. Also, note that AWS 16 has no lower bound for the mass balance since no mast extension has been conducted yet.
AWS 16 AWS 5 AWS 6 AWS 9
Location
Nearby station Princess Elisabeth Wasa/Aboa Svea Cross Kohnen
Latitude 71◦57′S 73◦06′19′′S 74◦28′53′′S 75◦00′41′′S Longitude 23◦21′E 13◦09′53′′W 11◦31′06′′W 00◦00′44′′E
Altitude (m a.s.l.) 1420 363 1160 2892
Setup of this study
Start of observation 3 Feb 2009 3 Feb 1998 3 Feb 1998 3 Feb 1998
Start of hourly observation 12 Jan 2010 2 Feb 2003 9 Jan 2004 13 Jan 2001
End of observation 2 Feb 2011 2 Feb 2011 2 Feb 2009 2 Feb 2011
Snow density (kg m3) 336 383∗ 396∗ 307∗
Mass balance cap (mm w.e.) / −150 −100 −200
Meteorological means, observation period
T (K) 254 257 253 231
RHi (%) 56 80 75 89
u(m s−1) 5.0 6.7 6.8 4.4
between the surface and theT and RH measurement level (H) is monitored by a sonic height ranger. Sensor specifi-cations are shown in Table 2. Where possible, the analysis is conducted on hourly resolution; else, 2-hourly values are used as model input (Table 1). Finally, observed RH values are converted to relative humidity with respect to ice (RHi) similar to Anderson (1994).
While 13-yr time series are used for AWS 5 and 9, and 11 yr for AWS 6, currently only 2 yr of measurements are available for AWS 16, from 3 February 2009 until 2 Febru-ary 2011. Observation periods are listed in Table 1 and, un-less stated otherwise, results are presented for the respective periods of data availability. Obviously, a 2-yr time series is insufficient to determine a reliable climatology or seasonal cycle of the station’s mass and energy fluxes. Moreover, data gaps in December 2009 and November 2010 might cause a bias towards winter values; especially for the summer phe-nomenon surface sublimation this might be an issue. How-ever, although analysis of longer time series might be useful to reduce the uncertainties of estimates presented below, re-sults indicate features which cannot be ascribed to data or model uncertainty.
2.2 Sublimation and SMB
The in-situ measurements are used to dissect the net accu-mulation signal at each station into its components following the method described by Van den Broeke et al. (2004a). The core of this SMB model builds on the findings from Monin-Obukhov similarity theory to calculate surface sublimation,
while snowdrift sublimation is retrieved through averaging three different parameterisations for snowdrift sublimation. Details of the method are given below.
Surface sublimation SUs (kg m−2 s−1)can be obtained from the surface latent heat flux LHF (W m−2) using the re-lationship SUs= LHF/Lsub, where Lsub= 2.84×10⁶J kg−1is
the constant latent heat release associated with the sublima-tion process (assumed constant). The surface latent heat flux LHF can be expressed as
LHF=ρairLsubu∗q∗ (2)
whereu∗(m s−1) andq∗(kg kg−1)the turbulent scaling
pa-rameters of momentum and moisture andρair (kg m−3) the density of the near-surface air (the latter retrieved using the ideal gas law). Together with the turbulent scaling parame-ter of heatθ∗(K),u∗andq∗can be determined based on the
“bulk” method (Denby and Greuell, 2000), i.e. through the flux-profile relationships:
u∗∼=
κu (zV)−u z0,V
ln zV
z0,V
−9m
zV
LMO
(3)
θ∗∼=
κ
θ (zT)−θ z0,T lnzT
z0,T
−9h
zT
LMO
(4)
q∗∼=
κ
q zq−q z0,q lnzzq
0,q
−9h
z
q
LMO
Table 2.AWS sensor specifications (EADT: estimated accuracy of daily totals) (http://ees.kuleuven.be/hydrant/). All four AWSs used in this study are similar in design.
Sensor Type Range Accuracy
Air pressure Vaisala PTB101B 600–1060 hPa 4 hPa Air temperature Vaisala HMP35AC −80 to+56◦C 0.3◦C Relative humidity Vaisala HMP35AC 0–100 % 2–3 %
Wind speed Young 05103 0–60 m s−1 0.3 m s−1
Wind direction Young 05103 0–360◦ 3◦C
Pyranometer Kipp and Zonen CNR1 305–2800 nm 10 % EADT Pyrradiometer Kipp and Zonen CNR1 5000–50 000 nm 10 % EADT Sonic height ranger Campbell SR50 0.5–10 m 0.01 m or 0.4 %
Fig. 1. (a)Map with focus on Dronning Maud Land, indicating the location of the 4 automatic weather stations (AWSs) under con-sideration. 500 m height contours are depicted in blue (http://www. eos.ubc.ca/∼rich/map.html).(b)Surface (Bamber et al., 2009) and bedrock (Lythe and Vaughan, 2001) topographic transect along the 23◦E meridian (adapted from Pattyn et al., 2009). The outcropping bedrock at∼72.1◦S form the Sør Rondane mountains. Inset: snow-drift event at Princess Elisabeth, where AWS 16 is located.
withκ=0.4 the von K´arm´an constant, u(zV) (m s−1) the wind speed measured by the AWS at a heightzV above the surface andu(z0,V)the velocity at the surface. Mutatis mu-tandis, Eqs. (4) and (5) require values for the potential tem-peratureθ(K) and the specific humidityq(kg kg−1), each at a levelzT (zq) above the surface and at the height of the tem-perature (moisture) roughness lengthsz0,T (z0,q). 9m and
9hare the momentum and heat/moisture stability functions, respectively. RHi andT are measured at the same level, so
zT =zq=H. Wind speed is measured about 0.75 m higher (zV =H+0.75 m). In our SMB calculations we adopted a value of 0.1 mm for the momentum surface roughness length
z0,V(Bintanja, 2000d). Following the method developed by Andreas (1987),z0,Vis related toz0,T andz0,q through two empirical expressions depending on the roughness Reynolds numberRe∗=u∗z0,V/νair, withνair the kinematic viscosity of air (m2s−1). By definition,u(z
0,V)=0. Furthermore,Ts can be obtained from the Stephan-Boltzmann law:T (z0,T)=
Ts=(LWout/εσ )1/4, with σ=5.67×10⁻⁸W m−2K−4 the Stephan-Boltzmann constant and the longwave emissivity
ε=1. Subsequently,θscan be derived. The value forq(z0,q) is calculated from the saturation vapour pressure with respect to icees,iat the surface (Curry and Webster, 1999), assuming the snow surface to be saturated with respect to ice. Note that, therewith, the near-surface RHi-gradient is assumed negative or zero at all times. Finally, the momentum and heat/moisture stability functions 9m and9h are calculated using the ex-pressions proposed by Holtslag and de Bruin (1988) for sta-ble and very stasta-ble conditions, while equations put forward by Dyer (1974) are applied for the unstable regime. The ra-tioz/LMO is used to discern between the three regimes: if
z/LMO>0.5 conditions are very stable, 0.5> z/zLMO>0 stands for stable conditions andz/LMO<0 represents unsta-ble conditions. In each case,LMO(m) stands for the Obukhov length scale, which can be calculated following (Van den Broeke et al., 2004a):
LMO=
u2∗ κgθ(θ∗+0.62θ q∗)
. (6)
Thus the problem is implicit, and requires iterative solving. Convergence (<0.001 % difference) is usually reached after 10–15 iterations.
In that case, SUsis assumed to vanish and column-integrated snowdrift sublimation SUds is estimated as the average of three parameterisations: Bintanja and Reijmer (2001), D´ery and Yau (2001) and Bintanja (1998) (hereafter referred to as BR01, DY01 and B98, respectively).
The expressions put forward by BR01 account for the in-crease inz0,V,z0,T andz0,q due to enhanced momentum dis-sipation, lower temperature and increased saturation levels, respectively, during snowdrift (Schmidt, 1986; Wamser and Lykossov, 1995; Mann et al., 2000; Bintanja, 2000b). BR01 suggest three empirical expressions depending onu∗to
ac-count for the respective roughness length dependency upon wind speed, subsequently yielding SUdsin a way similar as described above. As the parameterisation is found to be no longer valid at wind speeds with corresponding friction ve-locities above 1 m s−1, a cap of 0.1 m on the momentum, heat and moisture roughness lengths was introduced.
On the basis of multiple integrations with the numerical blowing snow model PIEKTUK-D, DY01 derived another explicit parameterisation for snowdrift sublimation requiring the input of u at 10 m above the surface, and T and RHi at 2 m. For the latter two, observed values were used with-out applying any correction, whereas the 10 m wind speed was retrieved from the flux profile relationships neglecting stability effects and adopting z0,V=1 mm. The latter fol-lows DY01 and mirrors the roughness length increase dur-ing snowdrift. Note also that this value reasonably agrees with the mean increased roughness lengths parameterised by BR01 for each station (0.64 mm, 0.87 mm, 1.2 mm and 1.8 mm at AWS 9, 16, 6 and 5, respectively).
Finally, B98 derived an expression for vertically integrated snowdrift sublimation from a set of simulations with the nu-merical blowing snow model SNOWSTORM forced with 3 muandT. Since the B98 parameterisation was developed for application to AWS data for which no humidity measure-ments were available, RHi was assumed constant and set to 70 %. However, judging from the RHi values observed at AWS 5, 6, 9 and 16, this would lead to an overestimation of column snowdrift sublimation. Therefore, a linear rescaling of the form
SUds=SUds
1−RHi
1−0.7
(7) was applied in order to account for the variations in humidity. The surface mass balance can be obtained by multiply-ing snow height changes with the snow densityρ (Table 1). Given the density fluctuations observed in the upper snow layers at AWS 16, the uncertainty in the instantaneous sur-face mass balance is estimated to amount up to∼15 %.
Fi-nally, the “residual term” containing PR and ERdscan be ob-tained from Eq. (1). Note that first, the raw snow height data had to be corrected for false reflections and mast extensions, the former using a histogram approach, the latter by impos-ing an upper limit to the accumulation (Table 1).
2.3 SEB model
Considering a skin layer, the surface energy balance (SEB) of a snow covered surface can be written as (Van den Broeke et al., 2005)
M=SWin+SWout+LWin+LWout+SHF+LHF+G
=Rn+SHF+LHF+G (8)
withMthe amount of melt energy, SWinand SWoutthe in-coming and outgoing shortwave radiative fluxes, LWin and LWoutthe incoming and outgoing longwave radiative fluxes,
Rnthe net radiation, SHF and LHF the sensible respectively latent heat flux and finallyGthe subsurface conductive heat flux. All terms are in W m−2and defined positive when di-rected towards the surface.
With the goal of calculating the different components of the SEB, we use the SEB model described in detail by Van den Broeke et al. (2005) (for applications see Kuipers Munneke et al., 2009; van As et al., 2005; Giesen et al., 2008 and Van den Broeke et al., 2011). Here, we only provide a very short description of the model’s main steps and assump-tions. Essentially, AWS measurements (SWin, SWout, LWin,
T, RH,u,pandH) serve as input to the model that iterates for a surface temperatureTs for which closure of all energy terms is achieved. An important advantage of this approach is that the observedTscan be used to evaluate the model. Tur-bulent fluxes are determined analogous to the SMB model, whereas the subsurface conductive heat flux Gis obtained by extrapolating upwards the one-dimensional heat-transfer equation at 2 and 6 cm depth. Melting energy is determined from the excess energy whenever modelled Ts reaches the melting point. The initial Ts was chosen to minimise spin-up effects (see also Van Lipzig et al., 2002a). The module calculating the subsurface SW radiation penetration (Brandt and Warren, 1993) is not used in our simulations, since it has been shown that its impact uponTs both in Greenland and Antarctica is virtually inexistent (Kuipers Munneke et al., 2009; Brandt and Warren, 1993).
3 Results
3.1 Model testing and evaluation
Fig. 2.Observed versus modelled surface temperatureTs(2 hour averages), varying time periods, at(a)AWS 16 – Princess Elisabeth,(b) AWS 5 – Wasa/Aboa,(c)AWS 6 – Svea Cross, and(d)AWS 9 – Kohnen. Note the different axes’ ranges.µ1T presents the mean surface temperature difference and RMSE1T the root mean squared error of the surface temperature difference.
that the suspended particle accrete mass as long as the am-bient air is not supersaturated. Moreover, DY01 and B98 do predict snowdrift sublimation rather than deposition during these events, as they do not depend upon theq-gradient but on a single-level RHi-value. While at AWS 5, 6 and 9 this sit-uation is very rare, the micro-topography at Utsteinen ridge strongly favours the build-up of a q-inversion (Sect. 3.4.), forcing us to reject BR01 at AWS 16.
The SMB calculations are tested by applying the method to the first four years of available data for AWS 5, 6 and 9. Comparison with Van den Broeke et al. (2004a) shows that the model is successful in reproducing the SMB signal and the different components SUs and SUds, as differences are small and non-systematic. Hence it is appropriate to apply the SMB routine.
With the actual Ts directly derived from the observed LWout, the comparison of the modelled and observed Ts presents a powerful tool to evaluate the SEB model (Fig. 2). The overestimation ofTs, which can be noted for very low
Ts, was found to coincide with clear sky conditions, sug-gesting that during these periods either the model performs less well, or the LWinmeasurements are biased to lower val-ues (Kuipers Munneke et al., 2009). However, in general, the good agreement between modelled and observedTsindicates
that the model is doing well, with a mean difference ranging from 0.16◦
C (AWS 16) to 1.13◦
C (AWS 5) and a RMSE from 0.76◦
C (AWS 6) to 1.72◦
C (AWS 16).
3.2 Surface and snowdrift sublimation
Table 3 depicts the SMB characteristics for the respective measurement periods. During the 2-yr measurement period, SUs removed 14 mm w.e. at AWS 16. The signal shows a marked seasonality (Fig. 3a), with most of the sublima-tion taking place during summer. It also shows a continu-ous snow deposition during the winter of 2009. Surprisingly, SUs rates at AWS 5 and 6 (−17 and−20 mm w.e. yr−1,
re-spectively) are two to three times larger than at AWS 16. In Sect. 3.4, we investigate reasons for this large difference. SUs attains it highest values in the katabatic wind zone, since with only −3 mm w.e. yr−1, SUs is nearly absent at
AWS 9 (Table 3). Using stake measurements at sites with reduced wind influence in Terre Ad´elie, Frezotti et al. (2004) have reported similar SUs gradients, with rates increasing from −3 to −8 mm w.e. yr−1 on the Antarctic Plateau to
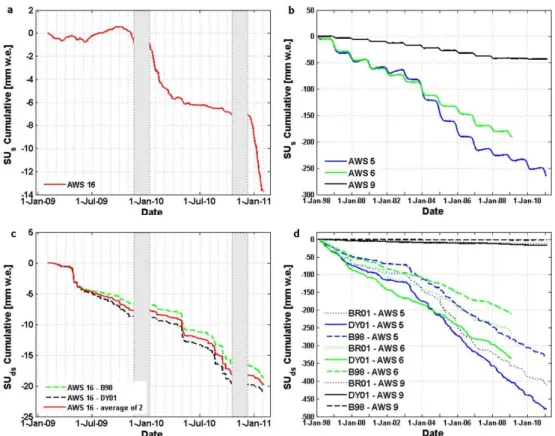
Fig. 3.Cumulative sublimation mass fluxes (mm w.e.): Surface sublimation SUsat(a)AWS 16 and(b)AWS 5, 6 and 9; Snowdrift sublima-tion SUdsat(c)AWS 16 and(d)AWS 5, 6 and 9.
At AWS 16, a marked difference between the first and second measurement year (hereafter referred to as 2009 and 2010, respectively) can be observed: in 2010, SUsremoved 11 mm w.e., compared to only 3 mm w.e. in 2009. The second period coincides with lower saturation levels (61 % in 2009 compared to 52 % in 2010), so one could state that the drier air opens a larger potential to sublimation during 2010. How-ever, although the Spearman rank correlation (ρ= −0.24) is significant at the 1 % level, RHionly explains 6 % of the total variance in SUs. Moreover, since surface deposition occurs at all values of RHi, this variable does not even allow for discrimination between sublimation and deposition. Instead, both the sign and magnitude of SUs predominantly depend upon the near-surface specific humidity gradient, represented byq∗(Eq. 5), as demonstrated by a Spearman rank
correla-tion of 0.88, significant at the 1 % level. For a near-surface
q, decreasing with altitude surface sublimation takes place, while for aq–inversion surface deposition is to be expected. In Dronning Maud Land,q-inversions are formed when in-trusions of warm, moist air encounter the cold Antarctic snow surface (Van den Broeke et al., 2004a).
The annual SUds rate at AWS 16 is similar to SUs (Ta-ble 3), and removed 20 mm w.e. snow during the entire mea-surement period. Given the important uncertainties related to SUds predictions, annual rates predicted by B98 and DY01 agree surprisingly well (Fig. 3c). A clear mark of
season-ality is absent: we rather observe that an important frac-tion of the total SUds mass flux is removed during circa 5 major events, coinciding with a decaying or developing cy-clone (Gorodetskaya et al., 2012). Also here, SUds is two to three times larger at AWS 5 and 6 and virtually inex-istent at AWS 9. Even though, at AWS 9, snowdrift oc-curs about as often as at the other stations, air tempera-tures there are too low to generate sublimation from the sus-pended particles. The decrease in SUdsmass flux from coast to plateau has been reported in previous studies, notably by Bintanja (1998), who calculated rates to decrease from
−170 mm w.e. yr−1at Dumont d’Urville, Terre Ad´elie, down to−8 mm w.e. yr−1on the plateau, and further by D´ery and Yau (2002) and by Lenaerts and Van den Broeke (2012), who both predict significant SUdsmass fluxes near the grounding line in Dronning Maud Land (−60 to−80 mm w.e. yr−1and −40 to−70 mm w.e. yr−1, respectively), but no contribution
(<1 mm w.e. yr−1)on the plateau.
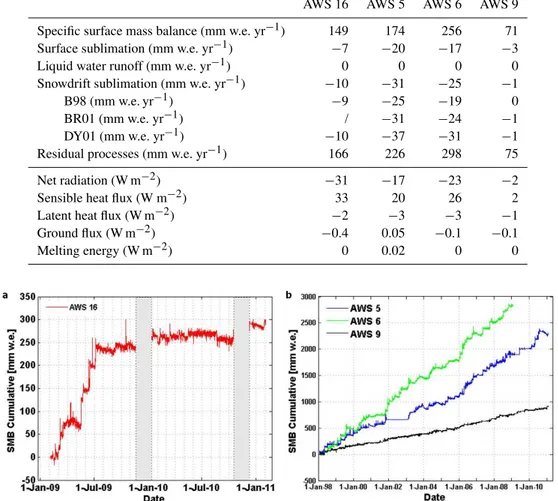
Table 3.Comparison of specific surface mass balance and its components (mm w.e. yr−1), and mean surface energy balance components (W m−2) at each station. The values at each station are valid for the respective measurement period at this station (2, 13, 11 and 13 yr at AWS 16, 5, 6 and 9, respectively). As explained in the text, BR01 was not applied to AWS 16.
AWS 16 AWS 5 AWS 6 AWS 9
Specific surface mass balance (mm w.e. yr−1) 149 174 256 71 Surface sublimation (mm w.e. yr−1) −7 −20 −17 −3
Liquid water runoff (mm w.e. yr−1) 0 0 0 0
Snowdrift sublimation (mm w.e. yr−1) −10 −31 −25 −1
B98 (mm w.e. yr−1) −9 −25 −19 0
BR01 (mm w.e. yr−1) / −31 −24 −1
DY01 (mm w.e. yr−1) −10 −37 −31 −1
Residual processes (mm w.e. yr−1) 166 226 298 75
Net radiation (W m−2) −31 −17 −23 −2
Sensible heat flux (W m−2) 33 20 26 2
Latent heat flux (W m−2) −2 −3 −3 −1
Ground flux (W m−2) −0.4 0.05 −0.1 −0.1
Melting energy (W m−2) 0 0.02 0 0
Fig. 4.Cumulative surface mass balance SMB (mm w.e.) for the respective measurement periods at(a)AWS 16 and(b)AWS 5, 6 and 9. Note that at AWS 16, accumulation during the December 2009 and November 2010 data gaps is captured by a jump in the snow height observations.
zero sublimation mass flux during data gaps can be inves-tigated by estimating the mass loss due to sublimation dur-ing both data gaps at AWS 16. This is done by interpolatdur-ing the mean SUs and SUds rates in the month before and after each data gap, and indicates that SUs at AWS 16 might be
∼3 mm w.e. yr−1 stronger, while SUds would increase with
∼2 mm w.e. yr−1 (Table 4). This effect is significant, but clearly not high enough to close the gap with the other kata-batic stations.
3.3 Contribution to SMB
The surface mass balance at AWS 16 shows a net accumu-lation of 299 mm w.e. for the 2-yr measurement period cor-responding to 149 mm w.e. yr−1(Fig. 4a, Table 3). Note that even though this value lies within the net SMB range of 149– 171 mm w.e. yr−1computed for various time periods and
av-eraged over the entire Antarctic ice sheet (Vaughan et al., 1999; Van Lipzig et al., 2002b; Van de Berg et al., 2006), it is lower than one would expect given its location relatively close to the coast. Of this increase of the snow height by about 0.89 m, more than 80 % (0.75 m) was already achieved after the first year.
Fig. 5.Daily mean(a)net radiationRnand its components (W m−2), and(b)surface energy balance components (W m−2), 2009–2010, at AWS 16. Abbreviations stand for incoming (outgoing) shortwave (longwave) radiation (SWin, SWout, LWin, LWout, respectively), sensible heat flux SHF, latent heat flux LHF, subsurface conductive heat fluxGand melting energyM.
Table 4. Specific surface mass balance and its components (all units mm w.e. yr−1)at AWS 16, 5 and 9 for 2009–2010, with inclu-sion of SUsand SUdsestimates during the two data gaps at AWS 16. These estimates are computed by linearly interpolating mean subli-mation rates in the month before and after each gap.
AWS 16 AWS 5 AWS 9
Surface mass balance 149 177 81
Surface sublimation −10 −17 −1
Liquid water runoff 0 0 0
Snowdrift sublimation −12 −30 −1
Residual processes 171 225 83
ERds. Application of the parameterisation for snowdrift transport by Mann et al. (2000, see also Van Lipzig et al., 2004) to AWS 16 yields an estimate of 192 mm w.e. snow transported over the station during the measurement period (96 mm w.e. yr−1). This total transport term provides an up-per bound for ERds, being the snow transport divergence, and which cannot be derived from single-point observations. There are good reasons to assume that the cumulative ERdsis much lower than the total snow transport: (i) suspended par-ticles transported over the station contribute to the total snow transport but not to the SMB, and such particles are known to be transported over large distances in Antarctica (D´ery et al., 1998); (ii) most probably, both erosion and deposition occur at the station during the course of time, therewith partially cancelling each other out; and (iii) modelling studies for Antarctica by D´ery and Yau (2002), using re-analysis data,
and Lenaerts and Van den Broeke (2012), using a coupled regional climate model, found much lower values for the cu-mulative ERdsmass flux (0.05 mm w.e. yr−1for the latitudi-nal band 70◦–80◦S and∼10 mm w.e. yr−1for the lee side of the Sør Rondane mountains, respectively). Hence, although we cannot completely rule out the contribution of ERdsto the residual term, hereafter it is considered negligible.
Fig. 6.Monthly mean surface energy balance components (W m−2)at AWS 5, 6, 9 and 16, respective measurement periods:(a)net radiation Rn,(b)sensible heat flux SHF,(c)latent heat flux LHF,(d)subsurface conductive heat fluxG. Not shown is melting energyM, as this energy flux is absent at AWS 6, 9 and 16 and negligible at AWS 5.
Considering the entire measurement period, SUsand SUds together removed 10 % of all PR at AWS 16. The fractional removal increased from 4 % in 2009 to 31 % in 2010, indi-cating enhanced (summer) sublimation but especially limited accumulation during the second year at this location. This difference at AWS 16 is not found for the other stations. At AWS 5, 6 and 9, sublimation removed up to 23 %, 14 % and 6 %, respectively, of total precipitation during the respective measurement periods.
3.4 Contribution to SEB
Both SWinand SWoutshow a clear seasonal cycle (Fig. 5a). From around mid-May until mid-August, the sun does not rise anymore above Princess Elisabeth and both SW compo-nents drop to zero. Atmospheric scattering and cloud amount determine the final fraction reaching the surface, hence the small-scale variations in SWin. The high correlation be-tween SWin and SWout (Spearman correlation coefficient
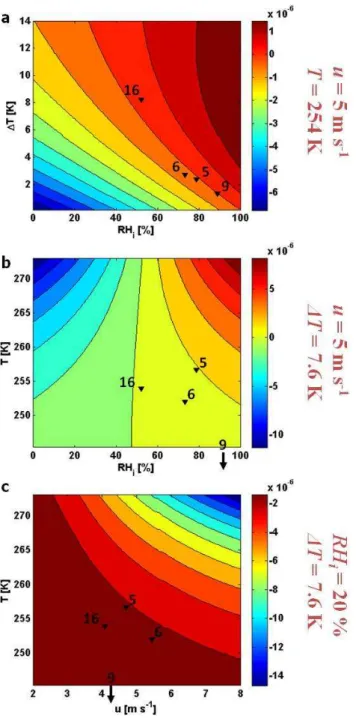
Fig. 7.SUsrates (kg m−2s−1)from 3 sensitivity experiments, with (a)wind speed u=5 m s−1 and air temperature T =254 K, (b) u=5 m s−1and surface temperature inversion1T=7.6 K, and(c) relative humidity with respect to ice RHi=20 % and1T=7.6 K. Mean values for RHi,uand1Tswere calculated for AWS 5, 6, 9 and 16 for snowdrift-free conditions and used to plot each station.
and relatively constant albedoαof the snow surface (0.8< α <0.95). As for the LW radiation components, a seasonal cycle is much less pronounced, and small scale fluctuations are stronger for LWincompared to LWout(Fig. 5a) given the stronger variations in the atmospheric emissivity caused by cloud cover variability. Overall, AWS 16 is characterised by
a radiation deficit during nearly the entire measurement pe-riod, except for the high summer.
At high latitudes and especially during winter, this radia-tive cooling of the surface may last the entire day and tends to render the near-surface air warmer than the underlying sur-face. As a response, the SHF transfers heat from near-surface air towards the surface (Fig. 5b) (Van Lipzig, 2007). It has been noted that this process causes increasing densities in near-surface air, and therewith leads to the formation of the katabatic wind system in the presence of a surface slope (Rei-jmer and Oerlemans, 2002). The LHF, representing the total amount of energy available for sublimation, is clearly less important in the SEB, except for high summer, when a clearly negative LHF consumes theRnexcess. The impact ofGon the energy budget is rather small, whileMis even completely absent at the station during the measurement period, consis-tent with observedTs(Figs. 2a and 5b).
In Fig. 6a–d, monthly mean values of the different SEB components are depicted for the four AWSs. Compared to AWS 16, radiative losses are much smaller at AWS 9 but similar at AWS 5 and 6, with a maximum loss during winter-time when SWinis absent and LWinequilibrates towards the cloud base temperature (Van den Broeke et al., 2004b). Con-sequently, annual average positive SHF are larger at AWS 5, 6 and 16 and the seasonal cycle largely mirrors seasonal vari-ations inRn(Table 3, Fig. 6b). Again, compared to this bal-ance, the LHF calculated by the SEB model are found to be much weaker except during high summer (Table 3, Fig. 6c).
3.5 Attributing the AWS 16 sublimation anomaly
To account for the remarkably low sublimation rates at AWS 16 compared to other katabatic AWSs 5 and 6, one first needs to identify the main controlling variables for SUs and SUds. This was achieved through a number of sensitivity experiments, in which the values forT, RHi,uand the mag-nitude of the near-surface temperature inversion (1T) were varied in pairs between bounds realistic for katabatic stations. For the parameters remaining constant during a given exper-iment, mean values at AWS 16 were used for snowdrift free or snowdrift conditions, respectively. As these four variables together constrain q and1q, and since the dependency of SUs upon1q is directly evident from Eqs. (2, 5), the latter variables need not to be tested. Figures 7 and 8 depict the most relevant of these experiments, together with the loca-tion of each staloca-tion based on the mean meteorological state during snowdrift free and snowdrift conditions, respectively. From Fig. 7a, it can be inferred that SUspredominantly de-pends upon1T: a strong inversion dampens thermal turbu-lence and therewith SUs. Also RHi is an important determi-nant. For instance, taking the AWS 16’s mean wind velocity and temperature inversion, it is found that for RHivalues be-low∼50 %, sublimation takes place, while deposition occurs
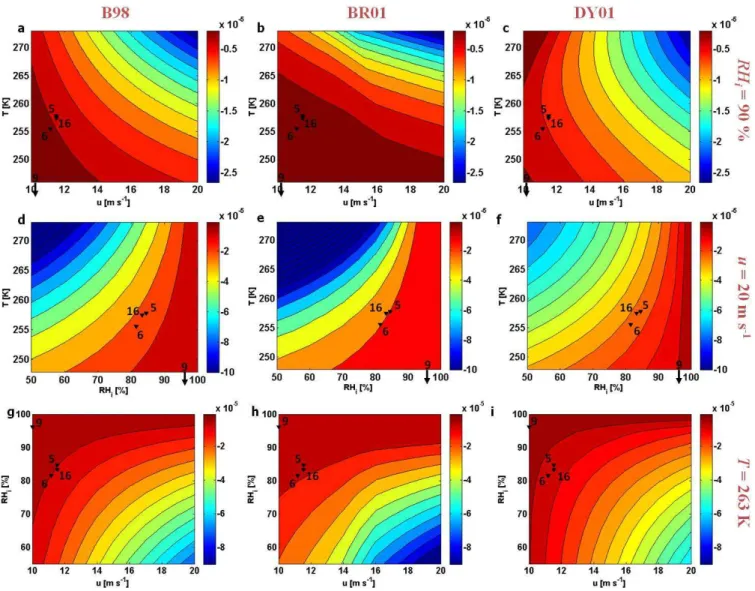
Fig. 8.SUdsrates (kg m−2s−1) from 3 sensitivity experiments, with(a–c)relative humidity with respect to ice RHi=90 %,(d–f)wind speedu=20 ms−1, and(g–i)air temperatureT=263 K, each one conducted for B98 (left panels), BR01 (central panels), and DY01 (right panels), respectively. Mean values for RHi,uandT were calculated for AWS 5, 6, 9 and 16 for snowdrift conditions and used to plot each station.
moisture content and inducing a more efficient mixing of the moisture input in the surface layer (Fig. 7c).
Positioning of the different AWSs relative to each other on the basis of average near-surface meteorological condi-tions during snowdrift-free condicondi-tions allows us to attribute the negative SUs anomaly at AWS 16 (Fig. 7). Indeed the average1T is much stronger at AWS 16 than at the other stations (8.2 K at AWS 16 versus 2.4 K, 2.7 K and 1.3K at AWS 5, 6 and 9, respectively). Consequently, as strong sur-face winds tend to destroy the near-sursur-faceT-inversion by enhancing vertical mixing (Ohata, 1985; Jonsson, 1995; Van den Broeke et al., 1999; Reijmer and Oerlemans, 2002), the low SUsat AWS 16 can be related to reduced katabatic influ-ence at this station.
As for snowdrift sublimation, an extensive sensitivity analysis reveals that SUds is predominantly limited by
RHi (Fig. 8d–i), in agreement with findings from King et al. (1996) and D´ery et al. (1998), but only when the am-bient moisture content is high. Below a RHi of about 70– 80 %,T andu take over as the main controlling variables for SUds (Fig. 8a–c). HigherT allow for largerq-gradients to build across the drifting snow layer, while the impact of wind speed peaks at values just above the threshold for snow transport, when enhanced saltation drift density (Pomeroy and Gray, 1990) and stronger ventilation (Bintanja, 1998) are most effective. Hence, suppressed seasonality in SUds (Fig. 3c–d) is probably due to higherubalancing for lower
T during winter. Although minor differences exist, all three parameterisations show consistent behaviour.
Fig. 9.Dominant wind directions measured at(a)AWS 16 – Princess Elisabeth,(b)AWS 5 – Wasa/Aboa,(c)AWS 6 – Svea Cross and(d) AWS 9 – Kohnen. The contribution of each wind speed class to a given wind direction is shown in the colour scale.
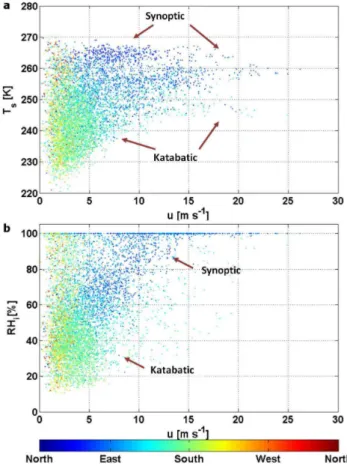
Fig. 10.Scatter plot of(a)surface temperatureTsand(b)relative humidity with respect to ice RHiversus wind speeduat AWS 16. The colour of the scatter points represents the wind direction.
three times lower compared to AWS 5 and 6. Further investigation of the near-surface meteorology, described be-low, can however explain this difference.
Due to the specific geographic location of the station, wind fields observed at AWS 16 show a marked behaviour. Predominantly two wind speed regimes reign at AWS 16 (Fig. 9a). Most often, a S-SSE katabatic wind is blowing at low speed (0–10 m s−1). Strong katabatics are absent at the station, as they are blocked by the surrounding Sør Ron-dane mountains (Fig. 1b). On the other hand, during
approx-imately 10–20 % of the observation period, a strong E syn-optic wind prevails at AWS 16. The highest wind speeds (20–30 m s−1)are all situated within this wind regime, and low wind speeds (<5 m s−1) blowing from this direction are very rare. Although a transition zone is present, gen-erally both wind regimes coincide with a distinction inT: while katabatics are usually associated with cold temper-atures (225–250 K), the synoptic winds advect warmer air masses (255–267 K) (Fig. 10a). At highu, the difference is more pronounced, as the data cloud forks into a synoptic (∼260 K) and a katabatic (247 K) peak. Clearly the katabatic
flow generally remains colder than the E maritime winds, even after adiabatic heating upon descend from the Antarc-tic Plateau (Fig. 1b). Finally, as the katabaAntarc-tic downflow also induces a drying of the near-surface air (10 %<RHi<60 %), the contrast in RHi with the nearly saturated maritime air masses (80%<RHi <100 %) is evident from the AWS 16 data (Fig. 10b).
Comparison to the wind regimes at AWS 5 and 6 al-lows to attribute the AWS 16 SUdsanomaly. At AWS 5, the katabatic winds (ENE) dominate, with occasional high wind speeds coming from the synoptic regime (NE; Fig. 9b). The wind regime at AWS 6 appears comparable to AWS 16, tak-ing into account that wind directions have backed by about 45◦
Fig. 11. (a)Histogram of 2-hourly mean wind velocityu, with the generalised extreme values (GEV) probability density function fit-ted to the data. Fromu >25 m s−1onwards, the three GEV curves overlay each other. Note that here the GEV distribution is preferred over the Weibull distribution, sinceR2is higher for the GEV fit (0.97< R2<0.99) than the Weibull fit (0.91< R2<0.95)at each location.(b)Total annual snowdrift sublimation SUdsfor each wind speed bin (width=1 m s−1).(c)Mean relative humidity with re-spect to ice RHi for each wind speed bin (width = 1 m s−1).
origin of these air masses and the precipitation which is regularly observed during such events (Gorodetskaya et al., 2012), associated RHi values will be close to saturation and will therefore inhibit significant sublimation rates (Figs. 8d– i, 10). Binning the measured RHi values on the basis ofu demonstrates that this saturation effect is present at each sta-tion (Fig. 11c).
On the contrary, moderate wind velocities (8 m s−1< u < 15 m s−1)are strong enough to lift particles but still allow for significant ambient undersaturation. This wind regime, generally created by medium strength katabatic winds which dry upon descend from the Plateau, provides the ideal con-ditions for strong SUdsrates at all stations (Fig. 11a–c). The anomalously low SUds rates at AWS 16 can now be under-stood: in essence, moderate wind velocities occur less often at AWS 16 compared to AWS 5 and 6, this due to orographic shielding of the former station (Fig. 11a). In fact, this shield-ing reduced the probability of snowdrift occurrence to 12 % during the measurement period at AWS 16, whereas snow-drift occurred during 29 %, respectively, 23 % of the time at AWS 5 and 6.
4 Conclusions
The goal of this study is to compare sublimation rates cal-culated from a newly installed automatic weather station (AWS) to existing time series in Dronning Maud Land and to explain the observed differences from a physical perspec-tive. Remarkable differences were found between AWS 16 and two other katabatic stations in Dronning Maud Land. From February 2009 until February 2011, annual surface (SUs) and snowdrift sublimation (SUds) rates at AWS 16 were found to amount up to−7 mm w.e. yr−1, respectively,
−10 mm w.e. yr−1. Both processes together have a signifi-cant influence on the surface mass balance at this station, by removing 10 % of the total precipitation (PR) during the measurement period (assuming ERds is negligible). How-ever, sublimation rates at AWS 16 are 2 to 3 times lower compared to AWS 5 and 6, where sublimation annually re-moves 22 %, respectively, 14 % of all PR (assuming ERdsis negligible).
controlling variables for SUds, with higher temperatures and stronger winds both allowing for enhanced SUdsrates. Sur-prisingly, application of these findings to the meanT, RHi anduconditions during snowdrift suggests comparable sub-limation rates at all three AWSs. Hence, further investigation of the near-surface meteorology at AWS 16 was undertaken. This showed that not the mean conditions during snowdrift, but rather the markedly lower probability of occurrence of moderate, katabatic winds (8 m s−1< u <15 m s−1) is re-sponsible for the lower SUdsrates at AWS 16. Precisely these wind speed classes are shown to contribute most to the total SUdsamounts, given their ability to lift particles while at the same time allowing for significant ambient undersaturation. To conclude, the sublimation anomaly at AWS 16 is the re-sult of the twofold effect of the local orography, which pro-tects the station from medium-strength katabatic winds and therewith (i) allows for a strong, dampening surface inver-sion to persist throughout most of the year, and (ii) reduces the occurrence of snowdrift by 50–70 % compared to nearby katabatic stations.
Acknowledgements. We would like to thank Stephen D´ery and Mathias Rotach for the helpful discussions on the modelling of sublimation. This work was possible thanks to financial and logistic support from the Research Foundation – Flanders (FWO), The Bel-gian Science Policy Office (BELSPO) and the International Polar Foundation (IPF). For the simulations we used the infrastructure of the VSC – Flemish Supercomputer Center, funded by the Hercules Foundation and the Flemish Government – department EWI.
Edited by: E. Hanna
References
Anderson, P. S.: A method for rescaling humidity sensors at tem-peratures well below freezing, J. Atmos. Ocean. Tech., 11, 1388– 1391, 1994.
Andreas, E. L.: A theory for the scalar roughness and the scalar transfer coefficients over snow and sea ice, Bound.-Lay. Meteo-rol., 38, 159–184, 1987.
Bamber, J. L., Gomez-Dans, J. L., and Griggs, J. A.: A new 1 km digital elevation model of the Antarctic derived from combined satellite radar and laser data – Part 1: Data and methods, The Cryosphere, 3, 101–111, doi:10.5194/tc-3-101-2009, 2009. Bintanja, R.: The contribution of snowdrift sublimation to the
sur-face mass balance of Antarctica, Ann. Glaciol., 27, 251–259, 1998.
Bintanja, R.: Mesoscale Meteorological Conditions in Dronning Maud Land, Antarctica, during Summer: A Qualitative Analy-sis of Forcing Mechanisms, J. Appl. Meteorol., 39, 2348–2370, 2000a.
Bintanja, R.: Snowdrift Sublimation in a Katabatic Wind Region of the Antarctic Ice Sheet, J. Appl. Meteorol., 40, 1955–1966, 2000b.
Bintanja, R.: Snowdrift suspension and atmospheric turbulence. Part I: Theoretical background and model description, Bound.-Lay. Meteorol., 95, 343–368, 2000c.
Bintanja, R.: Surface heat budget of Antarctic snow and blue ice: In-terpretation of spatial and temporal variability, J. Geophys. Res., 105, 387–411, doi:10.1029/2000JD900356, 2000d.
Bintanja, R.: Modelling snowdrift sublimation and its effect on the moisture budget of the atmospheric boundary layer, Tellus A, 53, 215–232, 2001a.
Bintanja, R.: Modification of the wind speed profile caused by snowdrift: results from observations, Q. J. Roy. Meteor. Soc., 127, 2417–2434, 2001b.
Bintanja, R. and Reijmer, C. H.: A simple parameterization for snowdrift sublimation over Antarctic snow surfaces, J. Geophys. Res., 106, 739–748, doi:10.1029/2000JD000107, 2001. Bintanja, R. and Van den Broeke, M. R.: The surface energy balance
of Antarctic snow and blue ice, J. Appl. Meteorol., 34, 902–926, 1995.
Braaten, D. A.: Direct measurements of episodic snow accumula-tion on the Antarctic polar plateau, J. Geophys. Res., 105, 119– 128, doi:10.1029/2000JD900099, 2000.
Brandt, R. E. and Warren, S. G.: Solar-heating rates and temperature profiles in Antarctic snow and ice, J. Glaciol., 39, 99–110, 1993. Bromwich, D. H., Guo, Z., Bai, L., and Chen, Q.: Modeled Antarc-tic Precipitation – Part I: Spatial and Temporal Variability, J. Clim., 17, 427–447, 2004.
Budd, W. F., Dingle, R. J., and Radok, U.: The Byrd Snow Drift Project: outline and basic results, in: Studies in Antarctic mete-orology, edited by: Rubin, M. J., American Geophysical Union, Washington D.C., 1966.
Curry, J. A. and Webster, P. J.: Thermodynamics of Atmospheres and oceans, Academic Press, London, UK, 1999.
Denby, B. and Greuell, W.: The use of bulk and profile methods for determining surface heat fluxes in the presence of glacier winds, J. Glaciol., 46, 445–452, 2000.
D´ery, S. J. and Taylor, P. A.: Some aspects of the interaction of blowing snow with the atmospheric boundary layer, Hydrol. Pro-cess., 10, 1345–1358, 1996.
D´ery, S. J. and Yau, M. K.: A bulk blowing snow model, Bound.-Lay. Meteorol., 93, 237–251, 1999.
D´ery, S. J. and Yau, M. K.: Simulation of blowing snow in the Cana-dian Arctic using a double-moment model, Bound.-Lay. Meteo-rol., 99, 297–316, 2001.
D´ery, S. J. and Yau, M. K.: Large-scale mass balance effects of blowing snow and surface sublimation, J. Geophys. Res., 107(D23), 4679-4696, doi:10.1029/2001JD001251, 2002. D´ery, S. J., Taylor, P. A., and Xiao, J.: The thermodynamic effects
of sublimating, blowing snow in the atmospheric boundary layer, Bound.-Lay. Meteorol., 89, 251–283, 1998.
Dyer, A. J.: A review of flux-profile relationships, Bound.-Lay. Me-teorol., 7, 363–372, 1974.
Essery, R., Li, L., and Pomeroy, J.: A distributed model of blow-ing snow over complex terrain, Hydrol. Process., 13, 2423–2438, 1999.
doi:10.1007/s00382-004-0462-5, 2004.
Gall´ee, H.: Simulation of blowing snow over the Antarctic ice sheet, Ann. Glaciol., 26, 203–206, 1998.
Gall´ee, H., Guyomarc’h, G., and Brun, E.: Impact of snowdrift on the Antarctic ice sheet surface mass balance: possible sensitiv-ity to snow-surface properties, Bound.-Lay. Meteorol., 99, 1–19, 2001.
Giesen, R. H., Van den Broeke, M. R., Oerlemans, J., and An-dreassen, L. M.: Surface energy balance in the ablation zone of Midtdalsbreen, a glacier in southern Norway: interannual vari-ability and the effect of clouds, J. Geophys. Res., 113, D21111, doi:10.1029/2008JD010390, 2008.
Gorodetskaya, I. V., Van Lipzig, N. P. M., Van den Broeke, M. R., Boot, W., Reijmer, C. H., Mangold, A., Kneifel, S. Crewell, S., and Schween, J.: Ground-based observations of cloud properties, precipitation and meteorological conditions at Princess Elisabeth station in Dronning Maud Land, Antarctica, BPRC Technical Re-port 2010-01. Byrd Polar Research Center at Ohio State Univer-sity, Columbus, Ohio, USA, 2010.
Gorodetskaya, I. V., Van Lipzig, N. P. M., Van den Broeke, M. R., Boot, W., and Reijmer, C. H.: Meteorological regimes and accumulation patterns at Utsteinen, Dronning Maud Land, East Antarctica: Analysis of two contrasting years, J. Geophys. Res., in review, 2012.
Holtslag, A. A. M. and De Bruin, H. A. R.: Applied modeling of the nighttime surface energy balance over land, J. Appl. Meteorol., 27, 689–704, 1988.
Jaeger, L.: Monaskarten des Niederschlags fur die ganze Erde, Re-port of the German Weather Service 139(18), Offenbach, Ger-many, 33 pp., 1976.
Jonsson, S.: Synoptic forcing of wind and temperature in a large cirque 300 km from the coast of East Antarctica, Antarct. Sci., 7, 409–420, 1995.
King, J. C.: Longwave atmospheric radiation over Antarctica, Antarct. Sci., 8, 105–109, 1996.
Kuipers Munneke, P., van den Broeke, M. R., Reijmer, C. H., Helsen, M. M., Boot, W., Schneebeli, M., and Steffen, K.: The role of radiation penetration in the energy budget of the snowpack at Summit, Greenland, The Cryosphere, 3, 155–165, doi:10.5194/tc-3-155-2009, 2009.
Lenaerts, J. T. M. and Van den Broeke, M. R.: Regional climate modeling of drifting snow in Antarctica – Part 2: Results, J. Geo-phys. Res., 117, D05109, doi:10.1029/2010JD015419, 2012. Lenaerts, J. T. M., Van den Broeke, M. R., D´ery, S. J.,
K¨onig-Langlo, G., Etema, J., and Munneke, P. K.: Modelling snowdrift sublimation on an Antarctic ice shelf, The Cryosphere, 4, 179– 190, doi:10.5194/tc-4-179-2010, 2010.
Li, L. and Pomeroy, J. W.: Estimates of threshold wind speeds for snow transport using meteorological data, J. Appl. Meteorol., 36, 205–213, 1997.
Liston, G. E. and Elder, K.: A Distributed Snow-Evolution Mod-eling System (SnowModel), J. Hydrometeorol., 7, 1259–1267, 2006.
Liston, G. E. and Sturm, M.: A snow-transport model for complex terrain, J. Glaciol., 44, 498–516, 1998.
Lythe, M. B. and Vaughan, D. G.: BEDMAP: a new ice thick-ness and subglacial topographic model of Antarctica, J. Geophys. Res., 106, 335–351, doi:10.1029/2000JB900449, 2001.
Mann, G. W.: Surface Heat and Water Vapour Budgets over Antarc-tica, Ph.D. thesis, University of Leeds, UK, 1998.
Mann, G. W., Anderson, P. S., and Mobbs, S. D.: Profile measure-ments of blowing snow at Halley, Antarctica, J. Geophys. Res., 105, 491–508, 2000.
Mobbs, S. D. and Dover, S. E.: Numerical Modelling of Blowing Snow, Antarctic Special Topic, 55–63, 1993.
Ohata, T.: Heat balance at the snow surface in a katabatic wind zone, east Antarctica, Ann. Glaciol., 6, 174–177, 1985.
Pattyn, F., Matsuoka, K., and Berte, J.: Meteorological conditions in the vicinity of the Princess Elisabeth Station, Antarctica, Antarct. Sci., 22, 79–85, doi:10.1017/S0954102009990344, 2009. Pomeroy, J. W. and Gray, D. M.: Saltation of snow, Water Resour.
Res., 26, 1583–1594, 1990.
Pomeroy, J. W., Gray, D. M., and Landine, P. G.: The Prairie Blow-ing Snow Model: Characteristics, Validation, Operation, J. Hy-drol., 144, 165–192, 1993.
Reijmer, C. H. and Oerlemans, J.: Temporal and spatial vari-ability of the surface energy balance in Dronning Maud Land, East Antarctica, J. Geophys. Res., 107, 4759–4770, doi:10.1029/2000JD000110, 2002.
Reijmer, C. H. and Van den Broeke, M. R.: Temporal and spa-tial variability of the surface mass balance in Dronning Maud Land, Antarctica, as derived from automatic weather stations, J. Glaciol., 49, 512–520, doi:10.3189/172756503781830494, 2003.
Schmidt, R. A.: Vertical profiles of wind speed, snow concentration and humidity in blowing snow, Bound.-Lay. Meteorol., 23, 223– 246, 1982.
Schmidt, R. A.: Transport rate of drifting snow and the mean wind speed profile, Bound.-Lay. Meteorol., 34, 213–241, 1986. Schwerdtfeger, W.: Weather and climate of the Antarctic, Elsevier,
Amsterdam, The Netherlands, 1984.
Takahashi, S., Endoh, T., Azuma, N., and Meshida, S.: Bare ice fields developed in the inland part of Antarctica, Proceedings of the NIPR Symposium on Polar Meteorology and Glaciology, Tokyo, Japan, 12–13 June 1990, 128–139, 1992.
Takahashi, S., Ageta, Y., Fujii, Y., and Wanatabe, O.: Surface mass balance in east Dronning Maud Land, Antarctica, observed by Japanese Antarctic Research Expeditions, Ann. Glaciol., 20, 242–248, 1994.
Uematsu, T.: Numerical study on snow transport and drift forma-tion, Ann. Glaciol., 18, 135–141, 1993.
Van As, D., Van den Broeke, M. R., Reijmer, C. H., and Van de Wal, R. S. W.: The summer surface energy balance of the high Antarctic Plateau, Bound.-Lay. Meteorol., 115, 289–317, 2005. Van de Berg, W. J., Van den Broeke, M. R., Reijmer, C. H.,
and Van Meijgaard, E.: Reassessment of the Antarctic sur-face mass balance using calibrated output of a regional at-mospheric climate model, J. Geophys. Res., 111, D11104, doi:10.1029/2005JD006495, 2006.
Van den Broeke, M. R. and Van Lipzig, N. P. M.: Changes in Antarctic temperature, wind and precipitation in response to the Antarctic Oscillation, Ann. Glaciol., 39, 119–126, 2004. Van den Broeke, M. R., Winther, J.-G., Isaksson, E., Pinglot, J.
Van den Broeke, M. R., Reijmer, C. H., and Van de Wal, R. S. W.: A study of the surface mass balance in Dronning Maud Land, Antarctica, using automatic weather stations, J. Glaciol., 50, 565–582, 2004a.
Van den Broeke, M. R., Van As, D., Reijmer, C. H., and Van de Wal, R. S. W.: The surface radiation balance in Antarctica as measured with automatic weather stations. J. Geophys. Res., 109, 1–17, doi:10.1029/2003JD004394, 2004b.
Van den Broeke, M. R., Reijmer, C. H., Van As, D., Van de Wal, R., and Oerlemans, J.: Seasonal cycles of Antarctic surface energy balance from automatic weather stations, Ann. Glaciol., 41, 131– 139, 2005.
Van den Broeke, M. R., Smeets, C. J. P. P., and Van de Wal, R. S. W.: The seasonal cycle and interannual variability of surface energy balance and melt in the ablation zone of the west Greenland ice sheet, The Cryosphere, 5, 377–390, doi:10.5194/tc-5-377-2011, 2011.
Van Lipzig, N. P. M.: Wind, in: Encyclopedia of the Antarctic, edited by: Riffenburgh, B., Routledge, Oxon, UK, 1084–1086, 2007.
Van Lipzig, N. P. M., Van Meijgaard, E., and Oerlemans, J.: Tem-perature sensitivity of the Antarctic surface mass balance in a regional atmospheric climate model, J. Climate, 15, 2758–2774, 2002a.
Van Lipzig, N. P. M., Van Meijgaard, E., and Oerlemans, J.: The spatial and temporal variability of the surface mass balance in Antarctica: results from a regional atmospheric climate model, Int. J. Climatol., 22, 1197–1217, doi:10.1002/joc.798, 2002b. Van Lipzig, N. P. M., King, J. C., Lachlan-Cope, T. A., and Van den
Broeke, M. R.: Precipitation, sublimation, and snowdrift in the Antarctic Peninsula region from a regional atmospheric model, J. Geophys. Res., 119, D24106, doi:10.1029/2004JD004701, 2004. Vaughan, D. G., Bamber, J. L., Giovinetto, M., Russell, J., and Cooper, A. P. R.: Reassessment of net surface mass balance in Antarctica, J. Climate, 12, 933–946, 1999.
Wamser, C. and Lykossov, V. N.: On the friction velocity during blowing snow, Contrib. Atmos. Phys., 68, 85–94, 1995. Wendler, G., Stearns, C., Weidner, G. A., and Dargaud, G.: On the
extraordinary katabatic winds of Adelie Land, J. Geophys. Res., 102, 4463–4474, doi:10.1029/96JD03438, 1997.