TCD
6, 563–591, 2012Inferring snow pack ripening and melt
M.-O. Schmid et al.
Title Page
Abstract Introduction
Conclusions References
Tables Figures
◭ ◮
◭ ◮
Back Close
Full Screen / Esc
Printer-friendly Version Interactive Discussion
Discussion
P
a
per
|
Dis
cussion
P
a
per
|
Discussion
P
a
per
|
Discussio
n
P
a
per
|
The Cryosphere Discuss., 6, 563–591, 2012 www.the-cryosphere-discuss.net/6/563/2012/ doi:10.5194/tcd-6-563-2012
© Author(s) 2012. CC Attribution 3.0 License.
The Cryosphere Discussions
This discussion paper is/has been under review for the journal The Cryosphere (TC). Please refer to the corresponding final paper in TC if available.
Inferring snow pack ripening and melt
out from distributed ground surface
temperature measurements
M.-O. Schmid, S. Gubler, J. Fiddes, and S. Gruber
Department of Geography, University of Z ¨urich, Switzerland
Received: 13 January 2012 – Accepted: 25 January 2012 – Published: 10 February 2012 Correspondence to: M.-O. Schmid ([email protected])
TCD
6, 563–591, 2012Inferring snow pack ripening and melt
M.-O. Schmid et al.
Title Page
Abstract Introduction
Conclusions References
Tables Figures
◭ ◮
◭ ◮
Back Close
Full Screen / Esc
Printer-friendly Version Interactive Discussion
Discussion
P
a
per
|
Dis
cussion
P
a
per
|
Discussion
P
a
per
|
Discussio
n
P
a
per
|
Abstract
The seasonal snow cover and its melting are heterogeneous both in space and time. Describing and modelling this variability are important because it affects divers phe-nomena such as runoff, ground temperatures or slope movements. This study investi-gates the derivation of melting characteristics based on spatial clusters of temperature
5
measurements. Results are based on data from Switzerland where ground surface temperatures were measured with miniature loggers (iButtons) at 40 locations, referred to as footprints. At each footprint, ten iButtons have been distributed randomly few cm below the ground surface over an area of 10 m×10 m. Footprints span elevations of 2100–3300 m a.s.l. and slope angles of 0–55◦, as well as diverse slope expositions and
10
types of surface cover and ground material. Based on two years of temperature data, the basal ripening date and the melt-out date are determined for each iButton, aggre-gated to the footprint level and further analysed. The date of melt out could be derived for nearly all iButtons, the ripening date could be extracted for only approximately half of them because it requires ground freezing below the snow pack. The variability within
15
a footprint is often considerable and one to three weeks difference between melting or ripening of the points in one footprint is not uncommon. The correlation of mean an-nual ground surface temperatures, ripening date and melt-out date is moderate, making them useful intuitive complementary measured for model evaluation.
1 Introduction 20
Seasonal snowmelt is important for mountain hydrology and water supply to lowlands. (Viviroli and Weingartner, 2004) and, it can contribute to the triggering of landslides and debris flows (Iverson et al., 1997; Wirz et al., 2011). Depending on environ-mental conditions, two distinct points in time can be recognized that help to quantify the temporal patterns of snowmelt. The melt-out date (MD) describes the time when
25
TCD
6, 563–591, 2012Inferring snow pack ripening and melt
M.-O. Schmid et al.
Title Page
Abstract Introduction
Conclusions References
Tables Figures
◭ ◮
◭ ◮
Back Close
Full Screen / Esc
Printer-friendly Version Interactive Discussion
Discussion
P
a
per
|
Dis
cussion
P
a
per
|
Discussion
P
a
per
|
Discussio
n
P
a
per
|
ground surface to warm above 0◦C. The basal-ripening date (RD) describes the time when a frozen ground surface is warmed to 0◦
C by melt-water percolation or by strong rain-on-snow events (Westermann et al., 2011). It can only be detected in situations having negative temperatures at the snow-ground interface. MD can be investigated using optical space-borne (Bitner et al., 2002; Li and Wang, 2011; Parajka and Bl ¨oschl,
5
2008) or ground-based (Schmidt et al., 2009) remote sensing. In recent times attempts have been made to detect RD with optical space-borne remote sensing (Foster et al., 2011; Lampkin and Yool, 2004). On ground measurements are feasible by means of miniature temperature loggers (Etzelm ¨uller et al., 2007; Gadek and Leszkiewicz, 2010; Hoelzle et al., 2003, 1999), hand tests (Techel and Pielmeier, 2011) or as part of more
10
comprehensive measurement stations (Lehning et al., 1999). Patterns of snow pack evolution and melting, are usually heterogeneous both in space and time, especially in mountain regions. This is because topography influences snow redistribution by wind and avalanches, surface micrometeorology and also the distribution of ground material. Grid-based snow cover distribution models are often used to estimate snow
15
cover evolution (Bartelt and Lehning, 2002; Bl ¨oschl et al., 1991a, b; Lehning et al., 2002a, b; Luce et al., 1998) or ground temperatures (Dall’Amico et al., 2011; Luetschg and Haeberli, 2005) in such environments. While Anderton et al. (2002) show that the micro-scale spatial variability of the snow cover needs to be taken into account to model snowmelt at larger scales, most data products for the evaluation of models are
20
based on satellite data with rather coarse resolution (Brown, 2000; Dyer and Mote, 2006; Gutzler and Rosen, 1992; Scherrer, 2006). In contrast to this, the role of to-pography and fine-scale variability of snow cover evolution is investigated in a number of local studies by e.g. Jost et al. (2007), L ´opez-Moreno et al. (2011), Gr ¨unewald et al. (2010), and Schmidt et al. (2009).
25
TCD
6, 563–591, 2012Inferring snow pack ripening and melt
M.-O. Schmid et al.
Title Page
Abstract Introduction
Conclusions References
Tables Figures
◭ ◮
◭ ◮
Back Close
Full Screen / Esc
Printer-friendly Version Interactive Discussion
Discussion
P
a
per
|
Dis
cussion
P
a
per
|
Discussion
P
a
per
|
Discussio
n
P
a
per
|
inexpensive and distributed information about MD and RD. Specifically, we investi-gate (a) how to derive MD and RD under diverse environmental conditions; (b) how fine-scale variability affects the relationship between point measurements and grid-based representations; and (c) how MD, RD and MAGST are related with topographic variables.
5
2 Data
2.1 Research area and meteorological conditions during the measurement period
This study is based on the dataset described by Gubler et al. (2011) of which now two measured years are available. The field area is situated around Piz Corvatsch a
10
mountain in the Eastern Swiss Alps, in the Upper Engadin close to St. Moritz. The 0◦ C-isotherm of the mean annual air temperature (MAAT) is situated at an altitude of about 2200 m a.s.l. and the investigation area is partially subject to permafrost conditions. The western and northern flanks of Piz Corvatsch feature large debris slopes and several rock glaciers, whereas further south in the Furtschellas area, inactive and relict
15
rock glaciers are present.
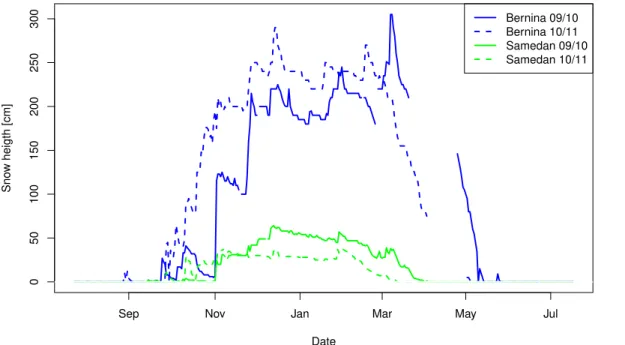
MAAT is measured by MeteoSwiss at Piz Corvatsch in the research area and at the nearby weather stations Passo del Bernina and Samedan. The 2011 period (20 August 2010 to 19 August 2011) was between 0.2◦C and 0.47◦C warmer than the 2010 period. Both were warmer than the normal period 1961–1990. The snow cover
20
development at nearby stations during both winters has been relatively similar to the long-term average. Snow heights in winter 2009/2010 were slightly above average and in 2010/2011 slightly below average. MD at Passo del Bernina and Samedan was earlier in 2011 than in 2010. Both periods had strong snow fall outside the winter season, significant events occurred in mid June and early October 2010 (Pielmeier,
25
TCD
6, 563–591, 2012Inferring snow pack ripening and melt
M.-O. Schmid et al.
Title Page
Abstract Introduction
Conclusions References
Tables Figures
◭ ◮
◭ ◮
Back Close
Full Screen / Esc
Printer-friendly Version Interactive Discussion
Discussion
P
a
per
|
Dis
cussion
P
a
per
|
Discussion
P
a
per
|
Discussio
n
P
a
per
|
2.2 Measurement setup
Miniature temperature loggers iButton® DS1922L with a resolution of 0.0625◦C were programmed to record GST every three hours, allowing for more than one year au-tonomous operation with the memory available. The accuracy is stated to be±0.5◦C
by the manufacturer and has been determined to be ±0.125◦C near 0◦C by Gubler
5
et al. (2011). In July and August 2009, 390 iButtons were distributed within 39 so-called footprints. These span elevations of 2100–3300 m a.s.l. the slope aspects North, South, East, West and slope angles of 0–55◦. Each footprint consists of ten iButtons randomly placed within 10 m×10 m in order to capture small-scale variability, program-ming and read-out was facilitated by the software iAssist. (Keller et al., 2010). A digital
10
elevation model with a resolution of 25 m was used to derive elevation, slope angle and slope exposition of all footprints and the ground cover type (GCT) classification defined by Schmid (2011) and Gubler et al. (2011) was used: GCT1 is fine-grained, sometimes partly organic material; GCT3 consists of large boulders (e.g. rock glaciers); and GCT2 is an intermediate type between both. GCT4 characterizes strongly heterogeneous and
15
steep footprints partially composed of bedrock.
In July and August 2010, 368 of 390 iButtons were retrieved and contained GST for one whole year. In August 2011, 357 iButtons were recovered and 355 contained complete GST series. The one-year periods used for analysis range from 20 August to 19 August and are here referred to as 2010 and 2011, indicating the year of data
read-20
out. iButtons found on the surface and exposed to direct solar radiation were excluded from subsequent analysis. This resulted in 92 % (first year) and 89 % (second year) of valid time series. Data gaps during read-out have a maximum length of one day and are filled by linear interpolation between adjacent measurements. The analyses shown here are based on 343 iButtons from the 2010 period, 348 iButtons from 2011 and 338
25
TCD
6, 563–591, 2012Inferring snow pack ripening and melt
M.-O. Schmid et al.
Title Page
Abstract Introduction
Conclusions References
Tables Figures
◭ ◮
◭ ◮
Back Close
Full Screen / Esc
Printer-friendly Version Interactive Discussion
Discussion
P
a
per
|
Dis
cussion
P
a
per
|
Discussion
P
a
per
|
Discussio
n
P
a
per
|
3 Methods
3.1 Melt out date
Due to its low thermal conductivity snow insulates the ground from the cold atmo-sphere during winter (Goodrich, 1982) and in several studies this effect is used to detect a snow cover based on GST time series. Based on the daily variance of GST,
5
Danby and Hik (2007) considered a threshold of 1◦C (4 h sampling rate), and Schmidt et al. (2009) one of 0.09◦C (1 h sampling rate) to indicate snow-covered ground. Gadek and Leszkiewicz (2010) estimated the presence of a snow cover simply based on days with GST≤0◦C. All three approaches are based on rather small range of
environmen-tal conditions and, when applied to the large data set of this study yield only partly
10
satisfying results. The following observations are made based on visually inspecting time series of GST and their daily variance: (a) most locations clearly show the pres-ence of an insulating snow cover during winter, few locations clearly show the abspres-ence of it, and some appear to lie in between. (b) The beginning of a snow cover, that then may be thin and provide little insulation, is more difficult to detect than the date
15
of its melt-out (MD). (c) Detection of MD based on daily variance alone is unreliable due to spurious snow-free periods during winter. Furthermore, an overestimation of snow cover days occurs at locations with a generally low daily variance of GST when using fixed thresholds. (d) Detection of MD based on temperature alone is unreliable because a few cm below the ground surface, low-elevation sites can maintain positive
20
temperatures during a thick snow cover for prolonged periods.
As the detection of MD requires an insulating snow cover, we define a snow-cover re-liability index (MDr) based on the mean daily standard deviation of GST during January, February and March being≤0.4.
MDr=0.4−σ GSTJan−Mar
(1)
25
TCD
6, 563–591, 2012Inferring snow pack ripening and melt
M.-O. Schmid et al.
Title Page
Abstract Introduction
Conclusions References
Tables Figures
◭ ◮
◭ ◮
Back Close
Full Screen / Esc
Printer-friendly Version Interactive Discussion
Discussion
P
a
per
|
Dis
cussion
P
a
per
|
Discussion
P
a
per
|
Discussio
n
P
a
per
|
derivation of MD is assumed to be present if MDr is above 0. For those iButtons, daily standard deviation of GST is used to flag snow-covered days using a threshold of 0.3 for negative GST and one of 0.1 for positive GST. Two different thresholds are necessary because for days with negative GST, mostly thermal insulation of the snow cover affects standard deviation. Positive GST, however, can only occur under a wet snow cover
5
where temperature fluctuations are additionally damped by phase change. Spurious gaps resulting from the standard deviation based determination of snow-cover were closed for days with GST≤0.5◦C. Days with a maximum GST >3◦C are considered snow-free based on observations at the lowest site (2100 m a.s.l.). MD is defined as the end date of the snow cover period with the longest duration. It is aggregated to the
10
footprint level as a mean value. Where MD could not be detected for all iButtons in a footprint, it was calculated if at least five values were available.
3.2 Basal ripening date
In many places, temperatures below 0◦C seasonally prevail in the snow pack and the ground below. Liquid water originating from surface melting or rain infiltrates and warms
15
deeper layers through the release of latent heat during refreezing. Once the melt water reaches the ground surface and warms it to 0◦C, the snowpack above is isothermal at a temperature of 0◦C. This point in time, the ripening date (RD), is detected as the begin-ning of the zero curtain period in spring and marks the beginbegin-ning of melt water runoff or percolation into the ground. The development of preferential flow paths in snow.
20
(Williams et al., 2010) increases the lateral variability between cold and isothermal portions of the snow pack and ground below and, as a consequence, also the lateral variability of RD. Commonly, no cooling below 0◦C takes place at the ground surface after the RD, sometimes however, cold conditions can cause a complete refreezing of the melting snow pack and interrupt the zero curtain period.
25
TCD
6, 563–591, 2012Inferring snow pack ripening and melt
M.-O. Schmid et al.
Title Page
Abstract Introduction
Conclusions References
Tables Figures
◭ ◮
◭ ◮
Back Close
Full Screen / Esc
Printer-friendly Version Interactive Discussion
Discussion
P
a
per
|
Dis
cussion
P
a
per
|
Discussion
P
a
per
|
Discussio
n
P
a
per
|
RDr=
−50−FDD if MDr>0;
0 if MDr≤0. (2)
where FDD is the sum of negative daily mean GST during the snow cover period with the longest duration. Only for RDr>0, RD is derived. This is because zero curtain periods during freezing can only be distinguished from those during thawing if the ground gets can clearly be detected as frozen in between. At many low-elevation
5
footprints, iButtons did not record negative temperatures, making it impossible to detect the start of an isothermal snow pack, since the zero curtain periods last for the entire winter.
Based on the vicarious calibration reported by Gubler et al. (2011), days with GST between −0.25◦C and 0.25◦C were defined as a zero curtain period and RD was
10
detected as the beginning of zero-curtain days after the longest period of daily mean GST smaller than −0.25◦C. RD is aggregated to the footprint level as a mean value. Where RD could not be detected for all iButtons in a footprint, it was calculated if at least five values were available.
3.3 Mean annual ground surface temperature 15
Mean annual ground surface temperature (MAGST) is a useful measure characterising the ground thermal regime of a location. It is calculated as the mean of all measure-ments per iButton.
4 Results
4.1 General description 20
TCD
6, 563–591, 2012Inferring snow pack ripening and melt
M.-O. Schmid et al.
Title Page
Abstract Introduction
Conclusions References
Tables Figures
◭ ◮
◭ ◮
Back Close
Full Screen / Esc
Printer-friendly Version Interactive Discussion
Discussion
P
a
per
|
Dis
cussion
P
a
per
|
Discussion
P
a
per
|
Discussio
n
P
a
per
|
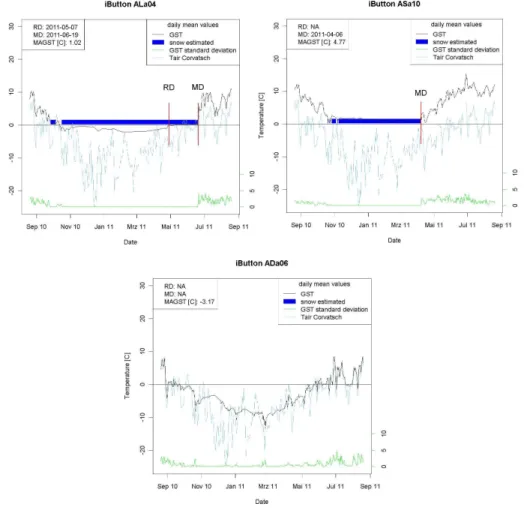
ground in autumn the GST is strongly isolated from the atmosphere during winter, indicating the presence of a comprehensive snow cover. In spring, a zero curtain period is occurring. For this device it is possible to detect both, the RD and the MD. iButton ASa10 is located in a forest glade at 2100 m a.s.l. The insulating snow cover prevents the ground from freezing and therefore, MD but not RD was detected. For
5
ADa06, classified as GCT4, neither MD not RD are detected. An Overview with the number of valid iButtons per footprint and the number of detected MD and RD is in Table A1.
4.2 Intra-footprint variability
MD was detected in 2010 and 2011 for 329 iButtons. In both years, no average value
10
for footprint AOa was calculated and in 2011 also AGa and AOb had to be excluded. The mean standard deviation per footprint is in the first year 7 days and in the second year 8 days (Table 1).
RD could be calculated only for approximately half the iButtons due to a lack of snow or ground freezing. Lack of snow was frequent on footprints of GCT 4 and lack of
15
ground freezing mostly occurred at low-elevation sites. In 2010, RD could be calculated for 186 iButtons and aggregated to 21 footprints, and in 2011 for 163 iButtons or 16 footprints. A mean value per footprint over both years is calculated for 14 locations. The mean standard deviation per footprint is in both years 5 days (Table 1).
When using single-point measurements for evaluating grid-based models, Table 1
20
shows the standard deviation to be expected within a radius of several meters, based on all footprints with at least 5 detected RD, respectively MD. In some cases small scale variability can be much higher with a standard deviation of more than 20 days as shown in Fig. 3 for all footprints.
The intra-footprint variability of the RD and the MD for both years is shown in Fig. 3.
25
TCD
6, 563–591, 2012Inferring snow pack ripening and melt
M.-O. Schmid et al.
Title Page
Abstract Introduction
Conclusions References
Tables Figures
◭ ◮
◭ ◮
Back Close
Full Screen / Esc
Printer-friendly Version Interactive Discussion
Discussion
P
a
per
|
Dis
cussion
P
a
per
|
Discussion
P
a
per
|
Discussio
n
P
a
per
|
relation with site-specific factors implies, at least for the short period of observation reported here, that meteorological conditions and their influence of e.g. snow drift and deposition exert a dominating control on intra-footprint variability. As a consequence, it is difficult to predict how well one single time series of GST represents RD and MD for a small area surrounding it or a model grid cell in a validation exercise.
5
4.3 Inter-footprint variability
MD varies from 13 April at AGa to 24 July at AWa in 2010 and from 8 April at ACa to 17 July at BCa in 2011. The mean MD is 14 June in 2010 and 20 May in 2011. RD varies from 23 March at AAa to 10 June at ADa in 2010 and from 22 March at ACa to 19 May at BCa in 2011. The mean RD is 14 May in 2010 and 28 April in 2011. Standard
10
deviations for RD and MD are shown in Table 1.
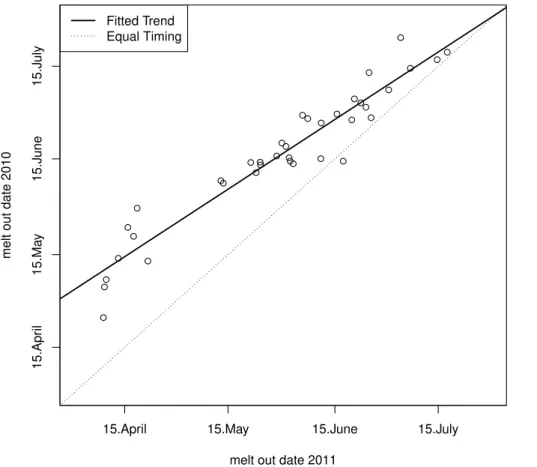
RD and MD are shifted towards an earlier date in 2011 with respect to 2010. In 2011, the average RD is 20 days earlier than in 2010 and the ground is on average snow-free 17 days earlier than in 2010, taking in account only footprints where RD respectively MD was detected for both years. The shift of MD is more pronounced at locations with
15
an early MD, whereas at locations with a late MD, the difference between the two years is much smaller (Fig. 4).
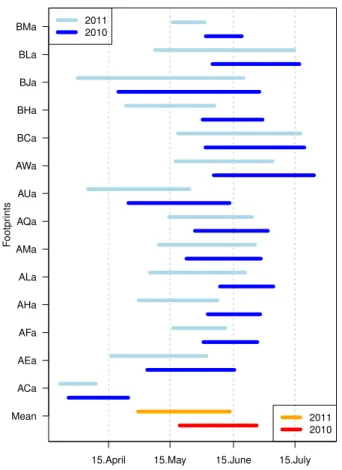
For 14 footprints RD and MD could be detected in both years (Fig. 5). This allows cal-culating an average melting period for the footprint. At most footprints, GST constantly remains at 0◦C from RD to MD but in few cases, GST briefly drops below 0◦C. This
20
can be explained by the reduced insulation of the ground from the atmosphere due to a reduction of snow height and increase in thermal conductivity because of melting. The length change of the melting period is less pronounced with an average melting period for those 15 locations of 37 days in the first year and 45 days in the second year. No relation of the melt length to the GCT is visible, even though this has to be interpreted
25
with caution due to the very small sample size.
TCD
6, 563–591, 2012Inferring snow pack ripening and melt
M.-O. Schmid et al.
Title Page
Abstract Introduction
Conclusions References
Tables Figures
◭ ◮
◭ ◮
Back Close
Full Screen / Esc
Printer-friendly Version Interactive Discussion
Discussion
P
a
per
|
Dis
cussion
P
a
per
|
Discussion
P
a
per
|
Discussio
n
P
a
per
|
variables elevation, slope aspect and ground cover were used in the model. As as-pect is a circular variable, e.g. 360 is equal to 0, the cosine of asas-pect is used for the dependence on north-south directions and the sine of the aspect for the dependence on west-east directions. GCT is regarded as a categorical variable. The intercept is given in days since the beginning of the year. Model selection was performed
accord-5
ing to the Akaike-Criterion (Akaike, 1973). Interactions and quadratic dependences were taken into account in the model selection process, but were not significant. The following model was selected:
MDk=Intercept+a×Elevation+b×Slope+c×cos(Aspect) (3)
For both years the model is able to explain the variability of MD to a certain degree.
10
Parameters and 95 % confidence intervals for the models are shown in Table 2. For each year, a separate selection of significant explanatory variables was per-formed. As we can see above, the selected variables agree for both years, supporting the validity of the models. These models express a later MD with increasing elevation and northern slope aspects as well as an earlier MD for steeper slopes. By contrast,
15
such an agreement of the explanatory variables could not be found for RD, possibly partly caused by the comparably small number of footprints where the RD could be estimated.
At the footprint level, the coefficients of determination for the periods 2010 and 2011 are 0.61 and 0.81 between MAGST and RD, 0.22 and 0.26 between MAGST and MD,
20
and 0.59 and 0.50 between RD and MD. This implies these quantities to be useful complementary measures for model validation.
4.4 Inter-annual MAGST variations
The mean intra-footprint standard deviation of MAGST over all footprint is 0.33◦C in both years. The difference of intra-footprint standard deviations between 2010 and
25
TCD
6, 563–591, 2012Inferring snow pack ripening and melt
M.-O. Schmid et al.
Title Page
Abstract Introduction
Conclusions References
Tables Figures
◭ ◮
◭ ◮
Back Close
Full Screen / Esc
Printer-friendly Version Interactive Discussion
Discussion
P
a
per
|
Dis
cussion
P
a
per
|
Discussion
P
a
per
|
Discussio
n
P
a
per
|
At Piz Corvatsch, MAAT during the 2011 analysis period was 0.4◦C warmer than in 2010 and similar differences were recorded at the nearby stations Samedan and Passo del Bernina. By comparison, MAGST averaged over all footprints increased by 0.17◦C. This however is no uniform response: the mean absolute difference of footprint-level MAGST is 0.27◦
C, with 16 cooling and 25 warming footprints.
5
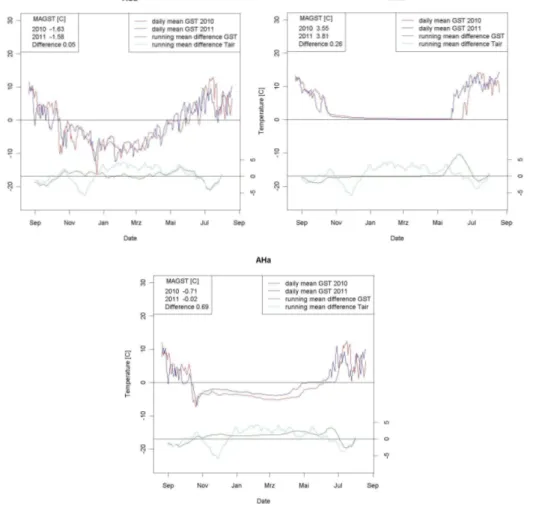
The comparison of daily mean GST for 2010 and 2011 shows much larger diff er-ences during summer than winter (Fig. 6). This can be explained by the effect of a snow cover that provides insulation between the ground and the atmosphere. Both the onset and the melt out of the snow cover strongly determine whether the seasonal snow cover has a warming or a cooling effect on the MAGST (Zhang, 2005). In this
10
study both situations were observed. An absolute quantification is not possible be-cause air temperatures have not been measured at any of the snow covered locations. The GST in winter in the second year are slightly warmer than in the first year, even though the snow coverage was thinner in the second winter (Pielmeier, 2011; Stucki, 2010). The difference of the MAGST is also strongly influenced by the air temperature
15
during the snow free period. For example the cold July in 2011 led at all locations to significantly colder GST than in the previous year. Therefore the average difference of the MAGST from the two years is only 0.17◦C.
When looking at inter-annual GST differences and snow cover, a pattern exemplified by the three typical situations in Fig. 6 is visible: at footprints such as AGa or AO with
20
a low MDr indicative of a thin snow cover, large fluctuations and often slightly warmer temperatures during winter 2011 occurred. For footprints such as ANa or BAa with a high MDr indicative of an insulating snow cover and a low RDr indicative of unfrozen ground, GST stayed close to 0◦C during winter. The earlier MD in 2011, however, caused earlier warming of the ground and a positive difference of GST between the
25
TCD
6, 563–591, 2012Inferring snow pack ripening and melt
M.-O. Schmid et al.
Title Page
Abstract Introduction
Conclusions References
Tables Figures
◭ ◮
◭ ◮
Back Close
Full Screen / Esc
Printer-friendly Version Interactive Discussion
Discussion
P
a
per
|
Dis
cussion
P
a
per
|
Discussion
P
a
per
|
Discussio
n
P
a
per
|
except that class 3 and 4 are taken as one in this study. The strongly differing reactions of MAGST to the meteorological differences between 2010 and 2011, some showing warming and some showing cooling, underscores the differences in transient response of frozen ground and permafrost conditions to be expected from climate change, even if the longer-term averaging will likely have a smoothing effect.
5
5 Discussion
The high spatial resolution of GST measurements in this study provides a sound basis for deriving RD and MD, and for investigating their spatio-temporal patterns. As mea-surements are from two years only, results regarding the inter-annual variability and to a lesser degree all absolute values, must be interpreted with caution since
meteoro-10
logical conditions and especially snow cover, can vary strongly (Brenning et al., 2005; Etzelm ¨uller et al., 2007; Gruber, 2004; Hipp et al., 2011; Hoelzle et al., 2003; Isaksen et al., 2002). Detection of the onset of a snow cover based on GST is inherently uncertain but also of minor importance as it is much more homogeneous than MD. As MD coin-cides with rapidly increasing GST, it is also relatively straightforward to detect. MD was
15
only calculated for locations with a comprehensive snow cover, identified based on a standard deviation based reliability index, to avoid imprecision. As no suitable ground truth data for RD and MD could be collected, no direct validation can be performed. The shown methods are to be interpreted as tools for the repeatable extraction of in-formation that could also be interpreted subjectively. In comparison to other published
20
GST-based snow detection algorithms (Danby and Hik, 2007; Gadek and Leszkiewicz, 2010; Schmidt et al., 2009; Schneider et al., 2011) the method proposed in this study has been tested in a far wider range of environmental conditions. MD could be de-tected at nearly all locations, whereas RD was only dede-tected at half of the locations. RD as the start of the zero curtain in spring can be detected precisely based on GST
25
TCD
6, 563–591, 2012Inferring snow pack ripening and melt
M.-O. Schmid et al.
Title Page
Abstract Introduction
Conclusions References
Tables Figures
◭ ◮
◭ ◮
Back Close
Full Screen / Esc
Printer-friendly Version Interactive Discussion
Discussion
P
a
per
|
Dis
cussion
P
a
per
|
Discussion
P
a
per
|
Discussio
n
P
a
per
|
FDDs used in the reliability index RDr effectively excludes these locations. The lower number of footprints with a detected RD makes it a challenge to relate it to topography and ground cover. The possible field of application for RD is more limited, as it only works for a subset of the places at which a snow cover is present.
The linear regression performed for MD shows that elevation, slope and north-south
5
dependency are the important explanatory variables. The adjustedR2values of 56 % in 2010 and 65 % in 2011 are similar to the results of Schmidt et al. (2009) and Tappeiner et al. (2001) which achieved an adjusted R2 of 61 % and 71 %, respec-tively. As Tappeiner et al. (2001) we used a different model for each year. The models are stating the same influence of slope angle, whereas the influence of elevation and
10
the north-south dependency are varying for the two years. For every 10◦a slope gets steeper, the MD is about one week earlier. This can be explained by an increasing surface area of steeper slopes and by snow redistribution due to avalanches. The measurement setup with most locations at a similar elevation yields a high impact of the few low and high elevation sites on the elevation gradient in any model. As shown
15
in Fig. 4, the shift to earlier MD was much more pronounced at locations with an al-ready early MD, whereas locations with a late MD have seen only a reduced effect. Thus, the stronger dependency of MD on elevation in 2011 with 42 days difference per 1000 m compared to the 25 days per 100 m in 2010, seems reasonable. By compari-son, Schmidt et al. (2009) stated a difference of 93 days per 1000 m elevation change.
20
MD has a high correlation with maximum snow height (Anderton et al., 2004), war-ranting a comparison of this study with results concerning the snow water equivalent (SWE) from Jost et al. (2007). While reporting similar patterns, they show the influ-ence of northness on maximum SWE to be about 4 to 6 times smaller than 1000 m of elevation change.
25
TCD
6, 563–591, 2012Inferring snow pack ripening and melt
M.-O. Schmid et al.
Title Page
Abstract Introduction
Conclusions References
Tables Figures
◭ ◮
◭ ◮
Back Close
Full Screen / Esc
Printer-friendly Version Interactive Discussion
Discussion
P
a
per
|
Dis
cussion
P
a
per
|
Discussion
P
a
per
|
Discussio
n
P
a
per
|
than the average can occur. The inter-footprint variability of RD and MD lies between three and four weeks. Absolute values have seen a strong shift between the two years, making both RD and MD earlier in 2011. The differences in the length of the melting season (MD-RD) between 2010 and 2011 are for nearly all footprints smaller than the absolute shift in days.
5
6 Conclusions
Based on GST measurements with iButtons, it is possible to derive MD for all locations with an insulating snow cover and RD if the ground below the snow cover freezes during parts of the winter. The methods described here have been tested in a wide range of environmental conditions and provide reproducible results. Whereas MD was
10
detected for most of the locations, RD could be detected only for approximately half of all loggers. Because MAGST, RD and MD are only moderately correlated, they are complimentary intuitive measures for model validation.
A large intra-footprint variability was observed for both RD and MD at many locations. This underscores the concept of using multiple measurement points to characterise
15
one footprint. If validation of a grid-based model with single point measurements is undertaken, a difference of one to three weeks between RD or MD at the measured point and its immediate surroundings must be considered realistic in environments similar to that investigated here.
While based on the comparison of only two years, inter-annual variation of the
GST-20
derived products provides interesting insight. The difference in MD between 2010 and 2011 is stronger for locations with an early MD than those with a late MD. This adds to earlier findings of non-linear relation between changing environmental conditions and snow cover (Beniston et al., 2003; Sch ¨oner et al., 2009). Furthermore, the response of MAGST to a 0.4◦C increase of MAAT from one year to the other was diverse and
25
TCD
6, 563–591, 2012Inferring snow pack ripening and melt
M.-O. Schmid et al.
Title Page
Abstract Introduction
Conclusions References
Tables Figures
◭ ◮
◭ ◮
Back Close
Full Screen / Esc
Printer-friendly Version Interactive Discussion
Discussion
P
a
per
|
Dis
cussion
P
a
per
|
Discussion
P
a
per
|
Discussio
n
P
a
per
|
In view of the anticipated environmental changes in cold regions, a GST-based dis-tributed monitoring can provide a cost-effective method for detecting change and for validating models. Due to the strong variability of GST over short distances, the method of sampling fine-scale variability at the footprint level is important for deriving reliable measurements for interpretation or further aggregation.
5
Supplementary material related to this article is available online at:
http://www.the-cryosphere-discuss.net/6/563/2012/tcd-6-563-2012-supplement. zip.
Acknowledgements. This study was funded through the nano-tera.ch project X-Sense, the NCCR-MICS project Permasense and the SNF project CRYOSUB. The authors are
grate-10
ful for the support given by the Corvatschbahnen and acknowledge the contribution of im-plementing the iAssist software for work-flow automation in the field by M. Keller, J. Beutel, G. Hungerb ¨uhler, O. Knecht and Suhel Sheikh of the ETH computer engineering department. As fieldwork was time consuming it would not have been possible without the support of many friends – thanks a lot!
15
References
Akaike, H.: A new look at the statistical model identification, IEEE Trans. Autom. Control, 19, 716–723, 1973.
Anderton, S. P., White, S. M., and Alvera, B.: Micro-scale spatial variability and the timing of snow melt runoff in a high mountain catchment, J. Hydrol., 268, 158–176,
20
doi:10.1016/S0022-1694(02)00179-8, 2002.
Anderton, S. P., White, S. M., and Alvera, B.: Evaluation of spatial variability in snow water equivalent for a high mountain catchment, Hydrol. Process., 18, 435–453, doi:10.1002/hyp.1319, 2004.
Bartelt, P. and Lehning, M.: A physical SNOWPACK model for the Swiss avalanche
warn-25
TCD
6, 563–591, 2012Inferring snow pack ripening and melt
M.-O. Schmid et al.
Title Page
Abstract Introduction
Conclusions References
Tables Figures
◭ ◮
◭ ◮
Back Close
Full Screen / Esc
Printer-friendly Version Interactive Discussion
Discussion
P
a
per
|
Dis
cussion
P
a
per
|
Discussion
P
a
per
|
Discussio
n
P
a
per
|
Beniston, M., Keller, F., and Goyette, S.: Snow pack in the Swiss Alps under changing climatic conditions: an empirical approach for climate impacts studies, Theor. Appl. Climatol., 74, 19–31, doi:10.1007/s00704-002-0709-1, 2003.
Bitner, D., Carroll, T., Cline, D., and Romanov, P.: An assessment of the differences be-tween three satellite snow cover mapping techniques, Hydrol. Process., 16, 3723–3733,
5
doi:10.1002/hyp.1231, 2002.
Bl ¨oschl, G., Gutknecht, D., and Kirnbauer, R.: Distributed snowmelt simulations in an Alpine catchment – Part 2: Parameter study and model predictions, Water Resour. Res., 27, 3181– 3188, doi:10.1029/91WR02251, 1991a.
Bl ¨oschl, G., Kirnbauer, R., and Gutknecht, D.: Distributed snowmelt simulations in an Alpine
10
catchment – Part 1: Model evaluation on the basis of snow cover patterns, Water Resour. Res., 27, 3171–3179, doi:10.1029/91WR02250, 1991b.
Brenning, A., Gruber, S., and Hoelzle, M.: Sampling and statistical analyses of BTS measure-ments, Permafrost Periglac., 16, 383–393, doi:10.1002/ppp.541, 2005.
Brown, R. D.: Northern Hemisphere snow cover variability and change, 1915–1997, J. Climate,
15
13, 2339–2355, doi:10.1175/1520-0442(2000)013¡2339:NHSCVA¿2.0.CO;2, 2000.
Dall’Amico, M., Endrizzi, S., Gruber, S., and Rigon, R.: A robust and energy-conserving model of freezing variably-saturated soil, The Cryosphere, 5, 469–484, doi:10.5194/tc-5-469-2011, 2011.
Danby, R. K. and Hik, D. S.: Responses of white spruce (Picea glauca) to experimental
warm-20
ing at a subarctic alpine treeline, Glob. Change Biol., 13, 437–451, doi:10.1111/j.1365-2486.2006.01302.x, 2007.
Dyer, J. L. and Mote, T. L.: Spatial variability and trends in observed snow depth over North America, Geophys. Res. Lett., 33, L16503, doi:10.1029/2006GL027258, 2006.
Etzelm ¨uller, B., Farbrot, H., Gułdmundsson, ´A., Humlum, O., Tveito, O. E., and Bj ¨ornsson,
25
H.: The regional distribution of mountain permafrost in Iceland, Permafrost Periglac., 18, 185–199, doi:10.1002/ppp.583, 2007.
Foster, J. L., Hall, D. K., Eylander, J. B., Riggs, G. A., Nghiem, S. V., Tedesco, M., Kim, E., Montesano, P. M., Kelly, R. E. J., Casey, K. A., and Choudhury, B.: A blended global snow product using visible, passive microwave and scatterometer satellite data, Int. J. Remote
30
Sens., 32, 1371–1395, doi:10.1080/01431160903548013, 2011.
TCD
6, 563–591, 2012Inferring snow pack ripening and melt
M.-O. Schmid et al.
Title Page
Abstract Introduction
Conclusions References
Tables Figures
◭ ◮
◭ ◮
Back Close
Full Screen / Esc
Printer-friendly Version Interactive Discussion
Discussion
P
a
per
|
Dis
cussion
P
a
per
|
Discussion
P
a
per
|
Discussio
n
P
a
per
|
60, 205–211, 2010.
Gruber, S.: Permafrost thaw and destabilization of Alpine rock walls in the hot summer of 2003, Geophys. Res. Lett., 31, L13504, doi:10.1029/2004GL020051, 2004.
Gr ¨unewald, T., Schirmer, M., Mott, R., and Lehning, M.: Spatial and temporal variability of snow depth and ablation rates in a small mountain catchment, The Cryosphere, 4, 215–225,
5
doi:10.5194/tc-4-215-2010, 2010.
Gubler, S., Fiddes, J., Keller, M., and Gruber, S.: Scale-dependent measurement and analysis of ground surface temperature variability in alpine terrain, The Cryosphere, 5, 431–443, doi:10.5194/tc-5-431-2011, 2011.
Gutzler, D. S. and Rosen, R. D.: Interannual variability of wintertime snow cover
10
across the Northern Hemisphere, J. Climate, 5, 1441–1447, doi:10.1175/1520-0442(1992)005¡1441:IVOWSC¿2.0.CO;2, 1992.
Hipp, T., Etzelm ¨uller, B., Farbrot, H., and Schuler, T. V.: Modelling the temperature evolution of permafrost and seasonal frost in southern Norway during the 20th and 21st century, The Cryosphere Discuss., 5, 811–854, doi:10.5194/tcd-5-811-2011, 2011.
15
Hoelzle, M., Wegmann, M., and Krummenacher, B.: Miniature temperature datalog-gers for mapping and monitoring of permafrost in high mountain areas: first experi-ence from the Swiss Alps, Permafrost Periglac., 10, 113–124, doi:10.1002/(SICI)1099-1530(199904/06)10:2¡113::AID-PPP317¿3.0.CO;2-A, 1999.
Hoelzle, M., Haeberli, W., and Stocker-Mittaz, C.: Miniature ground temperature data logger
20
measurements 2000–2002 in the Murt `el-Corvatsch area, Eastern Swiss Alps, in Proceed-ings of the Eighth International Conference on Permafrost, 419–424, 2003.
Isaksen, K., Hauck, C., Gudevang, E., Ødeg ˚ard, R. S., and Sollid, J. L.: Mountain permafrost distribution in Dovrefjell and Jotunheimen, southern Norway, based on BTS and DC resistivity tomography data, Norsk Geogr. Tidsskr., 56, 122–136, doi:10.1080/002919502760056459,
25
2002.
Ishikawa, M.: Thermal regimes at the snow-ground interface and their implications for per-mafrost investigation, Geomorphology, 52, 105–120, doi:10.1016/S0169-555X(02)00251-9, 2003.
Iverson, R. M., Reid, M. E., and LaHusen, R. G.: Debris-flow mobilization from landslides,
30
Annu. Rev. Earth Planet. Sci., 25, 85–138, doi:10.1146/annurev.earth.25.1.85, 1997. Jost, G., Weiler, M., Gluns, D. R., and Alila, Y.: The influence of forest and
TCD
6, 563–591, 2012Inferring snow pack ripening and melt
M.-O. Schmid et al.
Title Page
Abstract Introduction
Conclusions References
Tables Figures
◭ ◮
◭ ◮
Back Close
Full Screen / Esc
Printer-friendly Version Interactive Discussion
Discussion
P
a
per
|
Dis
cussion
P
a
per
|
Discussion
P
a
per
|
Discussio
n
P
a
per
|
doi:10.1016/j.jhydrol.2007.09.006, 2007.
Keller, M., Hungerb ¨uhler, G., Knecht, O., Skeikh, S., Beutel, J., Gubler, S., Fiddes, J., and Gruber, S.: iAssist: Rapid Deployment and Maintenance of Tiny Sensing Systems, Pro-ceedings of the 8th ACM Conference on Embedded Networked Sensor Systems, 401–402, doi:10.1145/1869983.1870043, 2010.
5
Lampkin, D. J. and Yool, S. R.: Monitoring mountain snowpack evolution using near-surface op-tical and thermal properties, Hydrol. Process., 18, 3527–3542, doi:10.1002/hyp.5797, 2004. Lehning, M., Bartelt, P., Brown, B., Russi, T., St ¨ockli, U., and Zimmerli, M.: Snowpack model
calculations for avalanche warning based upon a new network of weather and snow stations, Cold Reg. Sci. Technol., 30, 145–157, doi:10.1016/S0165-232X(99)00022-1, 1999.
10
Lehning, M., Bartelt, P., Brown, B., Fierz, C., and Satyawali, P.: A physical SNOWPACK model for the Swiss avalanche warning – Part 2: Snow microstructure, Cold Reg. Sci. Technol., 35, 147–167, doi:10.1016/S0165-232X(02)00073-3, 2002a.
Lehning, M., Bartelt, P., Brown, B., and Fierz, C.: A physical SNOWPACK model for the Swiss avalanche warning – Part 3: meteorological forcing, thin layer formation and evaluation, Cold
15
Reg. Sci. Technol., 35, 169–184, doi:10.1016/S0165-232X(02)00072-1, 2002b.
Li, H.-Y. and Wang, J.: Simulation of snow distribution and melt under cloudy conditions in an Alpine watershed, Hydrol. Earth Syst. Sci., 15, 2195–2203, doi:10.5194/hess-15-2195-2011, 2011.
L ´opez-Moreno, J. I., Fassnacht, S. R., Beguera, S., and Latron, J. B. P.: Variability of snow
20
depth at the plot scale: implications for mean depth estimation and sampling strategies, The Cryosphere, 5, 617–629, doi:10.5194/tc-5-617-2011, 2011.
Luce, C. H., Tarboton, D. G., and Cooley, K. R.: The influence of the spatial distribution of snow on basin-averaged snowmelt, Hydrol. Process., 12, 1671–1683, 1998.
Luetschg, M. and Haeberli, W.: Permafrost evolution in the Swiss Alps in a
chang-25
ing climate and the role of the snow cover, Norsk Geogr. Tidsskr., 59, 78–83, doi:10.1080/00291950510020583, 2005.
Parajka, J. and Bl ¨oschl, G.: The value of MODIS snow cover data in validating and calibrating conceptual hydrologic models, J. Hydrol., 358, 240–258, doi:10.1016/j.jhydrol.2008.06.006, 2008.
30
Pielmeier, C.: Wetter, Schneedecke und Lawinengefahr Hydrologisches Jahr 2010/11, WSL-Insitut f ¨ur Schnee- und Lawinenforschung SLF, 2011.
TCD
6, 563–591, 2012Inferring snow pack ripening and melt
M.-O. Schmid et al.
Title Page
Abstract Introduction
Conclusions References
Tables Figures
◭ ◮
◭ ◮
Back Close
Full Screen / Esc
Printer-friendly Version Interactive Discussion
Discussion
P
a
per
|
Dis
cussion
P
a
per
|
Discussion
P
a
per
|
Discussio
n
P
a
per
|
and large-scale flow, Clim. Res., 32, 187–199, 2006.
Schmid, M.-O.: Variability of ground surface temperatures and related processes in high Alpine regions, MSc., Universty of Zurich, 2011.
Schmidt, S., Weber, B., and Winiger, M.: Analyses of seasonal snow disappearance in an alpine valley from micro- to meso-scale (Loetschental, Switzerland), Hydrol. Process., 23,
5
1041–1051, doi:10.1002/hyp.7205, 2009.
Schneider, S., Hoelzle, M., and Hauck, C.: Influence of surface heterogeneity on observed borehole temperatures at a mountain permafrost site in the Upper Engadine, Swiss Alps, The Cryosphere Discuss., 5, 2629–2663, doi:10.5194/tcd-5-2629-2011, 2011.
Sch ¨oner, W., Auer, I., and B ¨ohm, R.: Long term trend of snow depth at Sonnblick (Austrian Alps)
10
and its relation to climate change, Hydrol. Process., 23, 1052–1063, doi:10.1002/hyp.7209, 2009.
Stucki, T.: Wetter, Schneedecke und Lawinengefahr, Hydrologisches Jahr 2009/10., WSL-Insitut f ¨ur Schnee- und Lawinenforschung SLF, 2010.
Tappeiner, U., Tappeiner, G., Aschenwald, J., Tasser, E., and Ostendorf, B.: GIS-based
mod-15
elling of spatial pattern of snow cover duration in an alpine area, Ecol. Model., 138, 265–275, doi:10.1016/S0304-3800(00)00407-5, 2001.
Techel, F. and Pielmeier, C.: Point observations of liquid water content in wet snow – investigat-ing methodical, spatial and temporal aspects, The Cryosphere, 5, 405–418, doi:10.5194/tc-5-405-2011, 2011.
20
Viviroli, D. and Weingartner, R.: The hydrological significance of mountains: from regional to global scale, Hydrol. Earth Syst. Sci., 8, 1017–1030, doi:10.5194/hess-8-1017-2004, 2004. Westermann, S., Boike, J., Langer, M., Schuler, T. V., and Etzelmller, B.: Modeling the impact
of wintertime rain events on the thermal regime of permafrost, The Cryosphere, 5, 945–959, doi:10.5194/tc-5-945-2011, 2011.
25
Williams, M. W., Erickson, T. A., and Petrzelka, J. L.: Visualizing meltwater flow through snow at the centimetre-to-metre scale using a snow guillotine, Hydrol. Process., 24, 2098–2110, doi:10.1002/hyp.7630, 2010.
Wirz, V., Schirmer, M., Gruber, S., and Lehning, M.: Spatio-temporal measurements and anal-ysis of snow depth in a rock face, The Cryosphere, 5, 893–905, doi:10.5194/tc-5-893-2011,
30
2011.
TCD
6, 563–591, 2012Inferring snow pack ripening and melt
M.-O. Schmid et al.
Title Page
Abstract Introduction
Conclusions References
Tables Figures
◭ ◮
◭ ◮
Back Close
Full Screen / Esc
Printer-friendly Version Interactive Discussion
Discussion
P
a
per
|
Dis
cussion
P
a
per
|
Discussion
P
a
per
|
Discussio
n
P
a
per
|
Table 1.Standard deviations of the intra-footprint and inter-footprint scale.
Mean standard deviation RD [days] MD [days] MAGST [C] 2010 2011 2010 2011 2010 2011
Intra-footprint 5 5 7 8 0.33 0.33
TCD
6, 563–591, 2012Inferring snow pack ripening and melt
M.-O. Schmid et al.
Title Page
Abstract Introduction
Conclusions References
Tables Figures
◭ ◮
◭ ◮
Back Close
Full Screen / Esc
Printer-friendly Version Interactive Discussion
Discussion
P
a
per
|
Dis
cussion
P
a
per
|
Discussion
P
a
per
|
Discussio
n
P
a
per
|
Table 2.Parameters of the inter-footprint analysis for the MD model [3] as well as adjustedR2 andp-value. Values in brackets are 95 % confidence intervals.
2010 2011
Intercept 112 (50, 175) 46 (−27,119) a 0.025 (0.002, 0.048) 0.043 (0.016, 0.069) b −0.73 (−1.18,−0.28) −0.77 (−1.29,−0.24) c 22.75 (15.18, 30.32) 33.21 (24.21, 42.21)
AdjustedR2 0.56 0.65
p-value 7.10×10⁻⁷
TCD
6, 563–591, 2012Inferring snow pack ripening and melt
M.-O. Schmid et al.
Title Page
Abstract Introduction
Conclusions References
Tables Figures
◭ ◮
◭ ◮
Back Close
Full Screen / Esc
Printer-friendly Version Interactive Discussion
Discussion
P
a
per
|
Dis
cussion
P
a
per
|
Discussion
P
a
per
|
Discussio
n
P
a
per
|
Table A1.The lack of an insulating snow cover resulted in iButtons where MD was not 1 de-tected. The lack of a clearly frozen ground resulted in snow covered iButtons where 2 RD was not detected, except for some locations with GCT4 were no zero curtain phase 3 occurred (marked with∗
).
2010 2011
Footprint iButtons MD RD iButtons MD RD
AAa 10 10 8 10 10 0
ABa 10 10 3 10 10 5
ACa 10 10 7 10 10 8
ADa 10 7 7 10 8 2∗
AEa 10 9 9 10 10 10
AFa 10 10 10 10 9 9
AGa 10 5 4* 10 4 4
AHa 10 10 10 10 10 10
AIa 4 4 0 6 6 2
AJa 10 7 5* 10 5 2∗
ALa 4 4 4 4 4 4
ALb 5 5 5 5 5 3
AMa 10 10 10 10 10 10
ANa 9 9 0 9 9 0
AOa 5 4 4 5 2 1∗
AOb 5 5 5 5 4 4
APa 1 1 0 1 1 0
AQa 10 10 10 10 10 10
ARa 6 6 0 9 9 3
ASa 6 6 0 7 7 0
ATa 10 10 0 9 9 0
AUa 10 10 10 10 10 10
AVa 10 10 0 10 10 0
AWa 9 9 9 11 11 11
AXa 10 10 2 10 10 4
AYa 9 9 2 10 10 2
AZa 10 10 0 10 10 0
BAa 10 10 0 10 10 0
BBa 10 10 0 9 9 0
BCa 8 8 8 10 10 10
BDa 10 10 4 8 8 2
BEa 9 9 0 9 9 0
BFa 10 10 0 10 10 0
BGa 10 10 6 10 10 4
BHa 10 10 6 10 10 6
BIa 4 4 0 3 3 0
BJa 10 10 10 10 10 7
BKa 9 9 9 10 10 4
BLa 10 10 10 9 9 9
BMa 10 9 9 9 8 7∗
TCD
6, 563–591, 2012Inferring snow pack ripening and melt
M.-O. Schmid et al.
Title Page
Abstract Introduction
Conclusions References
Tables Figures
◭ ◮
◭ ◮
Back Close
Full Screen / Esc
Printer-friendly Version Interactive Discussion
Discussion
P
a
per
|
Dis
cussion
P
a
per
|
Discussion
P
a
per
|
Discussio
n
P
a
per
|
0
50
100
150
200
250
300
Date
Sno
w heigth [cm]
Sep Nov Jan Mar May Jul
Bernina 09/10 Bernina 10/11 Samedan 09/10 Samedan 10/11
TCD
6, 563–591, 2012Inferring snow pack ripening and melt
M.-O. Schmid et al.
Title Page
Abstract Introduction
Conclusions References
Tables Figures
◭ ◮
◭ ◮
Back Close
Full Screen / Esc
Printer-friendly Version Interactive Discussion
Discussion
P
a
per
|
Dis
cussion
P
a
per
|
Discussion
P
a
per
|
Discussio
n
P
a
per
|
TCD
6, 563–591, 2012Inferring snow pack ripening and melt
M.-O. Schmid et al.
Title Page Abstract Introduction Conclusions References Tables Figures ◭ ◮ ◭ ◮ Back Close
Full Screen / Esc
Printer-friendly Version Interactive Discussion Discussion P a per | Dis cussion P a per | Discussion P a per | Discussio n P a per | ● ● ● ● ● ● ● ● ● ● ● ● ● ● ● ● ● ● ● ● ● ● ● ● ● ● ● ● ● ● ● ● ● ● ● ● ● ● 0 5 10 15 20 25 30 Footprint SD [da ys] ● ● ● ● ● ● ● ● ● ● ● ● ● ● ● ● ● ● ● ● ● ● ● ● ● ● ● ● ● ● ● ● ● ● ● ●
AAa AIa ALb APa ATa AXa BAa BEa BGa ABa AMa AYa BDa BKa AQa AWa BLa AFa AJa AOb AEa ALa ANa ASa AVa AZa BBa BFa BIa ACa ARa BCa BJa AHa AUa BHa ADa AGa AOa BMa
GCT 1 GCT 2 GCT 3 GCT4
● ● RD 2010 MD 2010 RD 2011 MD 2011
TCD
6, 563–591, 2012Inferring snow pack ripening and melt
M.-O. Schmid et al.
Title Page
Abstract Introduction
Conclusions References
Tables Figures
◭ ◮
◭ ◮
Back Close
Full Screen / Esc
Printer-friendly Version Interactive Discussion
Discussion
P
a
per
|
Dis
cussion
P
a
per
|
Discussion
P
a
per
|
Discussio
n
P
a
per
|
●
●
●
● ●
● ●
●
●
●
●
●
●
●
●
●
●
●● ●
●
●
● ●
● ●
●
●
●
●
●
●
●
●
●
●
●
melt out date 2011
melt out date 2010
15.Apr
il
15.Ma
y
15.J
une
15.J
uly
15.April 15.May 15.June 15.July Fitted Trend
Equal Timing
TCD
6, 563–591, 2012Inferring snow pack ripening and melt
M.-O. Schmid et al.
Title Page
Abstract Introduction
Conclusions References
Tables Figures
◭ ◮
◭ ◮
Back Close
Full Screen / Esc
Printer-friendly Version Interactive Discussion
Discussion
P
a
per
|
Dis
cussion
P
a
per
|
Discussion
P
a
per
|
Discussio
n
P
a
per
|
F
ootpr
ints
Mean ACa AEa AFa AHa ALa AMa AQa AUa AWa BCa BHa BJa BLa BMa
15.April 15.May 15.June 15.July 2011
2010
2011 2010
TCD
6, 563–591, 2012Inferring snow pack ripening and melt
M.-O. Schmid et al.
Title Page
Abstract Introduction
Conclusions References
Tables Figures
◭ ◮
◭ ◮
Back Close
Full Screen / Esc
Printer-friendly Version Interactive Discussion
Discussion
P
a
per
|
Dis
cussion
P
a
per
|
Discussion
P
a
per
|
Discussio
n
P
a
per
|

![Table 2. Parameters of the inter-footprint analysis for the MD model [3] as well as adjusted R 2 and p-value](https://thumb-eu.123doks.com/thumbv2/123dok_br/18349820.352925/22.918.683.894.83.673/table-parameters-inter-footprint-analysis-model-adjusted-value.webp)