METHODS OF IMPROVEMENT OF QUANTITATIVE TRAITS IN PIG BREEDING AND
THEIR EFFICACY IN POLISH CONDITIONS
Tadeusz Blicharski*, Marian Różycki**, Anna Hammermeister**
*IGiHZ PAN w Jastrzębcu, PZHiPTCH „POLSUS” **IZ-PIB Balice k. Krakowa
*** PZHiPTCH „POLSUS”
Improvement of animals based on breeding work is a set of activities aiming to obtain individuals with fi xed and desired traits. It is not possible to explicitly defi ne the best traits even in commercial pig breeding because there are different priorities in the expected levels of performance for different traits. Improvement trends differ between breeders and often change depending on consumers preferences.
In pig breeding work we often deal with improvement of polygenic traits determined by many genes. The possibilities of selection based on simply-inherited traits determined by single or a few genes were long and almost completely depleted. These are so called qualitytraits and are very often connected with color. These traits are slightly or not at all infl uenced by environment. Traits determined by many genes with constant genetic variability, phenotypically regarded as quality (zero-one) traits, are also economically important. These are so called threshold traits. In pig breeding the example of threshold trait is disease resistance to acute diseases ending with death or survival without middle stages. It is usually a special body feature that makes it impossible for the disease to develop although pathogen entered the body. These traits are considered as threshold traits because when exceeding the threshold of own genes they cause fundamental changes in phenotype. In case of pigs the example of the threshold trait is piglets resistance to oedema disease which is determined by a single gene – mutation in gene FUT1. Usually these types of traits are polygenic.
However the most important pig performance traits belong to the group of quality traits and their improvement is the most important part of almost all breeding programs. The easiest and most effective is the improvement of traits that are determined by genes in a simple way. Then the breeder concentrates on identifying individuals with desired genotypes and after selection keeps them for further breeding. Such situation is unusual because straight majority of traits are determined by many genes. In such case selection of the best genotypes is impossible and breeding decisions are taken based on animals performance value or even better if it is based on animal breeding value.
Genetics of quantitative traits is based on the basic genetic model presented in the following equation: P = µ + G + E P – phenotypic or performance value of given trait in individual animal
µ - average phenotypic value of all animals in the population G – genetic value of given trait in individual anima
E - infl uence of environmental factors on performance of individual animal
The average phenotypic value in the population is the most important value while G and E are deviations from the population average and are relative values. When selecting the best individuals for parents of the next generation we should above all take under consideration their genetic value. However breeders in practice are dealing with performance traits which level depends on combination between genotype and environment. Improvement of animals traits is possible only when there is trait variability. Breeding work is effective under condition that not only phenotypic value of important traits has been improved but also their genotype improved. Breeders are not able to directly evaluate genotype of the individual animal so they are evaluating genotype based on phenotype of the animal and phenotype of its relatives. Interdependence between genotypes of evaluated animals is equal to their coeffi cient of relationship. Correlation between phenotype and genotype of individual animal is equal to h, that is a square root of heritability of given trait h2 (√h2).
animal and phenotypic value of its father equals 0,5 h2 and correlation - 0,5 h. In order to evaluate breeding value of individual animal based on phenotypic values of its relatives we are using product of coeffi cient of correlation, between genotype of evaluated animal and a single relative, and a value obtained from the following equation : √(n/(1+(n-1)Rgh2)), Rg is a coeffi cient of relationship between evaluated animal and its relatives contributing to animals’ evaluation.
Coeffi cient of regression between breeding value of individual animal and average value of phenotypic values of its
relatives is expressed with the following equation: . Based on the presented equations we can estimate correlation and regression between breeding value of individual animal and phenotypic value of its relatives. The values of estimated coeffi cients of correlation and regression are highly infl uenced by heritability coeffi cient of given trait – h2 and number of evaluated relatives.
Taking under consideration above information we can claim that in case of highly heritable traits the most accurate evaluation is based on animal own phenotypic value and in case of low heritable traits the accuracy of evaluation increases when based on relatives performance (progeny is the best).
In pig breeding traits that are being improved belong to the 3 main groups: reproduction performance, fattening and slaughtering performance. The main goal of breeding work is improvement of pure breeds. The next step after obtaining positive results from the fi rst phase is selection of proper animals for mating. This goal has to be taken under consideration already in the fi rst phase of breeding work when selection directions for different breeds and their genetic identity are diversifi ed. The basic tool in reproduction works and pig production is commercial crossing.
Commercial crossing is successfull in Poland thanks to having sire and dam lines and breeds that have the following features:
Dam component:
- High reproduction performance, - High daily gain,
- The best feed conversion possible to obtain, - Good musculature,
- stress resistant. Sire component:
- High daily gain,
- High lean meat and good quality meat - The best feed conversion possible to obtain - Stress resitant (not for all breeds);
Market demands contributed to defi ning general breeding goal that includes goals for all breeds: the aim is to produce as much meat as possible at the lowest possible cost. This goal includes lowering of fatteners production costs, improving sows’ prolifi cacy, improving daily gain and lean meat content up to 55% and preserve good quality meat at the same time.
Here are the target performance values of the most important maternal traits: 1. Number of alive born piglets 12
2. Number of piglets at 21 days 11 3. Age at fi rst farrowing 340 days 4. Prolifi cacy 23 5. Number of teats 14 6. Period between litters 160 days 7. Daily gain 680 g
Here are the target performance values of the most important paternal traits:
1. Lean meat percentage duroc, hampshire 61%, pietrain, Belgian landrace 63%. 2. daily gain 850 g
3. Feed conversion 2,5 kg
4. Free from gene RYR1T mutation genotype RYR1NN 5. Number of teats 14
In order to obtain the target performance values and to confi rm them with animals breeding value it is necessary to go through all stages of breeding work. Below there is a scheme of basic elements of breeding work, obtained phenotypic progress and degree of completion of the breeding goal.
EVALUATION
METHODS OF BREEDING WORK
SELECTION MATING SCHEME
1On farm test (on alive animals)
2.Station test (SKURTCh)
3. BLUP – animal model
4. Identification of stress gene polymorphism (RYR1)
Index and BLUP of on farm test for: a) dam breeds gilts b) dam breeds boars c) sire breeds gilts d) sire breeds boars
2.Index and BLUP of station test:
a) boar index(*)
b) mating index(*)
(*) target BLUP
3. Meat quality parameters: pH, WHC, color L*a*b*, IMF
4.BLUP indexes: - for fattening, slaughtering and reproduction
performance - for test station parameters
Individual mating scheme with special computer software
Table 1. Phenotypic progress in reproduction performance traits obtained in the period 1996 – 2007 for dam and sire* breeds
* for pietrain since 1997
Productivity Number of piglets at 21
days
Prolificacy Period between litters, days
Age at first farrowing, days
Polish Large
White (plw) + 0,29 + 0,15 + 1,75 - 13,0 - 6,0
Polish
Landrace (pl) + 0,26 + 0,35 + 1,9 - 14,0 - 1,0
pulawska - 0,43 - 0,43 + 0,25 - 11,0 - 2,0
duroc + 0,75 + 0,77 + 2,25 - 7,0 - 10,0
hampshire + 1,35 + 1,39 + 3,26 - 6,0 - 33,0
pietrain* + 0,07 + 0,2 + 1,42 - 11,0 + 1,0
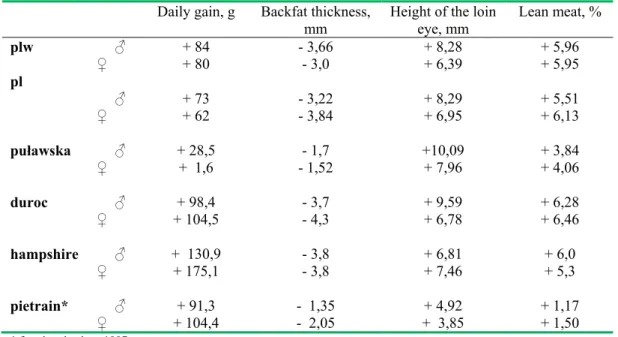
Table 2. Phenotypic progress in fattening and slaughtering performance obtained in the period 1996 – 2007 for boars and gilts of dam and sire* breeds
Daily gain, g Backfat thickness,
mm Height of the loin eye, mm Lean meat, %
plw � + 84 - 3,66 + 8,28 + 5,96
� + 80 - 3,0 + 6,39 + 5,95
pl
� + 73 - 3,22 + 8,29 + 5,51
� + 62 - 3,84 + 6,95 + 6,13
pu�awska � + 28,5 - 1,7 +10,09 + 3,84
� + 1,6 - 1,52 + 7,96 + 4,06
duroc � + 98,4 - 3,7 + 9,59 + 6,28
� + 104,5 - 4,3 + 6,78 + 6,46
hampshire � + 130,9 - 3,8 + 6,81 + 6,0
� + 175,1 - 3,8 + 7,46 + 5,3
pietrain* � + 91,3 - 1,35 + 4,92 + 1,17
� + 104,4 - 2,05 + 3,85 + 1,50
Table 3.Degree of completion of breeding goal for sire breeds
TRAIT TARGET VALUE EVALUATION RESULTS
2007 DEGREE COMPLETION OF OF BREEDING GOAL
Lean meat, % 61 duroc 61 hampshire 63 pietrain
60,1 61,5 63,3
98,5% 100,8% 100,5% Daily gain, g 850 duroc
850 hampshire 850 pietrain
706 717 676
83,1% 84,4% 79,5%
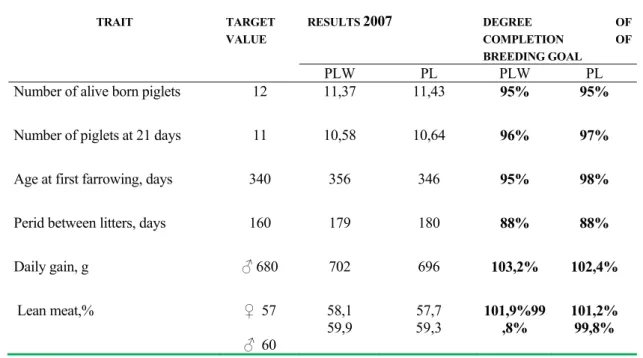
Table 4. Degree of completion of breeding goal for dam breeds
TRAIT TARGET
VALUE
RESULTS 2007 DEGREE OF
COMPLETION OF
BREEDING GOAL
PLW PL PLW PL
Number of alive born piglets 12 11,37 11,43 95% 95%
Number of piglets at 21 days 11 10,58 10,64 96% 97%
Age at first farrowing, days 340 356 346 95% 98%
Perid between litters, days 160 179 180 88% 88%
Daily gain, g � 680 702 696 103,2% 102,4%
Lean meat,% � 57
� 60
58,1
59,9 57,759,3 101,9%99,8% 101,2% 99,8%
In the National Breeding Program in the recent years there was a great pressure put on improving fattening and slaughtering performance. Improvement of fertility and prolifi cacy was not the priority lately. Changes in the program were necessary in order to improve traits, which values were far behind results obtained in other EU countries. Such situation made Polish pigs less competitive on the common market. The level of fertility and prolifi cacy performance was satisfying and improvement of their genetic background would not be successful without improvement of environmental conditions at the same time, which was limited due to breeders poor investment capabilities. After obtaining high level of fattening and slaughtering performance we can fi nally treat reproduction performance as a priority.
with high daily gain and lean meat percentage. In case of sire breeds it is legitimate. But in case of dam breeds it is not the best solution because it favors pigs from less numerous litters that grow the fastest. This error is partially eliminated by the fact that there are more pigs from more numerous litters. What is more, in breeding practice there is a threshold selection that puts up minimum performance standards, including reproduction performance, for individuals of each breed.
In case of improvement of fattening and slaughtering traits the simple selection index has been used for a very long time. High heritability of these traits and high estimation accuracy created the possibility to obtain phenotypic and genetic progress. Taking under consideration the importance of fattening and slaughtering traits and the necessity to improve them as fast as possible the BLUP method was introduced into breeding practice in Poland in 1998. A few years before introduction of BLUP method the system of data processing was developed and tested. Thanks to the system it was possible to collect all the data and information essential for BLUP calculations. Breeding value for fattening and slaughtering performance has been estimated based on the results obtained from on the farm test. The background for fattening and slaughtering performance calculations is a period of 6 months. That means that breeding value of individual animals is related to the average estimated based on results of all animals evaluated in the last 6 months. Calculations take place in National Research Institute of Animal Production on monthly basis for each breed.
Described model enables to calculate breeding values for animals from all over the country. The infl uence of permanent factors like: gender, piggery, circle and random factors such as litter and individual effect have been included in the model.
y = Xsas + Xpap + Xhah + Zmm + Zaa + e where:
y – is an observation vector as – vector of circle effects ap – vector of gender effects
ah – vector of breeding effects, m – vector of litters effect a – vector of individuals effects e – error vector
XS – incidention matrix for the circle Xp – incidention matrix for gender Xh – incidention matrix for breeding Zm – incidention matrix for litters Za – incidention matrixfor individuals
Each month calculations give us estimated breeding values for daily gain H(PD), carcass lean meat H(PM) and selection index H(IN) for boars and gilts of all breeds tested on farms and boars for mating and sows that progeny was tested on the farm. Obtained results are shown in the way that enable us to know what is the breeding value of the boar now and how it has changed on the background of every month calculations. It is a very important information based on which we can make a decision about the future of the boar that is if we want to keep it or eliminate from breeding.
Sows results are presented in the same way as boars results. In case of sows we are able to trace how the breeding value of individual animals estimated based on tested progeny has been changing in time.
Works over introduction of BLUP method for estimating reproduction traits were initialized in 2004. The fi rst step was a development of methodological principles to change evaluation rules. Methodology of data fl ow, data base and its manual, were created. It was necessary to introduce changes in the methodology of data base in order to make it easier accessible and easier to update more frequently. We had to develop and install data fi lter system to minimize the risk of errors and mistakes.
In 2005 BLUP method started being used for reproduction traits – number of alive born piglets and number of piglets at 21 days of age. Data base for estimating breeding value of reproduction traits has a growing trend. Breeding value is standardized for the next litter and calculations are done on 2-weeks basis. Breeding value for 2 traits has been estimated according to the following equation:
where:
Y – observation vector for given trait
X1, X2, X3 – incidention matrixes for permanent factors b1 – vector of permanent effects in the year
b2 – vector of permanent effects for litters
b3 – vector of permanent effects for a piggery (number of area is included in the piggery number)
Z – incidention matrix for an individual effects
a – vector of breeding values of estimated individuals
e – vector of random errors
Breeding values for reproduction traits have been estimated since 2007 but the results were not universally available. They were used to development of data base and methodology for data processing before introducing more advanced BLUP system for estimating overall BLUP breeding value. It is the best solution for the effective breeding work. In 2007 National Research Institute of Animal Production a team ran by professor Marian Różycki developed overall BLUP models for selection of different breeds. Overall BLUP models were introduced into practice at the beginning of 2008 in cooperation between Institute and POLSUS specialists.
Radical diversifi cation of selection in dam and sire breeds has been introduced. Dam breeds are selected in the direction of improvement of reproduction performance. The highest pressure has been put on number of piglets at 21 days of age. This trait is highly correlated with prolifi cacy and carries lower error risk. Improvement of other traits in this model will be less intensive. It was recognized that lean meat in dam breeds has reached the level high enough and the rate of improving that trait might be lowered. Growth rate has been declared as more important trait for pig producers and highest pressure on selection of this trait has been put in the selection process.
Selection criteria for sire breeds are more balanced and 70% of selection pressure is put on fattening and slaughtering traits while still improving reproduction traits at the same time.
Effi cacy of reproduction performance estimation
Reproduction performance estimation is ran on the farm and has no other alternative. Breeding work aiming toward improvement of reproduction performance for many years was based only on herd management without using selection and evaluation methods. That was the main reason why it did not result in proper breeding progress, especially when we keep in mind that reproduction traits are of low heritability. It was necessary to develop methodology of reproduction performance estimation. Genetic parameters were estimated and their values were on a proper level for these traits. The lowest value of heritability coeffi cient was obtained in all breeds in the number of alive born piglets. For plw h2 for this trait was = 0,115, for Polish landrace it was similar. Obtained value is similar to results obtained in other breeding programs and scientifi c publications and enables implementation of breeding value estimation of this group of traits with BLUP method.
Effi cacy of fattening and slaughtering performance estimation
Fattening performance is estimated based on weighing boars and gilts once and then calculating their average daily gain since the day of birth till the day of estimation. Genetic parameters of this trait in the population and especially its heritability coeffi cient (h2) show how accurate our estimation is and whether it is useful in the breeding work. To analyze this parameter plw breed was used. Sire breeds have relatively low number of animals and not a lot of pure breed animals are estimated. In case of Polish landrace imported boars have the great infl uence on the population. Lack
Table 5. Fattening and slaughtering performance values of boars and gilts in 2005 („POLSUS” data). Number of
animals Age at the day of evaluation
Weight at the day of evaluation
Standardized
daily gain Average backfat thickness
Height of
loin eye Leanmeat % Index
boars X 5 934 Sd V% 174 14 8,1 114 13 11,7 674 87 12,8 9,6 1,8 18,8 53,6 5,1 9,5 58,3 2,5 4,4 106 16 15,2 gilts X 24 720
of results of own performance calculated using Polish methodology is the main reason why reproduction performance calculation is biased with errors. Daily gain and fattening and slaughtering parameters for plw boars and gilts obtained in 2005 are presented in the table below.
In order to analyze what are the possibilities of success in breeding work it is necessary to know all genetic parameters of given population. Below you can fi nd basic genetic parameters estimated for results of plw boars on alive animals in the period 1996 – 2004. In this period the methodology of estimation was stable. Changes introduced into estimation methodology in 2005 make it hard to compare obtained results.
Table 6. Results and values of heritability of fattening and slaughtering performance of plw boars obtained in the on farm test in the period 1996-2004 (National Research Institute of Animal Production)
Number Age at the
day of
evaluation
Weight at the day of evaluation
Standardized
daily gain Average backfat
thickness
Height of
loin eye Leanmeat % Index
boars X 35
223 Sd V% h2 179 13 7,1 0,31 113 12 11,6 0,18 636 65 10,2 0,18 11,0 2,2 19,9 0,20 49,7 5,4 10,8 0,09 57,6 2,3 4,0 0,18 122 15 14,6 0,18
Presented parameters are lower than those that can be found in the literature. But we should remember that data was collected in a very long time by a lot of people measuring animals which had a negative infl uence on the accuracy. To sum up we should state that trait heritability coeffi cient h2 = 0,2 gives a possibility to conduct successful selection. As an example we can use dairy cattle and huge progress, obtained through indirect selection of bulls, in its milk yield with heritability coeffi cient h2 = 0,18.
Estimation of breeding values should give us as much information as possible about animals genetic value of given trait. Different sources of information about performance value like: own performance, ancestors performance, full siblings performance, other relatives performance and progeny performance give us a chance to improve accuracy of estimated performance value.
Table 7. Examples of evaluation accuracy according to the information source (Strabel 2005) Source of information Evaluation accuracy
h2 = 0,10 h2 = 0,3 h2 = 0,5
1.Parents 0,39 n.n. 2.Own phenotype 0,32 0,55
3.Average of 5 full sibblings 0,32 0,48 4.Average of 10 half sibblings 0,23 0,33 5.Average of 5 progeny 0,34 0,54 6.average of 10 progeny 0,45 0,67 7.Average of 100 progeny 0,85 0,94 8.Average of 3 observations of the individual animal 0,67
Heritability coeffi cient has a direct infl uence on estimation accuracy. E.g. estimation of a trait with low h2 (0,10) based on 10 progeny is less accurate than estimation of a trait with higher h2 (0,3) based on animals’ own performance. So heritability coeffi cient determines the method of estimation and selection.
In general selection based on parents and siblings performance has rather low opinion. The highest selection accuracy belongs to estimation based on progeny performance because breeding value is a capability to pass genetic assumptions to the progeny.
Knowing genetic parameters it is possible to set an equivalent of number of progeny based on which the individual will be estimated in order to obtain the same results as based on individual own performance.
H = √ n/n + a that gives n = 4 – h2/1-h2
For traits with heritability coeffi cient h2 = 0,30 progeny testing is sensible when done on at least 5 animals. If we do not have at least 5 progeny then estimation based on own performance is more important. If trait heritability coeffi cient h2 = 0,1 progeny testing is sensible when done on at least 4 animals. In the national breeding practice we assumed that minimal number of 8 progeny tested in test stations gives proper estimation accuracy.
Young animals are estimated based on own performance in range of fattening and slaughtering traits. In the table above you can fi nd heritability coeffi cients for on farm performance test. Estimation based on the results of on farm test is more accurate when introducing results standardization for age and body weight. Apart from results of growth rate estimation the highest accuracy is also presented by PIGLOG 105 backfat thickness measurements. Backfat thickness measurements have pretty high accuracy. In national research on backfat thickness measured with ultrasound on breeding animals obtained results were very diverse. Dawidek (1991) stated that for plw and Polish landrace heritability coeffi cients for backfat thickness were h2 = 0,221 and h2 = 0,085, and Eckert (1995) stated that it was h2 = 0,320 and h2 = 0,277 respectedly. Presented results prove high usefulness of ultrasound measurements in breeding work.
Below you can fi nd genotypic correlation coeffi cients between results of tissues thickness PIGLOG 105 measurements and results of caliper measurements taken after slaughtering and lean meat percentage determined based on dissection.
Table 8. Genotypic correlations between tissues thickness measured with PIGLOG 105 and with caliper after slaughtering and lean meat percentage.
Parameters Coefficients of correlation PIGLOG 105 – backfat thickness over the last rib
PIGLOG 105 – backfat thickness over 13/14 rib PIGLOG 105- loin thickness
- 0,72 - 0,71 0,36 Caliper – backfat thickness over the last rib
Caliper – backfat thickness over 13/14 rib Caliper – loin thickness
- 0,90 - 0,90 - 0,83
Evaluation of completed and expected breeding progress
Breeding progress is breeders success in each generation of breeding animals if their performance is higher than performance of their parents. It is a difference between values of the same trait in two consecutive generations. Breeding progress is the effect of selection causing positive changes in progeny genes frequency comparing to their parents. Boar and sow have their progeny in a few following years. Genotype of their progeny might not signifi cantly change in the following litters and that it is why we should use the model of estimation according to following years in the analysis of pig breeding progress. So in Polish pig breeding it is the best to calculate breeding progress based on the time unit – generation gap or the year. Nucleus boars give progeny in a few following years that is why selection differential is regarded as a performance differential of the most important boars traits in following years. In a result the infl uence of sows and boars replacement is compensated.
Breeding work over plw breed was used as a model example. In the table below you can fi nd boars replacement percentage in nucleus herds.
Replacement percentage of plw nucleus sows is lower and stays on approximately 30%.
In previous years in plw breed certain progress in phenotypic values of fattening and slaughtering performance has been obtained (analysis in results discussion). Methodology which did not include traits standardization was the reason of decreasing the growth rate. It is clearly visible in table 10 where presented lean meat % was estimated based on phenotypic selection differential.
Trend = 59,1 - 56,7 = 2,4
Average yearly trend = 2,4/8 = 0,3
Trend of replacement boars = 59,5 - 56,6 = 2,9
Table 9. Number of estimated boars. Year of
estimation Number of estimated boars Number of nucleus boars Number of new boars Replacement %
1996 8401 434 – –
1997 8448 398 197 49,5
1998 8923 389 189 48,6
1999 6182 377 173 45,9
2000 5429 333 147 44,1
2001 5150 329 162 49,2
2002 5478 329 158 48,0
2003 4841 306 159 52,0
2004 3951 293 137 46,8
Total 56801 354(*) 165(**) 46,7
(*) average number of nucleus boars in given year
(**) average number of new boars introduced in the given year
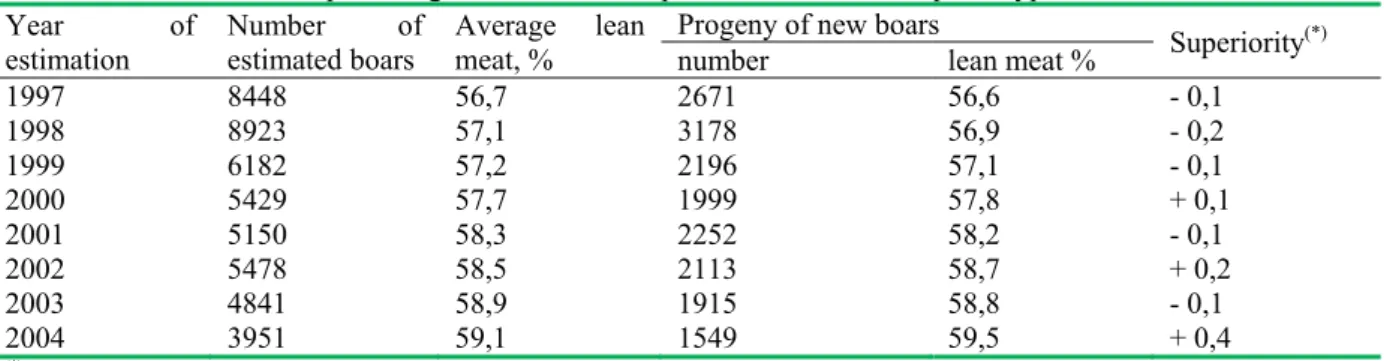
Table 10. Boars lean meat percentage estimated in the period 1997-2004 and phenotypic selection differential Year of
estimation Number estimated boars of Average lean meat, % Progeny of new boars number lean meat % Superiority(*)
1997 8448 56,7 2671 56,6 - 0,1
1998 8923 57,1 3178 56,9 - 0,2
1999 6182 57,2 2196 57,1 - 0,1
2000 5429 57,7 1999 57,8 + 0,1
2001 5150 58,3 2252 58,2 - 0,1
2002 5478 58,5 2113 58,7 + 0,2
2003 4841 58,9 1915 58,8 - 0,1
2004 3951 59,1 1549 59,5 + 0,4
(*) X general in the given year – X New boars introduced into the herd in the given year
The product of difference between trait genotypic values in generations and coeffi cient of heritability is presented in the table below.
Δh = DS * h2
DS = difference between trait genotypic values in two consecutive generations. h2 = heritability coeffi cient.
h2 for daily gain = 0,18, h2 for lean meat = 0,18
Results presented above clearly show that breeding progress has been obtained. It is considered that 1% of breeding progress for a trait is a good result. In 2005 breeding progress in growth rate was 1,8% and for lean meat -0,3%. It is a result of a new selection index designed for dam breeds. This index consists of 60% for growth rate and 40% for lean meat%. Keeping high rate of breeding progress could lead in 2012 to very high or even too high levels of selected
Table 11. Results of plw boars performance obtained in 2005 and results of plw boars introduced into the herd in 2005 and giving progeny in 2006.
Number of animals,
variability Daily gain g Lean meat % Boars evaluated in 1995 n = 5934
SD 674 87 58,3 2,5
Selected boars n = 345
SD 743 89 59,3 2,2
Estimated completed
slaughtering and fattening traits for dam breeds. That is why total BLUP model including fattening, slaughtering and reproduction traits, has been introduced into breeding practice. Correlation between slaughtering and reproduction traits is negative so we should expect slower rate of breeding progress in case of lean meat %. It is proper situation for plw breed which is a dam breed with high reproduction performance and fattening and slaughtering performance is on a second place.
Desired breeding progress
Breeding goal is to obtain progeny with higher value of selected trait or traits than the average value in parents’ generation.
Estimation of expected progress is important to estimate the accuracy of selection, accuracy of estimation and intensity of herd replacement expressed as a distance between generations.
Δg = i * rip * δAAA * / T - i = selection intensity - rip = breeding value accuracy - δAAA = additive genetic variability - T = distance between generations Δgp = for plw boars growth rate.
Δgp = (((743-674)/87) * 0,424 * 36,888) / 2,5 Δgm = for plw boars lean meat.
Δgm = (((59,3-58,3)/2,5) * 0,424 * 0,45) / 2,5 Δgp + Δgm / T + T = Δg (total)
Δg (total) = 0,998 %
The average expected breeding progress usually is not higher than 2%. In the process of realization of breeding program there is a negative infl uence of environmental factors that limit free mating and other complication. That is the main reason why completed breeding progress usually do not exceed 1%. It is low especially when level of population performance is high. In case of National Breeding Program for plw breed (boars) the expected breeding progress based on current information was Δg (total) = 0,998 %. It is a good result. Breeding Progress might be increased by: - shortening generation distance
- improving estimation accuracy and as a result improving genetic parameters like heritability.
- conducting more intensive selection. Selection differential for daily gain is i = 0,793 and shows that selection in the population is 50%.
In fact selection was even more intensive – 345/5934 * 100% = 5,81 % , and that means standardized selection differential is approximately 2,06. Reaching such high selection intensity is hinder by small number of herds free from diseases which limits genetic fl ow. Breeding progress might be obtained when using for next generation animals that differ from the population for at least 1 SD. There are at least 16% of such individuals in the herd.
Data analysis clearly show that there are possibilities to increase breeding progress rate by using all estimation results and by better choosing boars for replacement.
Progress can be increased if we use all available breeding tools.
Table 12. The value of selection differential expressed in standard deviation units according to percentage of herd left after selection (L. Lush, 1961)
% left after selection Selection differential % of herd left after selection Selection differential 90
80 70 60 50 40 30
0,20 0,35 0,50 0,64 0,80 0,97 1,16
20 10 5 4 3 2 1