www.geosci-model-dev.net/8/341/2015/ doi:10.5194/gmd-8-341-2015
© Author(s) 2015. CC Attribution 3.0 License.
Testing the performance of state-of-the-art dust emission schemes
using DO4Models field data
K. Haustein1, R. Washington1, J. King1, G. Wiggs1, D. S. G. Thomas1, F. D. Eckardt2, R. G. Bryant3, and L. Menut4 1School of Geography and the Environment, University of Oxford, Oxford, UK
2University of Cape Town, Environmental and Geographical Science, Cape Town, South Africa 3Department of Geography, University of Sheffield, Sheffield, UK
4Laboratoire de Météorologie Dynamique, Ecole Polytechnique, Palaiseau, France Correspondence to: K. Haustein ([email protected])
Received: 4 August 2014 – Published in Geosci. Model Dev. Discuss.: 3 September 2014 Revised: 19 January 2015 – Accepted: 23 January 2015 – Published: 19 February 2015
Abstract. Within the framework of the Dust Observations for Models (DO4Models) project, the performance of three com-monly used dust emission schemes is investigated in this pa-per using a box model environment. We constrain the model with field data (surface and dust particle properties as well as meteorological parameters) obtained from a dry lake bed with a crusted surface in Botswana during a 3 month period in 2011. Our box model results suggest that all schemes fail to reproduce the observed horizontal dust flux. They overes-timate the magnitude of the flux by several orders of magni-tude. The discrepancy is much smaller for the vertical dust emission flux, albeit still overestimated by up to an order of magnitude. The key parameter for this mismatch is the sur-face crusting which limits the availability of erosive material, even at higher wind speeds. The second-most important pa-rameter is the soil size distribution. Direct dust entrainment was inferred to be important for several dust events, which explains the smaller gap between modelled and measured vertical dust fluxes. We conclude that both features, crusted surfaces and direct entrainment, need to be incorporated into dust emission schemes in order to represent the entire spectra of source processes. We also conclude that soil moisture ex-erts a key control on the threshold shear velocity and hence the emission threshold of dust in the model. In the field, the state of the crust is the controlling mechanism for dust emis-sion. Although the crust is related to the soil moisture content to some extent, we are not as yet able to deduce a robust cor-relation between state of crust and soil moisture.
1 Introduction
Atmospheric mineral dust is the dominant aerosol species in terms of mass (Andreae, 1996; Textor et al., 2006), yet it is one of the major sources of uncertainty in the climate sys-tem (Forster et al., 2007; Boucher et al., 2013) despite recent efforts to reduce these uncertainties from a remote sensing (Ginoux et al., 2010, 2012; Ashpole and Washington, 2012; Brindley et al., 2012), physico-chemical (Redmond et al., 2010; Formenti et al., 2011), or modelling point of view (Huneeus et al., 2011; Knippertz and Todd, 2012; Klose and Shao, 2012). Numerical models are a key tool for predict-ing weather and climate. Given the interaction between min-eral dust and the climate system, e.g. radiation (Pérez et al., 2006), clouds (Bangert et al., 2012), and weather systems such as tropical cyclones (Evan et al., 2006), it is important for models to simulate the dust cycle well. Key elements of model dust emission schemes are largely based on empiri-cal data from wind tunnel experiments. Their emitted dust loadings have often been tuned to match global (Pérez et al., 2011; Huneeus et al., 2011) or regional (Laurent et al., 2006; Heinold et al., 2009; Haustein et al., 2012) satellite or in situ dust data (Holben et al., 1998; Remer et al., 2002; Kahn et al., 2005) rather than attending to the efficacy of the emissions in key regions. None of the currently existing schemes has been thoroughly assessed with field data at the scale of a numerical model grid box.
data tailored to regional climate model grid-box resolution (12 km×12 km) in order to test the performance of three dust emission schemes. These data have been obtained from a remote source area, Sua Pan, Botswana, undisturbed by background dust aerosol. In this paper we report on the char-acteristics of three emission schemes and quantitatively eval-uate their performance at process level.
Using a box model approach and DO4Models field cam-paign data from 2011, we first quantify the magnitude and frequency of the simulated dust emission fluxes by compar-ing them with observed fluxes at the field sites. Three state-of-the-art schemes are employed: Marticorena and Berga-metti (1995) (hereinafter MB95), the scheme of Alfaro and Gomes (2001) (AG01), and that of Shao (2004) (SH04). Sec-ondly, we examine the impact of three sand transport formu-lations upon the simulated dust fluxes: the models of Owen (1964) (OW64), Lettau and Lettau (1978) (LL78), and Mar-ticorena and Bergametti (1995) (which itself is based on White, 1979). These formulations predict a range of sand transport rates that vary by an order of magnitude and even-tually control the dust production of the model as discussed and illustrated in Shao (2008) (their Fig. 6.9) and Sherman and Li (2012) (their Fig. 4). Thirdly, we test the impact the input parameters have on the sandblasting mass efficiencyα
(vertical-to-horizontal mass-flux ratio) and the threshold fric-tion velocityu∗thr. The analysis is associated with an assess-ment of the box model performance as a function of surface roughness length, soil moisture content, and soil particle size distribution. The sensitivity of the simulated emission fluxes to observed soil and surface properties is discussed in the context of apparent model mismatches. Critical model com-ponents responsible for the discrepancies are identified.
The background to state-of-the-art dust emission schemes and an introduction of the observational data obtained during the field campaign are given in Sect. 2. The parameterisa-tions used in the newly developed box model are introduced in Sects. 3.1–3.3, including the model evaluation strategy (Sect. 3.4). We analyse the model performance in Sects. 4.1– 4.3 and discuss their implications in Sect. 4.4. Our findings are summarised in Sect. 5.
2 Background
The dust emission process is commonly described by three major mechanisms: dust emission by (1) aerodynamic lift, by (2) saltation bombardment (sandblasting), and by (3) dis-integration of aggregates (auto-abrasion) as illustrated in Shao et al. (2011b). Several parameterisation schemes have been developed to describe these mechanisms (e.g. Marti-corena and Bergametti, 1995; Shao and Lu, 2000; Alfaro and Gomes, 2001; Shao, 2004). See Darmenova et al. (2009) for a comprehensive review. Auto-abrasion is considered only by Shao (2004). Typically, each scheme parameterises the following quantities in separate steps or modules: (a) the
threshold friction velocity for particle movement, (b) the hor-izontal saltation flux (defined as the vertical integral of the streamwise particle flux density) which describes the mo-tion of saltating particles, and (c) the vertically emitted dust flux (defined as the emitted dust mass concentration per unit area and time) which determines the dust loading in the first model layer.
The threshold friction velocity, defined as the minimum friction velocity required to initiate the motion of soil grains, is specified over a smooth and dry surface (u∗dry), requir-ing a drag partition correction to account for roughness el-ements at the surface, and a moisture correction to reflect moisture content in the soil which acts to inhibit the emis-sions. The saltation flux is proportional to the shear veloc-ity, represented by a large array of parameterisation options (Sherman and Li, 2012). The smooth threshold friction ve-locity, the saltation flux as well as the vertical emission flux are also functions of the size distribution and chemical com-position of the soil particles (Kang et al., 2011).
Field data against which to test model output were gath-ered by the Dust Observations for Models (DO4Models) field campaign between 24 July and 14 October 2011. This cam-paign was focused on a 12 km2 measurement grid at Sua Pan in Botswana (20.55◦S and 25.95◦E). Sua Pan is one of
southern Africa’s most important aeolian dust source areas (Bryant et al., 2007) and, as part of the 3400 km2 Makgadik-gadi pan complex, it experiences ephemeral flooding of its surface (Eckardt et al., 2008). This flooding results in the de-velopment of a highly uneven polygonal salt crust of varying morphology and in various states of formation and degrada-tion. As such the crust presents a surface which is highly vari-able and dynamic in both roughness and erodibility (Nield et al., 2013, 2015), with subsequent impact on the distribu-tion of sites of aeolian dust emission. Such a surface presents a significant challenge for dust emission schemes as most are not explicitly developed for crusted surfaces as they can be found in many dust source regions worldwide (Nickling and Gillies, 1993; Rice et al., 1996; Ishizuka et al., 2008; Wash-ington et al., 2009). Sua Pan has been chosen for this field campaign because of its remote situation from other major sources, which allows for an undisturbed characterisation of the emitted dust, which is particularly relevant for the esti-mation of the vertical dust flux.
Our field measurement arrays consisted of 11 meteorolog-ical stations distributed throughout the grid located within zones of differing surface characteristics, as interpreted from remote sensing imagery (Fig. 1). Each station is identified by a label representing its relative horizontal (A–L) and ver-tical (1–12) position within the 12 km2 grid. Each site was equipped with an anemometer mast measuring wind velocity at heights of 0.25, 0.47, 0.89, 1.68, 3.18, and 6.0 m (AWS, MET/MET+ sites). Wind velocity data were averaged over a 1 min period to allow calculation of shear velocity (u∗) and
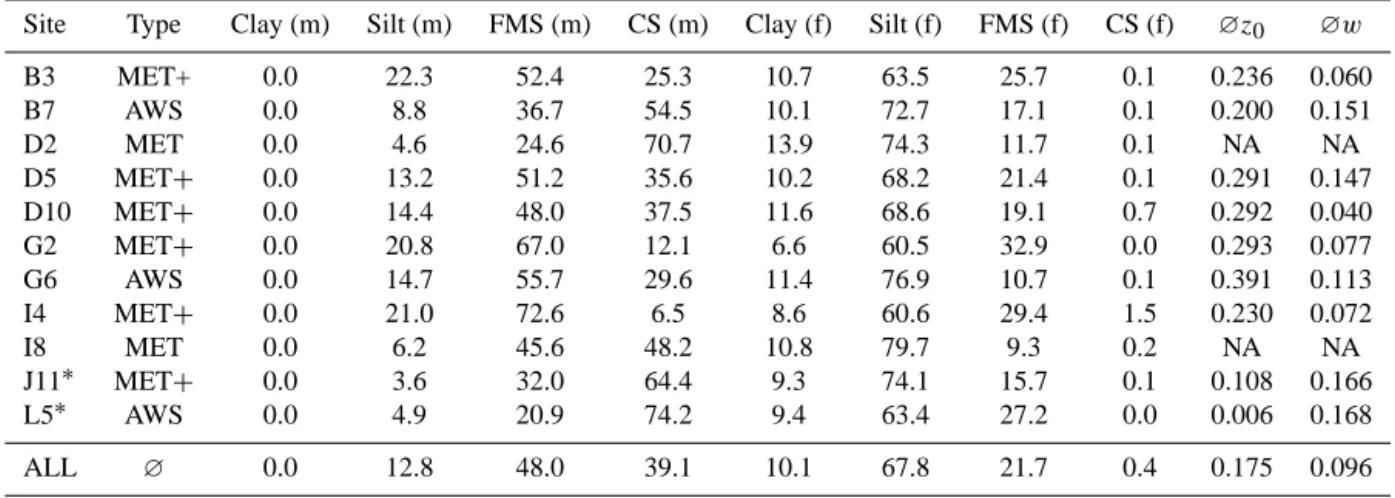
Table 1. Minimally and fully disturbed soil size distribution for each field site at Sua Pan. The mass fraction (in percent) for each parent
soil type is given. FMS is fine/medium sand and CS is coarse sand. (m) refers to minimally disturbed and (f) to fully disturbed soil. The non-emissive crust sample is used instead. The two right-hand columns are the average surface roughness (∅z0in cm) and soil moisture content (∅win m3m−3) at each site and averaged over the grid.
Site Type Clay (m) Silt (m) FMS (m) CS (m) Clay (f) Silt (f) FMS (f) CS (f) ∅z0 ∅w
B3 MET+ 0.0 22.3 52.4 25.3 10.7 63.5 25.7 0.1 0.236 0.060
B7 AWS 0.0 8.8 36.7 54.5 10.1 72.7 17.1 0.1 0.200 0.151
D2 MET 0.0 4.6 24.6 70.7 13.9 74.3 11.7 0.1 NA NA
D5 MET+ 0.0 13.2 51.2 35.6 10.2 68.2 21.4 0.1 0.291 0.147
D10 MET+ 0.0 14.4 48.0 37.5 11.6 68.6 19.1 0.7 0.292 0.040
G2 MET+ 0.0 20.8 67.0 12.1 6.6 60.5 32.9 0.0 0.293 0.077
G6 AWS 0.0 14.7 55.7 29.6 11.4 76.9 10.7 0.1 0.391 0.113
I4 MET+ 0.0 21.0 72.6 6.5 8.6 60.6 29.4 1.5 0.230 0.072
I8 MET 0.0 6.2 45.6 48.2 10.8 79.7 9.3 0.2 NA NA
J11∗ MET+ 0.0 3.6 32.0 64.4 9.3 74.1 15.7 0.1 0.108 0.166
L5∗ AWS 0.0 4.9 20.9 74.2 9.4 63.4 27.2 0.0 0.006 0.168
ALL ∅ 0.0 12.8 48.0 39.1 10.1 67.8 21.7 0.4 0.175 0.096
∗In a few cases the fluff material could not be sampled.
A
C
D
H I
E
F
B
G
Figure 1. The Sua Pan 12×12 km grid with three AWS sites (orange dots) and another eight MET/MET+ sites (yellow dots). Through combined use of a range of remote sensing data, three zones which allowed for a distinct interpretation in terms of crust types and potential for erodibility were selected. The colours in-dicate different soil conditions present throughout the campaign. Red: well-developed salt crust which would not be easily erodi-ble (A/B/G); green: intermediary salt crusts that were either not as well developed as in A, B and G or significantly less moist than in E, F and I; blue: relatively moist surfaces that were most likely to have been either re-set (dissolved/reworked) or degraded (partially dissolved/reworked) by recent flooding and dilute inflow. The rel-atively high moisture content of these surfaces would render them relatively non-erodible.
resolution data on sand saltation activity (within 5 cm above the surface) and BSNE (Big Spring Number Eight) dust traps (Fryrear, 1986) were positioned at heights of 0.25, 0.47, 0.89,
and 1.89 m to determine the average horizontal sediment flux over periods of 14 days. Data from the BSNEs allowed for the estimation of the integrated vertical flux and are used to convert the Sensit frequency data into a horizontal mass flux. At nine of the meteorological stations (AWS, MET+sites), DustTrak DRX aerosol monitors were installed at a height of 3.18 m to record concentrations of PM1, PM2.5, PM10, and PMtotparticles at 2 min temporal resolution. Thetaprobe moisture sensors were installed in the pan surface at each site to measure moisture content integrated across depths of 0–3 and 9–12 cm. Automatic weather stations were deployed at three AWS sites. Two CIMEL sun photometers were de-ployed inside (at the centre) and outside (upwind) of the grid in order to obtain the atmospheric aerosol optical depth (AOD) and the Ångström exponent. Finally, the threshold shear velocity for dust emission was assessed at 98 locations across the measurement grid using a Pi-SWERL wind tunnel (King et al., 2011), providing a potential dust source map for the grid.
Surface sediment at each site was sampled and returned to Oxford for grain size analysis using a Malvern laser granulometer. This was used in “wet” fully dispersed mode (assumed to represent the dust in suspension), and also in “dry” minimally dispersed mode using an air dispersion unit (which maintains and measures any particle agglomerates which might be assumed to comprise the saltation flux). The sediment sampled included the surface crust (0–0.5 cm thick, where present), a dry “fluff” layer often present beneath the crust (1–3 cm thick), and a deeper clay soil unit beneath (see Table 1).
observations. Observed gravimetric soil moisture content at 0–3 cm depth (w) which closely matches the soil moisture provided by atmospheric models in their uppermost soil layer is used. For the purpose of grid-wide box model comparison, we take the arithmetic mean values ofz0andwin 2011 (Ta-ble 1). Also, the minimally and the fully disturbed soil size distributions are used (Table 1). For the direct model com-parison, the shear velocity (u∗) is used. It is obtained
us-ing the measured wind profile data and the surface rough-ness data. The saltation flux QOBS is assumed to be pro-portional to the Sensit counts, calibrated using the BSNE data. The vertical distribution of the dust mass collected in the BSNEs follows an exponential function which is in good agreement with empirical considerations. The total vertical dust flux (FOBS) is estimated following the procedure of Gillette (1974) from the DustTrak concentration data in the following way:FOBS=(PMtot−PM2.5)·u′∗. PMtotis the
to-tal and PM2.5is the particulate matter smaller than 2.5 µm in diameter. The fluctuating component of the shear velocity is calculated asu′
∗=u∗−u∗, withu∗as the mean shear velocity
at each site during the campaign period. As we are interested in the positive dust flux,FOBSis considered as contributing emission flux only ifFOBS,t−FOBS,t−1> σ, withσ as the standard deviation ofFOBS. The time interval1tis 2 min for all parameters.
The deduced fluxes are not a direct flux measurement. Both QOBS andFOBS are subject to uncertainties. The un-certainty associated withQOBS is likely quite high relative to the value for most of the site measurements due to the very limited quantity measured by the BSNE during each collection interval. However, for the sites that experienced relatively higher amounts ofQOBS, this uncertainty is greatly reduced because more mass was collected at each collection interval to calibrate the Sensit record. TheFOBSuncertainty is rooted in the error of the DustTrak and the flux calculation methodology. The DustTrak used in this study has shown to have very small errors (∼10 %) for PM2.5values when com-pared with a TEOM and reasonable error (∼15 %) for PMtot when compared with a condensation particle counter (Wang et al., 2009). When combined with the high measurement fre-quency capabilities of the DustTrak, this instrument outper-forms most other nephelometers for PM10measurements and far exceeds the performance of aerosol optical particle coun-ters (Wang et al., 2009; Watson et al., 2011). The vertical dust flux calculation methodology will underestimate the to-tal dust flux when compared to theoretical estimates from a removal of both the PM2.5mass fraction and the very high-frequency wind fluctuations. This bias then minimises the likelihood of including dust emission fluxes that are only en-training PM2.5particles (at 3.18 m in height) or that are asso-ciated with smaller fluctuations inu∗. The former is of
mini-mal concern, as most dust emission mass fluxes from crusted surfaces contain a larger portion of PM10than PM2.5(Shao et al., 2011a). The latter bias does increase the uncertainty in the calculatedFOBSas it omits mechanisms such as dust
dev-ils that aerodynamically entrain dust particles through ther-mal instabilities. Although this is an important mechanism for dust uplift from crusted sources, it is not a process cap-tured by the dust emission schemes tested in this paper and therefore introduces minimal uncertainty in the comparative results.
Since no severe dust event could be observed in the course of the 2011 campaign period, difficulties arise in establish-ing a relationship betweenu∗ and the fluxes over a wider
range of values. We therefore cannot rule out an unexpected increase in the emission flux which deviates from theoreti-cal considerations. We have however high confidence in the identification of the emission signal resulting from specific wind events.
3 Box model development
This paper investigates a newly constructed set of box mod-els which can either be run with synthetic data to test the range of potential changes in dust emission due to individual model parameters, or which can be driven with observational data. Input parameters are the shear velocity (u∗), the
sur-face roughness (z0), the soil moisture content (w) and the mass size distribution of the soil (1Dp). Four parent parti-cle size populations are considered for all simulations (di-ameter range in parentheses): clay (0–2 µm), silt (2–50 µm), fine/medium sand (FMS; 50–500 µm), and coarse sand (CS; 500–1000 µm). They cover the typical size range and chemi-cal composition of dust particles in desert regions. In regional and global numerical dust models, these four populations are converted into soil texture classes (Tegen et al., 2002) in or-der to match the information provided by the global soil data sets (e.g. FAO-UNESCO, 1974; Zobler, 1986, 1999). 3.1 The Marticorena scheme
The MB95 emission scheme as implemented in the box model starts with the calculation of the semi-empirically de-rived threshold friction velocity over smooth surfaces (u∗dry) (Iversen and White, 1982; Greeley and Iversen, 1985). Re-quired input parameters are the air density (ρair), the soil particle density (ρp=2.5 g m−3for clay; 2.65 g m−3for the rest), and the median particle diameter (Dp). The exact em-pirical formulation foru∗dry(Dp)is given in box 1a in Fig. 1 in Darmenova et al. (2009).
The calculation of the threshold velocityu∗throver a rough surface with potentially wet soil conditions requires the ap-plication of a moisture (Fécan et al., 1999) (H) and rough-ness correction (MacKinnon et al., 2004; Marticorena et al., 2006) (R) foru∗dry:
u∗thr(Dp, z0, w)=
u∗dry(Dp)
R(z0)
with
R(z0)=1−
ln
z0
z0s
ln
0.7·
c
MB95/McK04
z0s
0.8
(2)
and
H (w)=
(
1+1.21·(w−w′)0.680.5
w > w′
1 w < w′. (3)
The roughness correction after MacKinnon et al. (2004) (McK04) was originally developed for vegetated terrain, but has the advantage of spanning a wider range of roughness values, which turns out to be important in our case, as dis-cussed in Sect. 4.2. The constant cMcK04 is assumed to be 122.5 m and the constantcMB95is set to 0.1 m (Marticorena et al., 2006). EithercMB95orcMcK04can be used in Eq. (2). Both corrections follow the concept of a drag partition be-tween mobile sand particles at the ground (smooth rough-ness z0s) and larger non-erodible roughness elements (ae-olian roughness z0). For a more detailed discussion on the concept of the characteristic roughness length scales, we re-fer the reader to Menut et al. (2013). We treat the local-scale roughness (smooth roughness) as 1/30 of the median diameterDpof the undisturbed coarse mode particles (Mar-ticorena and Bergametti, 1995). The moisture correction ap-plies in cases when the soil moisturewexceeds the threshold
w′=0.0014·(% clay)2+0.17·(% clay). The higher the clay content in the soil, the less likely dust production will occur under a given soil moisture content.
The sand transport model after White (1979) is used to ob-tain the streamwise horizontal saltation fluxQMB95(Dp).g is the gravitational constant andρairthe air density as before: QMB95(Dp)=CMB95·
ρair g ·u
3
∗·
1+u∗thr(Dp) u∗
· 1−u 2
∗thr(Dp)
u2
∗ !
. (4)
The correction factor CMB95 (used to adjust the saltation flux according to experimental results) was originally set to 2.61 (Marticorena and Bergametti, 1995) but later revised to 1.0 (Marticorena et al., 1997) which is why we adopted
CMB95=1.0 in our box model set-up.
Alternatively, the sand transport formulations after Owen (1964) (OW64) and Lettau and Lettau (1978) (LL78) are ap-plied for sensitivity test purposes.
OW64 considers the concentration and vertical distribu-tion of saltating grains in the saltadistribu-tion layer above the ground, making use of the grain size terminal velocityws.wsis deter-mined as a function of particle mass, diameter and the drag coefficient in consideration of different possible Reynolds regimes (Shao, 2008). The momentum flux is derived by re-lating upward and downward moving particles in the
salta-tion layer.C1andC2(empirical constants to specify the ra-tio betweenwsandu∗) have values of 0.25 and 0.33,
respec-tively (Sherman and Li, 2012):
QOW64(Dp)=
ρair g ·u
3
∗· 1−
u∗thr(Dp)2
u2
∗ !
·
C1+C2· ws u∗
. (5)
LL78 accounts for excess shear velocity relative tou∗thr. We use a factor of 6.7 forCLL78, and Drefis the reference grain size with a diameter of 250 µm as used in wind tunnel experiments (Bagnold, 1941).ρpis the soil particle density:
QLL78(Dp)=CLL78·
s
Dp
Dref ρp
g · u∗−u∗thr(Dp)
·u2∗. (6)
The integrated horizontal fluxGrelatesQMB95/OW64/LL78 to the relative surface area fractionSrel, which is the percent-age of soil grains with diameterDprelative to the total sur-face covered by soil particles. The minimally disturbed field soil sample size distribution is used in our case.
The integrated vertical mass fluxFMB95(Dp)in the case of the MB95 scheme is obtained by means of an empirical approach which assumes a constant sandblasting (mass) effi-ciencyαfor each size bin. We use values between 1×10⁻⁵ and 1×10⁻⁷cm−1 for the four corresponding parent soil types as suggested by Tegen et al. (2002). While this ap-proach reflects aggregate disintegration to some extent as the emitted particle size spectra shift towards smaller particles compared to the horizontal mass flux, only mobilised parti-cles (expressed in terms ofG) will eventually be emitted. We try to minimise this problem by weighing each of the four bins according to its fraction in the fully disturbed field soil sample (see Table 1). The resulting sum of the four bins then determines the totalα.
3.2 The Shao scheme
The SH04 emission scheme is a more physical approach. Shao (2004) relate the binding energy of the dust particles to the threshold shear velocity. Over smooth surfaces, Shao and Lu (2000) derivedu∗dry by adjusting the empirical ex-pression of Greeley and Iversen (1985):
u∗dry(Dp)=
s
AN·
ρp·g·Dp
ρair
+ Ŵ
ρair·Dp
. (7)
2006). The parameterAN is a dimensionless threshold fric-tion velocity which is expressed as a funcfric-tion of the particle Reynolds number Ret. The weak dependence upon Ret for dust particles led to a recommended factor of 0.0123 (Shao and Lu, 2000).
ForR(z0)in Eq. (1), a double drag partition scheme is proposed which treats bare and vegetated surfaces indepen-dently (Raupach, 1992; Raupach et al., 1993). In fact, it in-troduces a roughness density in terms of the frontal area cov-ered by the non-erodible roughness elements present at the surface. As there is no vegetation present, we simplify the scheme such that it only depends on β (ratio of the shear stress threshold of the bare erodible surface to the total shear stress threshold), σ (ratio of the basal to frontal area of the roughness elements), m (spatio-temporal variations of the underlying surface stress), and λ(z0)(roughness density of the non-erodible elements):
R(z0)=
s
1 1−m·σ·λ(z0)
·
s
1 1+m·β·λ(z0)
. (8)
Although a wide range ofβvalues has been measured de-pending on surface type (King et al., 2005), we adopt values from Raupach et al. (1993) forβas well asσandm(β=90;
σ =1;m=0.5). For λ(z0), we take the values (based on field measurements; Marticorena et al., 2006) given in Ta-ble 2 in Darmenova et al. (2009) according to our observedz0 values at each field site. ForH (w), a straightforward formu-lation based on wind tunnel experiments (Shao et al., 1996) as proposed by Zhao et al. (2006) is applied in the SH04 scheme as one choice:
H (w)=
(
e22.7·w w <0.03
e95.3·w−2.03 w >0.03 (9) The sand transport formulation based on the OW64 model (Owen, 1964) is used in the SH04 horizontal flux parameter-isation. The dimensionless constantCSH04can vary between 1.8 and 3.1 and is set to 2.45 in our experiments (Kawamura, 1964; Shao, 2008):
QSH04(Dp)=CSH04· ρair·u3∗
g ·
1−u∗thr(Dp) u∗
. (10) The integrated horizontal flux G relates QSH04 to the relative surface area fraction of each bin (denoted here as
pA(Dp)instead ofSrel). As for MB95, we use the size distri-bution of the minimally disturbed soil sample.
For the integrated vertical mass flux, Shao (2001) pro-posed a scheme that accounts for saltation bombardment and aggregate disintegration. We use the simplified version in-troduced by Shao (2004). The size range of particles emit-ted by saltation bombardment differs from that of saltating particles (those in the horizontal saltation flux). While SH04 specifies a certain size range, we keep the original size range
of the four parent soil types for saltating as well as sand-blasted particles. However, we account for the changing size range by applying the prescribed (i.e. observed) minimally (pm(Dpm)) and fully disturbed (pf(Dpf)) volume size
distri-butions. It is assumed that the undisturbed soil sample rep-resents the saltating particles, while the fully disturbed soil sample represents the smaller particles which control the ver-tical emission dust mass flux (and hence account for aggre-gate disintegration). If strong erosion occurs, the scheme acts to shift the soil particle size distribution towards the fully disturbed sample. Furthermore, the ratio of auto-abrasion is parameterised by the free-dust-to-aggregated-dust mass ra-tioσp=pm(Dpm)/pf(Dpf). The corresponding vertical flux
formulation is the following:
FSH04(Dpm, Dpf)=cγ·ηf(Dpf)·((1−γ )+(γ·σp))
·(1+σm)·
QSH04(Dpm)·g
u2
∗
. (11)
Here, γ is specified as γ=e−(u∗−u∗thr)3, while η
f(Dpf)
refers to the mass fraction of the dust particles having di-ameters less than 20 µm. We assume the mass fractions of the fully disturbed soil sample to be representative of that (it contains only clay- and silt-sized particles in most cases, as shown in Table 1). The parameterσmdepends onu∗, the
plastic pressurep of the soil surface and the bulk soil den-sityρb. Together withcγ, the latter two values are taken from Shao (2004) assuming sandy loamy soil conditions on aver-age at the field site. The flux of the individual bins is finally integrated over the entire particle size range.
3.3 The Alfaro scheme
Similar to Shao (2004), Alfaro and Gomes (2001) offer a more sophisticated scheme for the conversion of the horizon-tal flux into the vertical mass flux compared to MB95. How-ever, AG01 requires the calculation of the saltation mass flux as a prior condition. While AG01 has been combined with the MB95 horizontal flux scheme before (Menut et al., 2005; Darmenova et al., 2009), in our experiments we use the SH04 horizontal flux as input parameter. It enables us to evaluate the performance of two complex vertical flux schemes which both attempt to describe the physical processes involved. In-stead of four size bins, we use a discretised full-resolution soil size distribution in order to calculate the SH04 horizon-tal flux as it is required for the AG01 scheme. The size dis-tribution is assumed to follow a multimodal lognormal shape with geometric mean diameters identical to the parent soil size bins (2, 15, 160, 710 µm) (Menut et al., 2005). Accord-ingly, the relative surface area fractionSrelis recalculated for the discretised particle size spectra, withDpk referring to the
diameter of the discretised full-resolution soil size distribu-tion in the range ofDpminandDpmaxwith numberNclass.
en-tirely from each other by overcoming the interparticle cohe-sion forces into account. The dust emitted by sandblasting is characterised by three modesi which are considered to be independent of the soil grain type (Alfaro et al., 1998; Menut et al., 2005). As soil aggregate size or model wind speed in-creases, first a coarse mode particle with the lowest cohesion energyei becomes released byEkin, followed by intermedi-ate and fine mode particles. The vertical dust flux in this case becomes
FAG01(Dpi, Dmk)=
Nclass
X
k=1 π
6 ·ρ·βAG01
·pi(Dpk) ·D3m
i
ei
dG(Dpk). (12)
Here,Dmiis the mean mass diameter of the three soil grain
modes (1.5, 6.7, 14.2 µm),βAG01 is an empirically derived parameter (163 m s−2), andp
i(Dpk)are the fractions ofEkin
required for the release of the dust particles in the respective mode (Alfaro et al., 1997). Note that the AG01 scheme does not provide a size-resolved dust emission flux as the discre-tised particle size spectrum in which the interparticle energy exchange forces act comprises a distinctively different size range than that of the emission flux. One could redistribute the accumulated dust over the four parent soil classes accord-ing to the observed disturbed size sample, but this would not be an actual prediction of this particular emission scheme. As noted by Darmenova et al. (2009), it is unlikely that interpar-ticle cohesion can ever be predicted with the desired accuracy in order to resolve this problem in a satisfactory manner. 3.4 Box model experiments
To test the box model, we run the model with observational data as well as academic data (full range of possible shear velocities). This enables us to (1) estimate the sensitivity of the model to simulate dust emission, and (2) attribute the dis-crepancies to specific components of the emission schemes, or the choice of the emission scheme itself. We also test the critical parameter αas a function ofu∗. The set of
experi-ments used in these exercises is schematically shown in Ta-ble 2. Each experiment uses a specific model set-up based on the schemes introduced in Sect. 2: the sand transport model, the saltation flux and the vertical dust flux scheme.
For the first runs, we only use experiments 1a, 4a and 5a, i.e. all correction schemes switched on, using the MB95, SH04 and AG01 schemes for the vertical emission flux. We focus on the most emissive period during the 2011 cam-paign, selecting a 30 day interval with three major dust events (17 September–17 October 2011). The field campaign begins with the end of the dry season in March/April. Conditions be-come increasingly dry, with average daytime maximum tem-peratures typically reaching>35◦C. Note that the rate of
de-crease in soil moisture varies between each individual field site and throughout time. Higher surface temperatures are
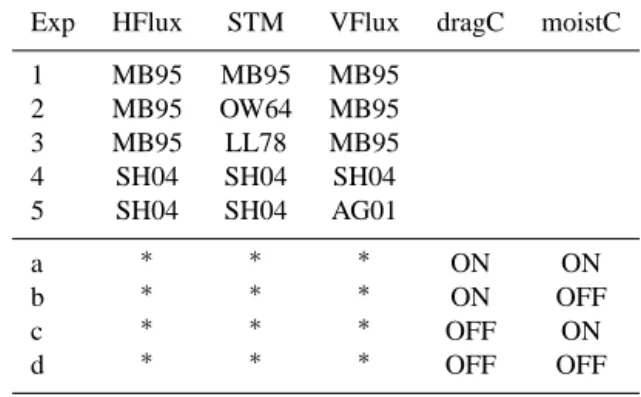
Table 2. Individual model set-ups (1–5) and the conducted
exper-iments (a–d). The sand transport models (STM) used for the two principal horizontal flux (HFlux) models (MB95, SH04) and the selected vertical flux (VFlux) schemes with the number of the cor-responding set-up are given. The lower-case letters refer to the sen-sitivity experiments with the correction schemes.
Exp HFlux STM VFlux dragC moistC
1 MB95 MB95 MB95
2 MB95 OW64 MB95
3 MB95 LL78 MB95
4 SH04 SH04 SH04
5 SH04 SH04 AG01
a ∗ ∗ ∗ ON ON
b ∗ ∗ ∗ ON OFF
c ∗ ∗ ∗ OFF ON
d ∗ ∗ ∗ OFF OFF
∗Experiments are carried out for each model set-up (1–5).
accompanied by increasing boundary layer turbulence. Both the increased availability of momentum and deflatable dust explain the more active late season during the first part of the DO4Models campaign. The dust emission season ended with the first rains in mid-October.
For the second and third set of model runs, the box model is configured to represent a single atmospheric model grid cell. We use the temporally resolved average roughness, soil moisture, and particle size distribution to drive the model. For each experiment set-up, the model is manipulated with (a) all corrections schemes switched on, (b) the soil moisture correction scheme (Eq. 2) switched off, (c) the drag partition correction scheme (Eq. 3) switched off, and (d) both correc-tion schemes switched off.
Darmenova et al. (2009) pointed out that the soil moisture correction after Zhao et al. (2006) (see Eq. 9) might be exces-sively sensitive to changes in the soil moisture content. This will be tested using the MB95 formulation given in Eq. (3). The same will be done with Eq. (2) for roughness. In addi-tion, the corresponding sensitivity of the simulated fluxes is discussed in the context of the observed fluxes.
4 Results and discussion
involved. The applicability of the existing emission schemes is discussed on the basis of our model results and implica-tions for regional and global dust modelling are highlighted in Sect. 4.4.
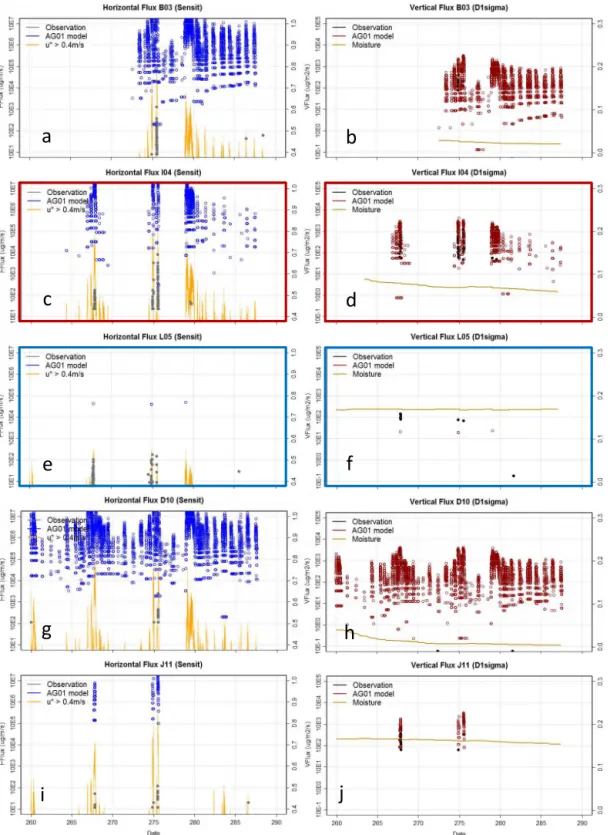
4.1 Model performance during the field campaign During our chosen period of highest emission activity, three major dust events were recorded: 25 September (DOY 268), 2 October (DOY 275), and 3 October (DOY 276), as evi-dent in the observational data at 2 min temporal resolution (Figs. 2–4). Peak wind speeds at 6 m height reached up to 18 m s−1. Corresponding maximumu
∗ values as high as
0.9 m s−1 were observed (with regard to 1t=2 min). Two smaller events were recorded on 17 September (DOY 260) and on 6 October 2011 (DOY 279), thoughu∗did not reach
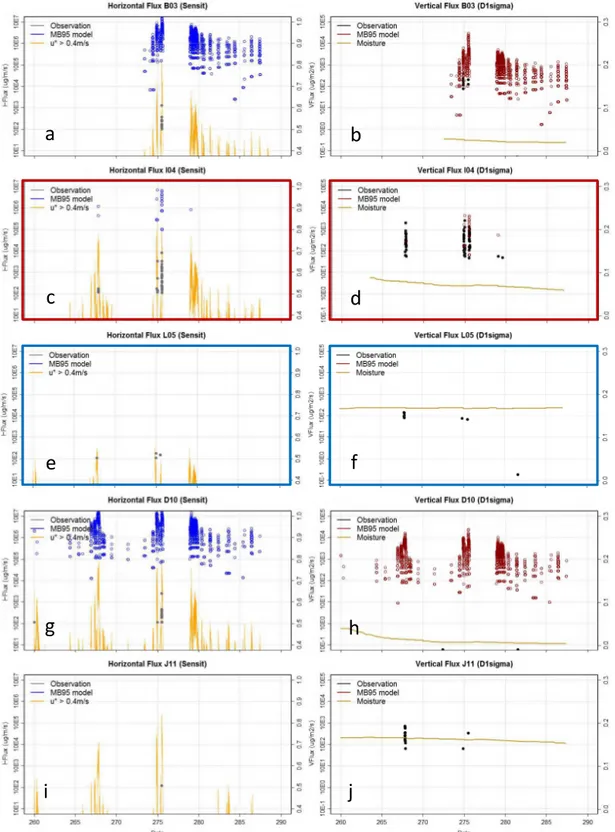
a threshold of 0.4 m s−1 at all sites. Simultaneously dur-ing these wind events, decreasdur-ing Ångström exponents ob-tained from CIMEL data indicated dust loadings rather than biomass burning as the dominant aerosol type. The compar-ison between observed and simulated horizontal and vertical fluxes is shown in Figs. 2, 3, and 4, corresponding to the baseline Exps. 1a (MB95), 4a (SH04) and 5a (AG01), re-spectively. In order to provide a representative view of dust emissions, the most emissive site I4 (red border), the least emissive site L5 (blue border), and three average sites, B3, D10, and J11 were evaluated to provide perspectives on the role of surface type and emissivity.
Site I4 shows a pronounced flux signal during the three major dust events (Fig. 2c). Another small event was recorded on 6 October 2011 (DOY 279). The temporal agree-ment between the modelled fluxes and the observed peak shear velocities over the 17 September–17 October period (2 min temporal resolution) is highest at site I4, particularly for MB95. However, the modelled horizontal flux – associ-ated with the saltation flux – overestimates the observed hor-izontal flux by 3 to 4 orders of magnitude. This discrepancy exists regardless of the strength of the dust event. The mod-elled vertical emission flux – associated with the sandblasting process – overestimates the observed vertical flux approxi-mately by an order of magnitude. While the model perfor-mance is ultimately measured in terms of vertical emission flux (arguably with a much smaller model vs. observation mismatch), the sandblasting efficiencyαdiffers by 2 to 3 or-ders of magnitude between model and observation (see Fig. 6 and the discussion in Sect. 4.3.1).
At sites B3 and D10, only one major saltation event was recorded (Fig. 2a, g). Likewise, vertical dust flux was cal-culated from concentration measurements for only one time interval at B3 (Fig. 2b). D10 did not emit at all, despite favourable observed soil moisture conditions (Fig. 2h). Due to the low soil moisture at both sites (a considerable drop for B3 after DOY 270), the emission threshold in the MB95 model is frequently exceeded, leading to substantially more frequent dust emissions. As at site I4, the modelled saltation
flux during the event on 2 October (DOY 275) at sites B3 and D10 is strongly overestimated by up to 4 orders of mag-nitude. The vertical dust flux at B3 during the same event is overestimated by 1 to 2 orders of magnitude. A few Sensit hits were recorded (expressed in terms ofQOBSin Fig. 2e) at L5, associated with a rare number of events where verti-cal dust emission flux was measured (Fig. 2f). Both observed fluxes and the low shear velocity at L5 are a result of very smooth surface conditions in combination with very wet sub-surface conditions. Equally wet soil conditions at J11 lead to the suppression of dust emissions in the model (Fig. 2i, j) al-together. As a consequence, the model does not simulate dust emission during the event on 25 September (DOY 268).
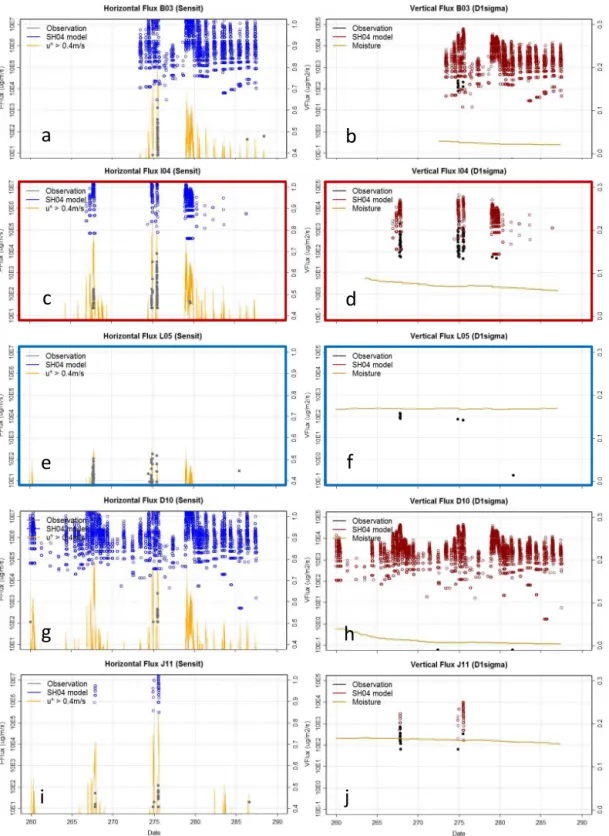
There are more frequent dust emissions with higher con-centrations simulated with SH04 compared with MB95 (Fig. 3). The saltation flux is also strongly overestimated by approx. 4 orders of magnitude, whereas the vertical dust emission flux is overestimated by 1 to 2 orders of magni-tude. Sites B3 and D10 showcase the effect low soil mois-ture conditions will have upon the modelled emission fluxes (Fig. 3a, b, g, h). Unambiguously, the emission threshold is exceeded far more often in the model at sites I4 and D10 (Fig. 3c, d, g, h). Site D10 reveals a potential advantage of the more complex SH04 scheme: the modelled saltation flux does not necessarily result in an equally overestimated verti-cal dust mass flux due to the variable sandblasting efficiency. In contrast, the saltation flux is more strongly overestimated in SH04 compared to MB95. Fluxes with SH04 at site L5 are similar to fluxes simulated with MB95 (Fig. 3e, f). The temporal agreement between observed and modelled fluxes at site J11 is better with SH04 than with MB95 (Fig. 3i, j).
There is close agreement in the case of the saltation fluxes between AG01 and SH04. This is to be expected given that both experiments differ from one another only in the way the size bins are partitioned (see Sect. 3.3). At the same time, the good agreement between both saltation flux estimates is indicative of a limited impact of the size bin resolution on the resulting dust flux estimate. The modelled vertical fluxes in both schemes are different to those in MB95, LL78, and OW64 in two ways though: (1) vertical fluxes are more fre-quent due to substantially higher saltation fluxes in the first place, and (2) the magnitude of the vertical fluxes with AG01 is on average the lowest of all schemes used in our experi-ments. The observed dust emission flux is overestimated by less than an order of magnitude in the model with AG01. While modelled fluxes at B3, I4 and D10 occur much more frequently than observed fluxes (Fig. 4b, d, h), L5 and J11 (Fig. 4f, j) agree very well in that regard.
a
b
c
d
e
f
g
i
h
j
Figure 2. Horizontal and vertical flux for Exp. 1a (MB95 scheme) at five field sites: B3 (a, b), I4 (c, d), L5 (e, f), D10 (g, h), and J11 (i, j). The observed (modelled) saltation and vertical fluxes are shown in grey (blue) and black (dark red) dots. The period between DOY 260
a
b
c
d
e
f
g
h
j
i
a
b
d
c
e
g
i
f
h
j
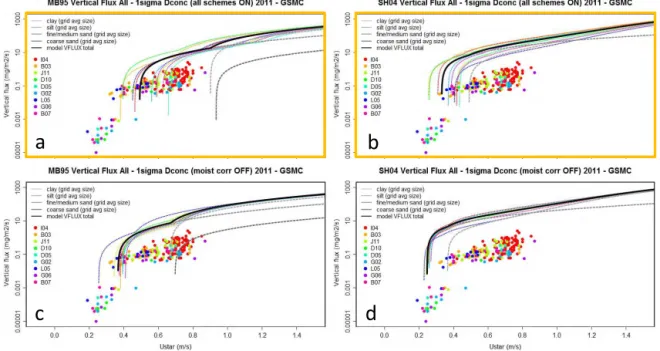
4.2 Examination of dust transport/emission schemes Before we elaborate on the potential causes of this mismatch between observed and modelled fluxes as well as for the sub-stantial differences between the emission schemes, we ex-plore the impact of the emission and sand transport schemes upon the simulated saltation and vertical flux in a wider con-text. We focus on Exps. 1a–5a and Exps. 1d–5d as shown in Fig. 5a, b and c, d, respectively. The simulated horizon-tal (Fig. 5a, c) and vertical fluxes (Fig. 5b, d) represent the sum of the individual fluxes for each parent soil type. Note that the AG01 scheme (Exp. 5a) uses a sub-bin size distribu-tion of which only the total sum is shown, whereas the clay, silt, fine/medium and coarse sand fractions are shown indi-vidually (thin lines) in addition to the sum of all four bins (bold lines) for the MB95, LL78, OW64, and SH04 schemes (Exp. 1a–4a). Note also that the emission threshold is ex-ceeded only for the silt, fine/medium and coarse sand frac-tions (u∗thr(clay) >1.4 m s−1). Box model fluxes are com-puted using observed data as before, averaged over the entire time period of the field campaign and all grid points (see Ta-ble 1).
Model Exps. 1a–5a (Fig. 5a and b) reconfirm the results of the preceding section. The saltation flux in model schemes is overestimated by 3 to 4 orders of magnitude, whereas the simulated vertical flux is overestimated by 1 to 2 or-ders of magnitude in all schemes, with AG01 and OW64 showing the smallest mismatch regarding the vertical flux (cyan line in Fig. 5b). SH04 has a 0.2 m s−1 lower thresh-old velocity than AG01 and MB95. As our observed u∗
never exceeds 0.85 m s−1, we can only speculate whether we would have observed disproportionally increasing saltation flux rates with higher surface shear stress.
Model Exps. 1d–5d (Fig. 5c and d) reveal a surprisingly close range of threshold shear values for all schemes. They start to emit atu∗∼0.2 m s−1with no exception. While the
simulated emission fluxes are still too high, the underlying sand transport concept is robust in all schemes with respect to the emission threshold. Beyond the minimum erosion thresh-old, soil moisture content and surface roughness fundamen-tally control the frequency of occurrence of dust emissions.
Summarising the key aspects of the two sections, we find that the model (1) strongly overestimates the saltation flux and moderately overestimates the vertical emission flux, and (2) tends to be very sensitive to changes in moisture and roughness, leading to inconsistent or inaccurate emission thresholds for individual field sites. The general discrepancy between model results and observations indicates that the emission schemes have problems in representing key phys-ical processes over crusted soil surfaces properly.
4.3 Potential reasons for the model discrepancies In this section, we aim to understand the causes of the box model–observation discrepancies. Specifically, we aim
to identify the parameters that contribute the largest to the model–observation differences. Considering the empirical basis of the emission schemes, it is worth noting that MB95 (mainly based on the formulation after Iversen and White, 1982) as well as SH04 (based on the formulation after Gree-ley and Iversen, 1985) rely on the theoretical concept of equi-librium between forces acting on a spherical loose particle at rest and under the influence of an air stream. As cautioned by Marticorena and Bergametti (1995), this theoretical as-sumption is bound to break down if loose particles are hid-den under a resistant crust. The same is true for the concept of equilibrium between gravitational and interparticle cohe-sion forces which is the basis of SH04 as it was developed in Shao and Lu (2000). While SH04 allows adjustment to the magnitude of the cohesive force (parameterŴ), MB95 is limited in this regard. Deficiencies arising from the MB95 saltation flux formulation are directly passed to the vertical flux estimate. In turn, the explicit formulation ofαin SH04 could potentially reduce intrinsic weaknesses of the saltation flux formulation.
4.3.1 Problems in the simulated fluxes
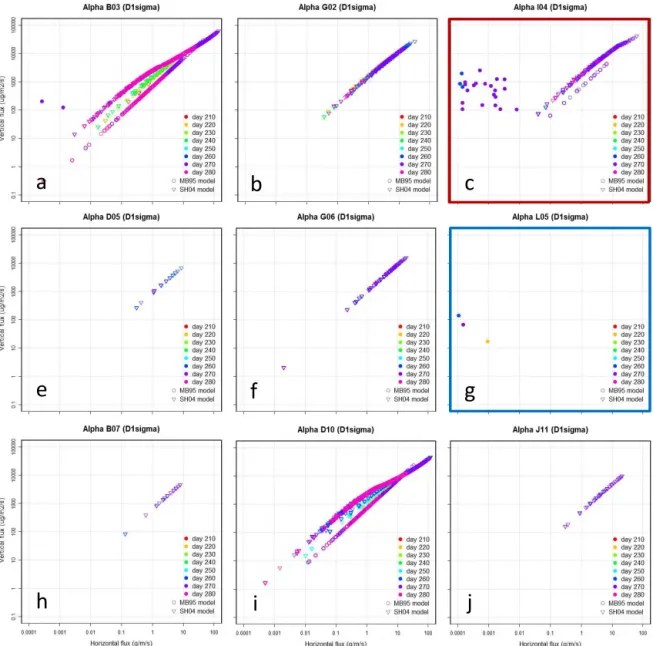
Given that the model overestimates the saltation flux much more than the vertical flux – irrespective of the emission scheme – evaluation of the vertical-to-horizontal flux ratioα
is necessary. In Fig. 6, the discrepancy between the observed and modelled ratio is represented by the distance between the filled coloured dots (αOBS) and the open coloured dots (αMB95; Exp. 1a) or triangles (αSH04; Exp. 4a), respectively. The temporal resolution between two flux measurements in our data is 2 min, which requires coincident observations of
FOBS>0.0 mg m−1s−1 andQOBS>0.0 µg m−2s−1 to de-termineαOBS. This condition is only met at site I4 for two dozens of 2 min measurement intervals, mainly referring to DOY 275 (Fig. 6c). B3 provides sparse additional values (Fig. 6a). L5 (Fig. 6g) is discussed later in this section. The remaining sites are plotted in order to show the variability of the modelledα(MB95/SH04).
a
b
c
d
Figure 5. Horizontal and vertical emission fluxes for Exps. 1a–5a (a, b) and Exps. 1d–5d (c, d). Bold lines are the sum of the flux over
all four size bins. Thin lines are individual model particle size categories (fine/medium sand is emitted first). Coloured circles are the field observations.
On the basis of the surface conditions at our most emissive site I4, which features a thin crust with open cells filled with very fine deflatable particles, we hypothesise that saltating particles are likely to be trapped by the salt-containing fluff in these open cells which then absorbs the saltation momen-tum. Under the assumption that I4 is not a source of larger saltating particles itself, it represents a net sink for creeping and saltating particles, which leads to a cessation in the salta-tion flux. While the horizontal flux ceases, the comparably high shear stress maintains the vertical flux of smaller parti-cles, though at a less efficient rate. Hence, direct entrainment (production of vertical flux without saltating particles) has a larger share in the total emission flux. Whether the shape of the cells or the chemical properties of the fluff material are the major cause of I4 being a saltation sink remains to be explored. In contrast to I4, sustained particle motion (hit-ting the Sensit counter persistently) was observed at site L5 during the wind events, without ever recording actual ver-tical emission of finer particles. Wet sub-surface conditions led to the development of a fresh but very smooth and re-sistant crust at L5. Counter-intuitively, the smooth surface allowed coarser particles (advected from contiguous pan sur-faces with broken crusts) to move easily. Presumably, the ob-served saltation flux at L5 is a result of the very exceptional surface conditions due to L5’s situation on the grid.
Neither the shape of a partly crusted and rippled surface nor the crust itself is represented in our schemes, and this is likely the main cause of the large gap between observed and modelled fluxes. While the theoretical basis of the sand transport and dust emission schemes is well established and
often successfully reproduced (e.g. Shao, 2001, 2008), the observed crust puts a considerable limit on their applicabil-ity in our case. One might argue that it is of lesser relevance to reproduce the saltation flux quantitatively correctly in the model as long as the vertical emission flux is correctly bal-anced, but this inevitably implies the acceptance of funda-mental errors in the parameterisation of the nature of the dust emission process. While the initial emission threshold is very sensitive to z0, w, and particle size, these factors become less important at higher wind speeds, as the sand transport scheme controls the bulk of the vertical dust emission flux.
c
g
j
b
f
i
a
e
h
Figure 6. The temporal evolution of the simulated vertical-to-horizontal flux ratioαfor Exp. 1a (open circles) and 4a (open triangles) is shown in comparison to the observed values (closed circles). The colour refers to 10 day time intervals during the field season, with the start DOY given for each period. Nine out of 11 field sites are shown. In cases ofFOBSwithout simultaneousQOBS,αis zero. Note that there are situations in which vertical emission flux was measured without saltating particles.
et al. (2003) in Spain, all foundαvalues in good agreement with theory. These studies have in common that wind tunnels were used to determine the fluxes experimentally, a fact that might well be key to understanding the difference between their reported results and our field data.
4.3.2 Problems in the correction schemes
The remaining variability of the calculated dust fluxes is de-termined by the correction schemes for surface roughness and soil moisture content – both known to have a large im-pact on modelled mineral dust emission fluxes (Menut et al., 2013). The full range of sensitivities for the baseline
(1999) as used in MB95. The scheme proposed by Zhao et al. (2006) (Eq. 9) would span twice the range of potentialu∗thr values, which cannot be reconciled with the observed sensi-tivity (not shown).
In Fig. 7, the observed fluxes are divided into the same sub-categories. The results show that sites with the highest observed saltation fluxes have a very limited range ofz0(0.1– 1 cm). Likewise, the range of w is confined to lower val-ues (<0.11 m3m−3) for those sites. The stronger fluxes at higheru∗are tied to lowerwvalues. Lowerz0(smoother sur-face) corresponds well to emission at loweru∗values.
Emis-sion flux foru∗>0.6 is observed only forw <0.06 m3m−3
(with very few exceptions). At the lower end, medium rough-ness dominates. Occasionally, we measured vertical dust flux at sites withw >0.06 m3m−3despiteu
∗<0.4 m s−1(high
saltation flux at L5 under these conditions, though). The fact that the sample size is small and the inherent measurement uncertainties are large (as discussed in Sect. 2) is sugges-tive of an artefactual behaviour. However, observed local dust devils can pick up substantial amounts of dust which the dust tracks at 3 m height would easily record. The fraction of the emitted mass flux at low u∗ with respect to the total mass
flux might not be significant during dust events with a high saltation flux, but the omission of frequent low dust emission below the saltation threshold can lead to measurable system-atic underestimation of the dust emission flux.
In Fig. 7e and f, the roughness scheme proposed by Rau-pach et al. (1993) (Eq. 8) is applied. Lesser sensitivity ofu∗thr to changes inz0is found with this scheme. Although it spans a range ofu∗thrvalues which is in good agreement with the observations, it is rather insensitive to variations in aerody-namic surface roughnesses>0.5 cm. Given that the majority of our observedz0values is<0.5 cm, the applicability of the SH04 roughness correction scheme seems questionable, de-spite having selected the remaining parameters such that they fit the category for bare surfaces with dense solid obstacles.
In Fig. 8b and d, Exps. 4a and 4b are compared with ob-servations as a function of u∗. It can be seen that u∗thr of the vertical flux is basically insensitive to changes in rough-ness in the case of SH04. Rather,u∗thris controlled by the soil moisture alone. Replacing it with the McK04 drag par-tition scheme leads to more variability and eventually better agreement with observations (results not shown). In the case of MB95, u∗thr is equally controlled by surface roughness (Fig. 8c) and soil moisture (not shown).
The MB95 drag partition scheme relatesz0to roughness densities of solid obstacles. A major limitation is its non-applicability for larger obstacles. At the pan surface, large crustal plates got lifted by compressive stress due to drying of the crust material. These vertically displaced plates reached 10–20 cm in height, stretching over several 100 m in a wave-like pattern with high lateral cover. High surface roughnesses were also reported by Greeley et al. (1997) from space-borne observations in Death Valley, USA, or by Marticorena et al. (2006) from ground-based observations in Tunisia. The
ridge-induced change in roughness has been studied and shown to be important in reducing the saltation flux (Kardous et al., 2005). To account for higher roughnesses, MacKinnon et al. (2004) (McK04) corrected the MB95 scheme such that it is applicable for rougher surface conditions. In their case, the higher roughness is caused by vegetation (central Mojave Desert, USA). Hence, doubts remain as to whether the as-sumptions made are perfectly valid for our purposes, despite the fact that the scheme performs better than the SH04.
With regard to the soil moisture correction, both the pa-rameterisations developed by Fécan et al. (1999) (MB95) and by Shao et al. (1996) (SH04) require the exact knowl-edge of the moisture in the top 1–2 cm soil layer. We con-sider our 0–3 cm moisture measurement to be representative of this layer. The key aspects regarding the sensitivity of the threshold shear velocity outlined in Sect. 4.2 are reconfirmed in Fig. 8a, b. In Exps. 1c and 4c, the sole application of the soil moisture correction tends to improve agreement between simulated and observedu∗thras well as the vertical emission flux (not shown). Note that both formulations (MB95 and SH04) are empirically derived and hence not universally ap-plicable for all soil moisture conditions. As pointed out by Shao (2008), they fail to be reproducible in data sets other than those from which the formulation was initially derived. The fact that none of the evaluated model correction schemes can be used without limitations as they struggle to reproduce the observed range ofu∗thr is attributable to two principal shortcomings. (1) The roughness correction does parameterise unevenness of the terrain, but is not designed to account for different shapes such as open cells. (2) The mois-ture correction does parameterise the wetness of the soil, but does not incorporate moisture-dependent chemical properties of the soil which may lead to crust formation.
4.4 Implications for dust modelling
b
d
w (z0=0.001 cm)a
w (z0=1cm)
c
z0(w=6%)
z0(w=11%)
z0(w=16%)
e
f
Figure 7. Horizontal and vertical emission fluxes for the baseline Exp. 1a (a, b) and Exp. 4a (c, d, e, f). The entire range of observed surface
roughness and soil moisture is plotted as a function ofu∗. Likewise, the observational data are split into groups of different roughnesses and moisture. Lowest observedz0are indicated by red and dark red dots, and highest observedz0by orange and yellow dots (see legend). Lowest observedware indicated by black and dark grey open circles around the dots, and higher observedwby brown and light grey open circles (see legend). Modelledz0are set to two groups of 0.001 and 1 cm, whereas modelledware set to three groups of 6, 11, and 16 %, respectively.
modelled global dust emissions are based on partly invalid assumptions.
Why – despite these limitations – are current emission schemes able to reproduce the global dust cycle fairly well? Apart from the potential counterbalancing effect of equally erroneous dry and wet deposition assumptions, the fact that global emissions are controlled by a few very productive sources which are driven by frequent and excessive ex-ceedance of the threshold wind speeds tends to eradicate problems which occur at wind speeds just above u∗thr. For example, neither the drag partition nor the soil moisture cor-rection will have a sizeable effect once u∗thr is exceeded. Furthermore, the signal-to-noise-ratio increases with higher wind speeds, acting to minimise biases introduced by inac-curate representations of the surface conditions. Instead,
in-variable parameters such as the soil size distribution become the dominant source of error.
a
c
b
d
Figure 8. Vertical emission flux for Exps. 1a, b (a, c), and 4a, b (b, d). Coloured circles are the observed fluxes. The simulated grid average
flux is shown in black. The fluxes of the individual field sites are complementarily given by the dotted coloured lines. The dashed grey lines refer to the model particle size categories as specified on the top left, with fine/medium sand being emitted first (compare Fig. 5).
Given the important role that surface crust seems to play, we recommend that these features be represented in the mod-els. A crustiness parameter to correctu∗thrcould be defined as the aggregated state of the dry ground surface for resis-tant crusts as proposed by Ishizuka et al. (2008). Using avail-able maps of aerodynamic surface roughness length (Prigent et al., 2005; Laurent et al., 2008), an adjusted version which takes crust cover into account may be possible. In addition, the spatio-temporal considerations can help to find an appro-priate tuning constant to constrain the spatial heterogeneity. This is particularly true as only a small portion of the grid (I4 in our case) controls the bulk of the emissions. The in-corporation of sub-grid scale emission schemes into climate or NWP models could be a worthwhile effort in that regard. What remains elusive so far is whether the small range of roughness and soil moisture values for which we measured dust fluxes at the grid is indicative of a systematic relation betweenz0,wand the properties of the crust.
The aspect of spatial heterogeneity is also related to model resolution. A typical grid box in a regional climate or NWP model corresponds to the size of our grid in the field (12 km2). One such single grid box is treated as a homoge-neous surface, with soil moisture, soil size distribution and surface roughness being equal everywhere. In an ideal mod-elling world, not only do the grid box average values have to provide a balanced portrait of the emissive area fraction, but they also have to fit the observations of soil available for emission adequately. In the real world, most models make use of the soil texture classes after Tegen et al. (2002). In our box model experiments, the soil texture class which comes
closest to our grid average size distribution is the loamy sand category. Comparing the emission flux obtained with the size distribution given by this fixed category and the observed size distribution, we find that the resulting model saltation flux is significantly reduced in the case of the fixed category. A recently published new data set of soil mineralogy for dust productive soils could alleviate the problem (Nickovic et al., 2012; Journet et al., 2014). Ideally, a correction which aims at splitting the dictated size distribution into a minimally and fully disturbed subset of data could be introduced. As it is a difficult goal to achieve, the SH04 scheme should preferen-tially be used as it tries to account for the shift in the size distribution, at least to some extent.
Finally, our results indicate that direct entrainment of dust particles plays a moderate role in the emission process. This assumption is based on the low correlation between simu-lated and observed fluxes with the tested emission schemes, particularly for the saltation flux. Although the impact of this emission mechanism is thought to be small as far as global climate simulations are concerned (since it is confined to low shear stress conditions), there is increasing evidence that sed-iment erosion and transport may respond effectively to wind turbulence (Weaver and Wiggs, 2011; Wiggs and Weaver, 2012). Indeed, Engelstaedter and Washington (2007) have noted that surface gustiness at dust hotspots exerts a much stronger temporal control on the timing of emissions than large-scale winds. If they are correct, direct entrainment dur-ing such gusts will very likely play a role, with concomitant effects on the global scale. Undoubtedly, direct entrainment matters for regional short-term applications (e.g. local dust storm warnings). As current schemes do not capture these aspects well, those that take stochastic effects into account (Klose and Shao, 2012, 2013) could alleviate the problem to some extent.
5 Conclusions
The performance of current state-of-the-art dust emission schemes has been tested against observational data retrieved during the 2011 DO4Models field campaign in Botswana. The capabilities of these schemes to describe the physical processes which are thought to play a role in the dust emis-sion process have been explored. We have found that all mod-els fail to reproduce the observed dust fluxes in all exper-iments, regardless of their level of complexity. In particu-lar, the horizontal saltation flux is overestimated by several orders of magnitude, causing the commonly used concept of an approximately constant sandblasting mass efficiency (vertical-to-horizontal flux ratio) to break down. The main reason is that the field site is characterised by a crust of vary-ing thickness and extension.
The current results suggest that the observed saltation flux is several orders of magnitude lower than anticipated from theoretical considerations, even at our most emissive field site. Yet the measured vertical dust emission flux is closer to theoretical expectations. We therefore infer that saltation, sandblasting and aggregate disintegration are not the only emission processes at play. Rather, these results indicate that direct dust entrainment plays a vital role too. Since none of the tested schemes accounts for direct entrainment as explic-itly mentioned in Shao (2004), the discrepancy in the sand-blasting efficiency is explicable. Stochastic schemes such as the one recently proposed by Klose and Shao (2012) might help to overcome this problem. We believe that our results provide a fairly robust starting point to test these emerging new schemes.
Furthermore, we have found that the most sensitive param-eter for the dparam-etermination of the emission threshold in the model, the soil moisture, does not always relate to the po-tential emissivity of the site. Some sites with low enough soil moisture values to allow for dust emission did in fact not emit owing to a thick and continuous crust. As a result, spatio-temporal variations of the emission flux are large, both in the observations and in the box model. The agreement for indi-vidual field sites is often poor, which is indeed indicative of a rather loose relationship between soil and surface properties and the resulting dust flux. The agreement between model and field data is, however, acceptable in the baseline experi-ments at the most emissive site. Encouragingly, the wettest site (with a smooth and thick crust) was essentially non-emissive during the 2011 field campaign.
The sensitivity experiment also taught us that even the least sensitive soil moisture correction foru∗thr(Fécan et al., 1999) still tends to be too sensitive. The drag partition cor-rection foru∗thris less sensitive, but only the scheme pro-posed by MacKinnon et al. (2004) is applicable over the en-tire range of observed aerodynamic surface roughnesses, de-spite the fact that it was originally proposed for vegetated desert surfaces. Using a minimally and a fully disturbed soil size distribution data set at each site for the model calculation of the horizontal and the vertical dust mass flux, respectively, the observed particle size range could be realistically repre-sented by virtue of the availability of soil aggregate and soil individual particle size information.
Having systematically examined the impacts of the major emission model components, we highlight the following key findings and implications.
– Strong overestimation of saltation flux in all schemes – Moderate overestimation of vertical flux in all schemes – The OW64 transport scheme reduces the quantitative
bias.
– Soil moisture sensitivity is too high in the Fecan scheme.
– McK04 drag partition correction outperforms MB95. – The SH04 scheme captures observed spatial variability
better.
– Vertical emission flux sensitive to soil size distribution – Crust properties have a large impact on emitted dust
mass.
– Spatio-temporal crust variability needs to be parame-terised.
In this context, we note that an atmospheric model’s meteoro-logical fields are another key factor which may well outweigh the impact of spatio-temporal variability or measurement un-certainty (e.g. Darmenova et al., 2009; Knippertz and Todd, 2012). We address this aspect in an upcoming study using a state-of-the-art climate model.
We would like to emphasise that it is certainly necessary to include missing processes in dust emission schemes if one wants to move forward towards a more realistic description of the emission process. This is particularly true if one is aim-ing to provide regional or local dust emission forecasts, bear-ing also in mind that surface gustiness is a controllbear-ing fac-tor for dust emission (Engelstaedter and Washington, 2007). A better constrained dust emission flux inherently helps to reduce uncertainties in other parts of the dust cycle, prefer-entially in the deposition flux. As many of the most emis-sive dust spots worldwide share common soil and surface properties, we argue that the incorporation of parameteri-sations which reflect mechanisms that are characteristic of crusted soils can potentially improve the overall accuracy of the models, particularly over regions which feature frequent changes between dry and wet conditions, as most monsoon regions do.
The Supplement related to this article is available online at doi:10.5194/gmd-8-341-2015-supplement.
Acknowledgements. The authors thank J. Nield, A. Dansie, and K. Vickery for their assistance in the field work. We acknowledge the support of Botswana Ash (Pty) Ltd. for help with field access and the Botswana Ministry of Environment, Wildlife and Tourism for granting permission for our research (permit no. EWT 8/36/4 XIV). We particularly thank A. Dansie for providing the soil size distribution data. We gratefully acknowledge the valuable contribu-tion of two anonymous reviewers and, furthermore, we would like to thank H. Brindley, S. Woodward, and S. Engelstaedter for their constructive comments, all of which have helped to improve the pa-per a lot. The work was funded by Natural Environment Research Council grant NE/H021841/1 (DO4Models).
The Fortran code (v1.0) used to carry out the model calculations is provided as Supplement to the paper.
Edited by: H. Tost
References
Alfaro, S. C. and Gomes, L.: Modeling mineral aerosol production by wind erosion: Emission intensities and aerosol size distribu-tion in source areas, J. Geophys. Res., 106, 18075–18084, 2001. Alfaro, S. C., Gaudichet, A., Gomes, L., and Maillé, M.: Modeling the size distribution of a soil aerosol produced by sandblasting, J. Geophys. Res., 102, 11239–11249, 1997.
Alfaro, S. C., Gaudichet, A., Gomes, L., and Maillé, M.: Mineral aerosol production by wind erosion: Aerosol particle sizes and binding energies, Geophys. Res. Lett., 25, 991–994, 1998. Andreae, M. O.: Climatic effects of changing atmospheric aerosol
levels, Vol. 16, World Survey of Climatology, Elsevier, Amster-dam, 1996.
Ashpole, I. and Washington, R.: An automated dust detection using SEVIRI: A multiyear climatology of summertime dustiness in the central and western Sahara, J. Geophys. Res., 117, D08202, doi:10.1029/2011JD016845, 2012.
Bagnold, R. A.: The Physics of Blown Sand and Desert Dunes, Methuen, New York, 1941.
Bangert, M., Nenes, A., Vogel, B., Vogel, H., Barahona, D., Kary-dis, V. A., Kumar, P., Kottmeier, C., and Blahak, U.: Saharan dust event impacts on cloud formation and radiation over Western Eu-rope, Atmos. Chem. Phys., 12, 4045–4063, doi:10.5194/acp-12-4045-2012, 2012.
Boucher, O., Randall, D., Artaxo, P., Bretherton, C., Feingold, G., Forster, P., Kerminen, V.-M., Kondo, Y., Liao, H., Lohmann, U., Rasch, P., Satheesh, S. K., Sherwood, S., Stevens, B., and Zhang, X.-Y.: Chapter 7: Clouds and aerosols, Tech. rep., Work-ing Group I contribution to the IPCC 5th Assessment Report “Climate Change 2013: The Physical Science Basis”, 2013. Brindley, H. E., Knippertz, P., Ryder, C., and Ashpole, P.: A critical
evaluation of the ability of the Spinning Enhanced Visible and Infrared Imager (SEVIRI) thermal infrared red-green-blue ren-dering to identify dust events: Theoretical analysis, J. Geophys. Res., 117, D07201, doi:10.1029/2011JD017326, 2012.
Bryant, R. G., Bigg, G. R., Mahowald, N. M., Eckardt, F. D., and Ross, S. G.: Dust emission response to cli-mate in southern Africa, J. Geophys. Res., 112, D09207, doi:10.1029/2005JD007025, 2007.
Bullard, J. E., Harrison, S. P., Baddock, M. C., Drake, N., Gill, T. E., McTainsh, G., and Sun, Y.: Preferential dust sources: A geomorphological classification designed for use in global dust-cycle models, J. Geophys. Res., 116, F04034, doi:10.1029/2011JF002061, 2011.
Darmenova, K., Sokolik, I. N., Shao, Y., Marticorena, B., and Bergametti, G.: Development of a physically-based dust emis-sion module within the Weather Research and Forecasting (WRF) model: Assessment of dust emission parameterizations and input parameters for source regions in Central and East Asia, J. Geophys. Res., 114, D14201, doi:10.1029/2008JD011236, 2009.
Eckardt, F. D., Bryant, R., McCulloch, G., Spiro, B., and Wood, W. W.: The hydrochemistry of a semi-arid pan basin case study: Sua Pan, Makgadikgadi, Botswana„ Appl. Geochem., 23, 1563– 1580, doi:10.1016/j.apgeochem.2007.12.033, 2008.
Engelstaedter, S. and Washington, R.: Temporal controls on global dust emissions: The role of surface gustiness, Geophys. Res. Lett., 34, L15805, doi:10.1029/2007GL029971, 2007.
Evan, A. T., Dunion, J., Foley, J. A., Heidinger, A. K., and Velden, C. S.: New evidence for a relationship between Atlantic tropical cyclone activity and African dust outbreaks, Geophys. Res. Lett., 33, L19813, doi:10.1029/2006GL026408, 2006.
FAO-UNESCO: Soil Map of the world at 1:5000000. Volume I., Tech. rep., UNESCO, Paris, France, 1974.