ACPD
12, 3655–3694, 2012Biogenic influence on cloud microphysics over
the global ocean
A. Lana et al.
Title Page
Abstract Introduction
Conclusions References
Tables Figures
◭ ◮
◭ ◮
Back Close
Full Screen / Esc
Printer-friendly Version Interactive Discussion
Discussion
P
a
per
|
Dis
cussion
P
a
per
|
Discussion
P
a
per
|
Discussio
n
P
a
per
|
Atmos. Chem. Phys. Discuss., 12, 3655–3694, 2012 www.atmos-chem-phys-discuss.net/12/3655/2012/ doi:10.5194/acpd-12-3655-2012
© Author(s) 2012. CC Attribution 3.0 License.
Atmospheric Chemistry and Physics Discussions
This discussion paper is/has been under review for the journal Atmospheric Chemistry and Physics (ACP). Please refer to the corresponding final paper in ACP if available.
Biogenic influence on cloud microphysics
over the global ocean
A. Lana1, R. Sim ´o1, S. M. Vallina2, and J. Dachs3
1
Institut de Ci `encies del Mar (ICM), CSIC, Barcelona, Spain
2
EAPS, MIT, Cambridge, Massachusetts, USA
3
Department of Environmental Chemistry, IDAEA, CSIC, Barcelona, Spain
Received: 5 January 2012 – Accepted: 24 January 2012 – Published: 2 February 2012 Correspondence to: A. Lana ([email protected])
ACPD
12, 3655–3694, 2012Biogenic influence on cloud microphysics over
the global ocean
A. Lana et al.
Title Page
Abstract Introduction
Conclusions References
Tables Figures
◭ ◮
◭ ◮
Back Close
Full Screen / Esc
Printer-friendly Version Interactive Discussion
Discussion
P
a
per
|
Dis
cussion
P
a
per
|
Discussion
P
a
per
|
Discussio
n
P
a
per
|
Abstract
Aerosols have a large potential to influence climate through their effects on the micro-physics and optical properties of clouds and, hence, on the Earth’s radiation budget. Aerosol-cloud interactions have been intensively studied in polluted air, but the possi-bility that the marine biosphere plays a role in regulating cloud brightness in the pristine 5
oceanic atmosphere remains largely unexplored. We used 9 yr of global satellite data and ocean climatologies to derive parameterizations of (a) production fluxes of sulfur aerosols formed by the oxidation of the biogenic gas dimethylsulfide emitted from the sea surface; (b) production fluxes of secondary organic aerosols from biogenic organic volatiles; (c) emission fluxes of biogenic primary organic aerosols ejected by wind ac-10
tion on sea surface; and (d) emission fluxes of sea salt also lifted by the wind upon bub-ble bursting. Series of global weekly estimates of these fluxes were correlated to series of cloud droplet effective radius data derived from satellite (MODIS). Similar analyses were conducted in more detail at 6 locations spread among polluted and clean regions of the oceanic atmosphere. The outcome of the statistical analysis was that nega-15
tive correlation was common at mid and high latitude for sulfur and organic secondary aerosols, indicating both might be important in seeding cloud droplet activation. Con-versely, primary aerosols (organic and sea salt) showed more variable, non-significant or positive correlations, indicating that, despite contributing to large shares of the ma-rine aerosol mass, they are not major drivers of the variability of cloud microphysics. 20
Uncertainties and synergisms are discussed, and recommendations of research needs are given.
1 Introduction
Aerosols have a great impact on the Earth’s radiative budget by direct and indirect interactions with solar radiation. Direct effects occur through the absorption and the 25
ACPD
12, 3655–3694, 2012Biogenic influence on cloud microphysics over
the global ocean
A. Lana et al.
Title Page
Abstract Introduction
Conclusions References
Tables Figures
◭ ◮
◭ ◮
Back Close
Full Screen / Esc
Printer-friendly Version Interactive Discussion
Discussion
P
a
per
|
Dis
cussion
P
a
per
|
Discussion
P
a
per
|
Discussio
n
P
a
per
|
the Earth’s surface (Haywood and Boucher, 2000). Indirect effects occur through the large influence that aerosols have on the formation and optical properties of clouds. The concentration number, physical and chemical characteristics of aerosols modify cloud microphysics, namely the size and number of cloud droplets, and thereby influ-ence cloud brightness (Twomey, 1977) and longevity (Albrecht, 1989), among other 5
properties (Lohmann and Feichter, 2005). The most salient of these complex indirect effects is that clouds formed in the presence of larger amounts of small aerosols have larger albedo (Andreae and Rosenfeld, 2008). This influence is predicted to be more acute in air masses with fewer aerosols, such as those over the oceans away from continental influence (Twomey, 1977; Andreae and Rosenfeld, 2008).
10
Among the natural climate-regulation processes hypothesized to act through aerosol-cloud interactions, the most notorious was postulated as the CLAW hypothesis (Charlson et al., 1987). CLAW suggested that oceanic emissions of dimethylsulfide (DMS) to the atmosphere could constitute a climate buffer through the regulation of the amount of solar radiation that reaches the Earth surface. DMS is formed in the sur-15
face ocean as a by-product of food-web processes and plankton ecophysiology (Sim ´o, 2001; Stefels et al., 2007). Being a volatile compound, DMS is emitted from the ocean to the atmosphere where it is oxidized, mainly by OH radicals, to form H2SO4, non-sea-salt SO−42and other hygroscopic products that may nucleate into particles and grow to act as cloud condensation nuclei (CCN) or seeds for cloud drop formation (Andreae 20
and Rosenfeld, 2008). If planktonic production of DMS increases with increasing tem-perature or sunlight, and its emission eventually reduces solar radiation, DMS might be the core of a negative (self-regulating) feedback between the marine biosphere and cli-mate (Charlson et al., 1987). The cross-discipline and cross-scale nature of the CLAW hypothesis has stimulated research in and across fields as apparently distant as plank-25
ACPD
12, 3655–3694, 2012Biogenic influence on cloud microphysics over
the global ocean
A. Lana et al.
Title Page
Abstract Introduction
Conclusions References
Tables Figures
◭ ◮
◭ ◮
Back Close
Full Screen / Esc
Printer-friendly Version Interactive Discussion
Discussion
P
a
per
|
Dis
cussion
P
a
per
|
Discussion
P
a
per
|
Discussio
n
P
a
per
|
evidence for the sensitivity of DMS production to underwater light intensity (Vallina and Sim ´o, 2007; Lana et al., 2011b), the existence and significance of the proposed feed-back loop as a climate buffer remains elusive (Levasseur, 2011) and has been strongly challenged (Quinn and Bates, 2011).
Despite DMS has drawn much of the attention because of the CLAW hypothe-5
sis, there might be other secondary organic aerosol (SOA) precursors (as yet largely unidentified) that are produced by similar mechanisms and might therefore play anal-ogous roles (Liss and Lovelock, 2007). Marine SOA precursors are natural volatile organic compounds produced by plankton and photochemical reactions all over the oceans. Their emissions are, however, poorly constrained (Dachs et al., 2005, 2012; 10
Sim ´o, 2011). Initially it was suggested that biogenic isoprene fluxes could account for a significant fraction of SOA (Palmer and Shaw, 2005; Meskhidze and Nenes, 2006), as occurs over densely vegetated land. Recently, a number of other SOA precursors have been identified, namely iodomethanes, amines, monoterpenes and non-methane hydrocarbons (Sim ´o, 2011; and references therein). They cause increases in aerosol 15
number and organic matter during periods of higher biological productivity (O’Dowd et al., 2004; Vaattovaara et al., 2006; M ¨uller et al., 2009). With these emissions be-ing poorly quantified, combinations of modellbe-ing and observations indicate that known emission fluxes of marine volatiles cannot account for organic aerosol concentrations measured over the oceans, and important fluxes of primary organic aerosols (POA) 20
are to be invoked (e.g., Arnold et al., 2009; Rinaldi et al., 2010). In fact, current esti-mates of POA and SOA precursor fluxes fall short at predicting organic aerosol levels through atmospheric models (Heald et al., 2005), thus calling for the existence of hith-erto unaccounted sources of organic carbon. It should be noted that emissions of hydrophobic semivolatile chemicals that accumulate in the surface microlayer and are 25
ACPD
12, 3655–3694, 2012Biogenic influence on cloud microphysics over
the global ocean
A. Lana et al.
Title Page
Abstract Introduction
Conclusions References
Tables Figures
◭ ◮
◭ ◮
Back Close
Full Screen / Esc
Printer-friendly Version Interactive Discussion
Discussion
P
a
per
|
Dis
cussion
P
a
per
|
Discussion
P
a
per
|
Discussio
n
P
a
per
|
Sea-spray is ejected into the atmosphere by the action of wind speed on the sur-face of the ocean. It is generated by bubble bursting and carries sea salt together with organic particles, both of which may act as CCN once in the atmosphere. These sea-spray POA are composed of virus, bacteria, biogenic polymeric organic material and associated semivolatiles (Bauer et al., 2003; Bowers et al., 2009; Russell et al., 2010; 5
Orellana et al., 2011). Being all of biological origin, it is likely that POA precursors are somewhat proportional to plankton biomass and its most commonly used indica-tor, chlorophyll-aconcentration. Indeed, the scarce existing measurements of POA in small marine aerosols (e.g., O’Dowd et al., 2004; Leck and Bigg, 2007) suggest that they are more abundant in air masses downwind of chlorophyll-a rich waters, particu-10
larly if strong winds enhance the lift of sea spray. The biological POA source may be reinforced by the action of surfactants exuded by phytoplankton, which lower surface tension and may facilitate the ejection of small aerosols.
Sea salt (SS) is also ejected offthe sea surface as sea-spray. It has an important presence in the marine atmosphere, contributing 44 % of the global aerosol optical 15
depth (O’Dowd and de Leeuw, 2007). Sea salt was overlooked in the original CLAW hypothesis, because it was thought to be composed of too few and too big particles to have a significant influence in cloud microphysics despite their high hygroscopicity (Le Qu ´er ´e and Saltzman, 2009). Today, however, it is known that a non-negligible pro-portion of sea salt particles belong to the small size fraction that makes them effective 20
as CCN (Andreae and Rosenfeld, 2008; de Leeuw et al., 2011); moreover, sea salt aerosols play a role in the atmospheric chemistry of gaseous aerosol precursors (von Glassow, 2007).
When the CLAW hypothesis was published (Charlson et al., 1987), DMS was thought to be the main, if not the only, source of new CCN in the pristine ocean. This scenario 25
ACPD
12, 3655–3694, 2012Biogenic influence on cloud microphysics over
the global ocean
A. Lana et al.
Title Page
Abstract Introduction
Conclusions References
Tables Figures
◭ ◮
◭ ◮
Back Close
Full Screen / Esc
Printer-friendly Version Interactive Discussion
Discussion
P
a
per
|
Dis
cussion
P
a
per
|
Discussion
P
a
per
|
Discussio
n
P
a
per
|
aerosols in internal and external mixtures (Andreae and Rosenfeld, 2008). Any at-tempt to evaluate the role of the marine biosphere in cloud formation and the radiative budget on a global scale must therefore be able to distinguish between biotic and abi-otic, and between anthropogenic and continental sources of the marine aerosols, and describe their geographical, temporal, concentration and size distributions.
5
In this study, we make use of satellite data and ocean climatologies to parameterize the variability in the flux rates of aerosol formation from ocean-leaving DMS and SOA precursors. We also parameterize the emission fluxes of POA and sea salt from the surface ocean. These aerosol sources are compared with the satellite-derived size of cloud droplets on weekly and monthly bases over a 9-yr period. Temporal correlations 10
at both the global scale and representative locations are analyzed as a means to as-sess the potential role of each marine aerosol source in driving the variability of cloud microphysics. Regions where the sought marine aerosol-cloud interactions are heavily interfered by continental aerosols are identified.
2 Data and methodology
15
2.1 Biogenic sulfur aerosol flux
The global ocean DMS concentration data used in this study is the L10 DMS clima-tology (Lana et al., 2011), which consists of global monthly maps of concentrations distributed in 1◦×1◦latitude-longitude pixels. This climatology, an update of that from 1999 (Kettle et al., 1999), was constructed using exclusively the surface DMS concen-20
tration measurements (approx. 47 000) available in the Global Surface Seawater DMS database (GSSDD), maintained at the NOAA-PMEL (http://saga.pmel.noaa.gov/dms) and fed with contributions of individual scientists from all over the world.
Ocean-to-atmosphere emission fluxes were computed with the climatological sur-face DMS concentrations and the corresponding gas transfer coefficients, which were 25
ACPD
12, 3655–3694, 2012Biogenic influence on cloud microphysics over
the global ocean
A. Lana et al.
Title Page
Abstract Introduction
Conclusions References
Tables Figures
◭ ◮
◭ ◮
Back Close
Full Screen / Esc
Printer-friendly Version Interactive Discussion
Discussion
P
a
per
|
Dis
cussion
P
a
per
|
Discussion
P
a
per
|
Discussio
n
P
a
per
|
described in McGillis et al. (2000). The parameterization used for the water side DMS gas transfer coefficient was that suggested by Nightingale et al. (2000) corrected to the Schmidt number of DMS according to Saltzman et al. (1993). The air side trans-fer coefficient calculation was based on the neutral stability water vapour bulk transfer coefficients from Kondo (1975). The computation of the emission flux also considers 5
the sea surface temperatures (SST) and the non-linear influence of wind speed on air-water mass transfer coefficients.
Monthly global, 1◦×1◦climatologies of SST and wind speed were obtained from the NCEP/NCAR reanalysis project (http://www.esrl.noaa.gov) for the period 1978–2008, as most of the DMS data available in the database are from that period. Because the 10
water side gas transfer coefficient has a nonlinear dependence on wind speed, the use of monthly averaged wind speeds introduces a bias into the flux calculation. The flux was corrected for this effect assuming that instantaneous winds follow a Weibull distribution, using the approach of Sim ´o and Dachs (2002).
To compute a proxy of DMS oxidation fluxes in the atmosphere we followed the same 15
approach as Vallina et al. (2007). The hydroxyl radical (OH) is the main atmospheric DMS oxidant (Savoie and Prospero, 1989; Chin et al., 2000; Barrie et al., 2001; Kloster et al., 2006). Daytime DMS oxidation initiated by OH produces, among other products, aerosol-forming methanesulphonic acid (MSA), sulfuric acid and its corresponding an-ion non-sea-salt sulfate (nss-SO−42). Therefore the amount of DMS-derived aerosols 20
that can act as CCN depends not only on the DMSflux but also on OH concentrations. We used a monthly global distribution of OH concentration data in the marine boundary layer (MBL) obtained from the GEOS-CHEM model run by the Atmospheric Chemistry Group at Harvard University for the year 2001 (Fiore et al., 2003).
The potential source for CCN-forming DMS oxidation can be parameterized as fol-25
lows:
γDMSflux (µmolS m−2d−1)=γ·DMSflux (1)
ACPD
12, 3655–3694, 2012Biogenic influence on cloud microphysics over
the global ocean
A. Lana et al.
Title Page
Abstract Introduction
Conclusions References
Tables Figures
◭ ◮
◭ ◮
Back Close
Full Screen / Esc
Printer-friendly Version Interactive Discussion
Discussion
P
a
per
|
Dis
cussion
P
a
per
|
Discussion
P
a
per
|
Discussio
n
P
a
per
|
parameter varying between 0 and 1 that gives the efficiency of DMS oxidation as a funtion of the raion between OH and DMSflux following an equation of the form:
γ=x/(kS+x) (2)
where,
x=OH/DMSflux (3)
5
In the absence of OH (or very low OH) concentrations respect to the DMSflux, most (or at least part) of the DMSflux cannot be converted to CCNDMS (in this situationsγ will be low). On the other hand, if OH concentrations are in excess all the DMSflux can be oxidized to CCNDMS (in these situations γ will be close to one). The form of the equation accounts for an asymptotic behavior; as the availability of OH for DMS 10
oxidation (the variablex) increases, a higher fraction of the DMSflux can be converted to CCNDMSapproaching asymptotically the upper limit of gamma (for which all DMSflux is converted to CCNDMS). Therefore γDMSflux gives the amount of biogenic sulfur potentially available for CCN production. Following Vallina et al. (2007), we took the value ofkSderived from the annual averages of OH, DMSflux andγover the Southern 15
Ocean. Note that Vallina et al. (2007) validated the capability of this parameterization to reproduce the seasonality of DMS oxidation by comparing it against monthly series of MSA concentrations in aerosols at 15 aerosol sampling stations of the world oceans. MSA is the most appropriate for validation purposes because it is formed exclusively from DMS oxidation, whereas nss-SO4 results from DMS, combustion sources and 20
ACPD
12, 3655–3694, 2012Biogenic influence on cloud microphysics over
the global ocean
A. Lana et al.
Title Page
Abstract Introduction
Conclusions References
Tables Figures
◭ ◮
◭ ◮
Back Close
Full Screen / Esc
Printer-friendly Version Interactive Discussion
Discussion
P
a
per
|
Dis
cussion
P
a
per
|
Discussion
P
a
per
|
Discussio
n
P
a
per
|
2.2 Marine SOA flux
We parameterized the variability of the SOA production rate with the same approach used for the DMS-derived aerosol, computing the emission flux and the oxidation rate of its precursor. Unlike biogenic sulfur aerosols, however, marine SOA has a number of potential precursors, namely a myriad of volatile and semi-volatile organic compounds 5
(VOCs) not yet fully characterized, which includes isoprene (Bonsang et al., 1992), ter-penes (Yasaa et al., 2008), amines (Facchini et al., 2008), alkylnitrates (Chuck et al., 2002), alkanes (Dachs et al., 2012), among others (Bonsang et al., 2008). Since no global climatology of surface ocean VOCs exists, and because both the air-sea transfer coefficient and the atmospheric oxidation are dependent on the chemical composition 10
of the precursor mix, which is unknown and probably very variable, an accurate pa-rameterization is not possible. To overcome this limitation, we considered that SOA-forming VOCs are closely associated with, and proportional to the concentration of chlorophyll-a (Baker et al., 2000). We took isoprene as a surrogate of SOA precur-sors, and parameterized the emissions of total volatile and semi-volatile precursors as 15
it was isoprene. Isoprene concentration in the surface ocean has been found roughly proportional to chlorophyll-a, at least much more so than that of DMS (Baker et al., 2000; Bonsang et al., 1992; Broadgate et al., 1997; Palmer and Shaw, 2005). There-fore, we computed the SOA-forming VOCs concentration in surface seawater from the chlorophyll-aconcentration. The weekly and monthly chlorophyll-a data for the period 20
2001–2009 were obtained from the SeaWiFS Project (GSFC, NASA), and transformed into 1◦×1◦ latitude-longitude spatial resolution.
Then, we computed the VOC emission flux (µmolC m−2d−1) as
VOCflux=kw(u,SST)·CHL·b (4)
wherekw is the transfer coefficient of isoprene, calculated following Palmer and Shaw
25
ACPD
12, 3655–3694, 2012Biogenic influence on cloud microphysics over
the global ocean
A. Lana et al.
Title Page
Abstract Introduction
Conclusions References
Tables Figures
◭ ◮
◭ ◮
Back Close
Full Screen / Esc
Printer-friendly Version Interactive Discussion
Discussion
P
a
per
|
Dis
cussion
P
a
per
|
Discussion
P
a
per
|
Discussio
n
P
a
per
|
VOC oxidation to potentially form SOA (SOAflux) was computed similarly to the
γDMSflux, assuming OH is the main oxidant, which is the case for isoprene and most organics at the low NOx levels of the marine atmosphere (Kroll et al., 2006; Carlton et al., 2009):
SOAflux (µmolC m−2d−1)=γ·VOCflux (5)
5
Where
γ=x/(kS+x) (6)
and
x=OH/VOCflux (7)
2.3 Marine primary aerosol fluxes: sea salt and POA
10
We parameterized the emission flux of submicron sea salt (FSS, 106particles m−2s−1) in sea spray as a function exclusively of the wind speed, following O’Dowd et al. (2008):
FSS=(1.854×10⁻³)·u2.706 (8)
Whereuis the wind speed taken from the same climatology as for the SOAflux. Since POA is mainly constituted by phytoplankton and bacterioplankton-derived 15
biopolymers (Facchini et al., 2008; Hawkings and Russell, 2010) and biological par-ticles such as virus, bacteria (Aller et al., 2005) and microalgae (Brown et al., 1964), it is reasonable to consider that POA precursors in the surface ocean occur in general proportionality to chlorophyll-a (O’Dowd et al., 2004). Indeed, an empirical parame-terization has been suggested to estimate the amount of submicron organic matter 20
lifted as primary particles by wind speed along with the sea spray as a function of the chlorophyll-aconcentration – CHL – (Vignati et al., 2010):
% organic mass =43.5·CHL+13.805 (9)
ACPD
12, 3655–3694, 2012Biogenic influence on cloud microphysics over
the global ocean
A. Lana et al.
Title Page
Abstract Introduction
Conclusions References
Tables Figures
◭ ◮
◭ ◮
Back Close
Full Screen / Esc
Printer-friendly Version Interactive Discussion
Discussion
P
a
per
|
Dis
cussion
P
a
per
|
Discussion
P
a
per
|
Discussio
n
P
a
per
|
% organic mass =76 (10)
for CHL ≥1.43mg m−3.
With the calculation of the SSflux and the percentage of organic mass, we computed the POA flux emitted to the atmosphere:
5
POAflux =SSflux·(0.435·CHL+0.138) (11)
for CHL <1.43mg m−3; and
POAflux=SSflux·0.76 (12)
for CHL ≥1.43mg m−3.
10
where CHL was taken from the same monthly 1◦×1◦ SeaWiFS climatology used for the SOAflux.
2.4 Continental aerosol-dominated regions and cloud droplet radius
To estimate the geographic extent of a heavy influence of continental aerosols to the marine atmosphere we used the approach of Jurado et al. (2008) and Lana 15
et al. (2011c). The aerosol classification procedure is mainly based on satellite op-tical measurements that are proxies for the amount and type of aerosol: the aerosol optical thickness, which describes the attenuation of sunlight by a column of aerosol; its standard deviation, indicative of the aerosol optical depth variability; and the Angstr ¨om exponent, which is inversely related to the average size of the aerosol. These 20
were all obtained from the Moderate Resolution Imaging Spectrometer Instrument (MODIS, http://modis.gsfc.nasa.gov). Complementary data used were wind speed and proximity to fire points, land vegetation and urban and industrial centres. Wind speed distributions were obtained from the NCEP/NCAR reanalysis project as men-tioned above, and helped identify the conditions for large sea salt emissions. Fire-25
ACPD
12, 3655–3694, 2012Biogenic influence on cloud microphysics over
the global ocean
A. Lana et al.
Title Page
Abstract Introduction
Conclusions References
Tables Figures
◭ ◮
◭ ◮
Back Close
Full Screen / Esc
Printer-friendly Version Interactive Discussion
Discussion
P
a
per
|
Dis
cussion
P
a
per
|
Discussion
P
a
per
|
Discussio
n
P
a
per
|
(http://due.esrin.esa.int/wfa/). Urban centers and land vegetation were taken from the land cover classification map of the International Geosphere-Biosphere Programme (http://www.gewex.org/islscpdata.htm). All parameters were computed into monthly means on a resolution of 1◦×1◦for the period 2001–2009.
The cloud microphysical property used in this study was the liquid cloud droplet 5
effective radius (re), which is the ratio of third to second moment of the satellite-derived cloud drop size distribution. It was obtained from the Level 3 MODIS Terra Collection 5, obtained from the NASA Goddard Space Fight Center Level 1 and Atmosphere Archive Distribution System (DAADS Web, http://ladsweb.nascom.nasa.gov/data/search.html). The data resolution is 1◦, with a quality assurance of 1 km. Both weekly and monthly 10
data for the 2001–2009 period were used.
2.5 Temporal correlations between variables
Temporal co-variations between paired variables (namely aerosol fluxes andre) were explored by the running-window correlation method (Vallina et al., 2007). For each month and each 1◦×1◦ position, we substituted the value of the targeted variable for 15
the average of the 49 values of a 7◦×7◦ window located around the position. Then we constructed the monthly series of the variable over the 2001–2009 period (9 yr, 108 months) for each 1◦×1◦ position. With these 108 data for each variable for each 1◦×1◦ pixel we computed the Spearman’s correlation between paired variables, ob-taining a global map of correlation coefficients. Correlations were significant at 95 % 20
confidence level approximately when |ρ|>0.1 (monthly and weekly temporal resolu-tion) and when|ρ|>0.5 (annual resolution).
For the Southern Ocean case study, we calculated the average of each variable over the 40◦–60◦S latitudinal band, and compared the weekly data series of paired variables throughout the 9 yr (414 weeks). We calculated the Spearman’s correlation coefficient 25
ACPD
12, 3655–3694, 2012Biogenic influence on cloud microphysics over
the global ocean
A. Lana et al.
Title Page
Abstract Introduction
Conclusions References
Tables Figures
◭ ◮
◭ ◮
Back Close
Full Screen / Esc
Printer-friendly Version Interactive Discussion
Discussion
P
a
per
|
Dis
cussion
P
a
per
|
Discussion
P
a
per
|
Discussio
n
P
a
per
|
For the aerosol sampling stations case studies, weekly aerosol fluxes andrevalues were averaged over a 7◦×7◦ window located right upwind of each station. Paired vari-ables were plotted in standardized form and correlated as for the Southern Ocean case study. When they were to be compared with in situ aerosol MSA concentrations, they were collapsed into monthly means over one climatological year by simple averaging. 5
3 Results
3.1 Global maps of seasonal correlations
3.1.1 DMS oxidation flux versusre
To investigate if there is a widespread seasonal relationship between secondary aerosol precursors or primary aerosols ejected from the ocean surface and cloud 10
droplet size, we constructed global maps of correlation coefficients of monthly data over the period 2001–2009 (Fig. 1). Superimposed on the plots is the area of the oceanic at-mosphere heavily influenced by continental aerosols, according to Lana et al. (2011c). Figure 1a shows that there is a strong negative correlation between the DMS oxida-tion flux (γDMSflux) andreover temperate and high latitudes and in the subequatorial 15
Atlantic and Eastern Pacific oceans. A uniform negative correlation is particularly re-markable in the southern oceans south of 30◦S. Negative correlation implies that the higher the DMS oxidation flux in the atmosphere is, such that there is larger potential for biogenic sulfur aerosol formation, the smaller the droplets of liquid clouds are, and vice versa. Indeed, over most of the global oceansγDMSflux increases from winter 20
to summer as a result of a generalized increase of the seawater DMS concentration (Lana et al., 2011a) and a concomitant increase in the OH concentration in the MBL (Vallina et al., 2007).
ACPD
12, 3655–3694, 2012Biogenic influence on cloud microphysics over
the global ocean
A. Lana et al.
Title Page
Abstract Introduction
Conclusions References
Tables Figures
◭ ◮
◭ ◮
Back Close
Full Screen / Esc
Printer-friendly Version Interactive Discussion
Discussion
P
a
per
|
Dis
cussion
P
a
per
|
Discussion
P
a
per
|
Discussio
n
P
a
per
|
northern oceans. It is also non-significant or slightly positive downwind of major pol-lution sources, namely Europe (NE Atlantic and European seas), the eastern coast of North America (NW Atlantic), Southern Asia (N Indian) and Eastern Asia (NW Pacific). These are areas heavily influenced by continental aerosols, as shown by the mask on the map, and particularly by small combustion-derived aerosols (Lana et al., 2011c), 5
which are as good as natural marine aerosols as CCN. The seasonality of combus-tion aerosols is different from that of marine biogenic aerosols, and it has been shown that, in regions downwind of combustion foci, the seasonality ofre differs from that in unpolluted oceanic regions and follows closely the timing of the dominant combustion aerosol (Lana et al., 2011c).
10
In the case of the Equatorial and Tropical N Pacific, the occurrence of positive cor-relations betweenγDMSflux andre is more puzzling. It should be noted that this also occurs with the correlations of other types of natural aerosols tore (Fig. 1b–d). This is a region most affected by the intertropical convergence, where large ascending air fluxes feed the formation of a persistent band of high altitude-reaching thunderstorm 15
clouds. There, the liquid cloud attribution of MODIS to theremeasurements may have little to do with aerosols formed in the MBL.
In addition to the abundance of continental aerosols regions in the tropics and sub-tropics, low latitudes are characterized by very low seasonality. Since our statistical analysis is mainly based on seasonal correlations, any uncertainty associated with the 20
monthly variables can generate a noise with larger amplitude than the underlying sea-sonality, thus affecting the correlation coefficient. Only because of the low seasonality, hence, lower correlation coefficients are to be expected at lower latitudes, even if the underlying causal relationships were the same.
3.1.2 SOA precursos versusre 25
ACPD
12, 3655–3694, 2012Biogenic influence on cloud microphysics over
the global ocean
A. Lana et al.
Title Page
Abstract Introduction
Conclusions References
Tables Figures
◭ ◮
◭ ◮
Back Close
Full Screen / Esc
Printer-friendly Version Interactive Discussion
Discussion
P
a
per
|
Dis
cussion
P
a
per
|
Discussion
P
a
per
|
Discussio
n
P
a
per
|
Important differences occur in the southern oceans between 20◦S and 40◦S, where the SOAflux exhibits mostly positive correlation while the γDMSflux gives non-significant or negative correlation. Also in the N Pacific between 20◦N and 40◦N, the SOAflux correlates negatively torewhereγDMSflux does not. Conversely, bothγDMSflux and SOAflux correlate negatively torenorth of 40◦N and south of 40◦S.
5
3.1.3 Primary organic aerosol (POA) versusre
Unlike those ofγDMSflux and SOAflux, the correlation of marine submicron primary organic aerosols (POAflux) tore does not show a general pattern (Fig. 1c). Correla-tion coefficients change from positive to negative through non-significant in a rather patchy way. Many of the regions with negative correlation, i.e., those where POA could 10
be regarded as an important source of CCN and smaller cloud droplets, are regions with a heavy influence of continental aerosols. Since the POAflux was parameterized as a function of wind speed and the chlorophyll-a concentration, the correlation map shows some similarities to that of the SOAflux. The important differences come from the fact that the SOAflux parameterization used also the OH concentration, which has 15
a seasonality similar to that ofre.
The correlation map of the submicron sea salt emission flux (SSflux) tore (Fig. 1d) resembles that of the POAflux. This was expected because the parameterization of the POAflux is derived from that of the SSflux with intervention of the chlorophyll-a con-centration. The main difference between both occurs in the Southern Ocean south of 20
50◦S, where the SSflux shows a rather uniform positive correlation tore. This strongly indicates that sea salt is not a main driver of CCN variability in the pristine ocean, as already suggested by Vallina et al. (2006).
3.2 Weekly evolution in the unpolluted Southern Ocean
Several authors have suggested that if a causal relationship between marine emis-25
ACPD
12, 3655–3694, 2012Biogenic influence on cloud microphysics over
the global ocean
A. Lana et al.
Title Page
Abstract Introduction
Conclusions References
Tables Figures
◭ ◮
◭ ◮
Back Close
Full Screen / Esc
Printer-friendly Version Interactive Discussion
Discussion
P
a
per
|
Dis
cussion
P
a
per
|
Discussion
P
a
per
|
Discussio
n
P
a
per
|
Ocean (Menskindse and Nenes, 2006; Kr ¨uger and Graßl, 2011). The reason is that, due to the lack of continental land masses and large pollution sources, and due to the strong circumpolar winds, the Southern Ocean underlies one of the most pristine atmo-spheres on Earth, with the additional particularity of being rather uniform over a broad latitudinal band and all throughout longitudes. Further, the seasonalities of both marine 5
productivity and aerosol and cloud variables are very marked and repeated over years. Indeed, strong positive correlations have been reported between CCN numbers and the DMS oxidation fluxes in the Southern Ocean (Vallina et al., 2007). Therefore, this region makes an interesting case study for a closer examination of correlations among marine aerosol emission and formation fluxes and cloud droplet size.
10
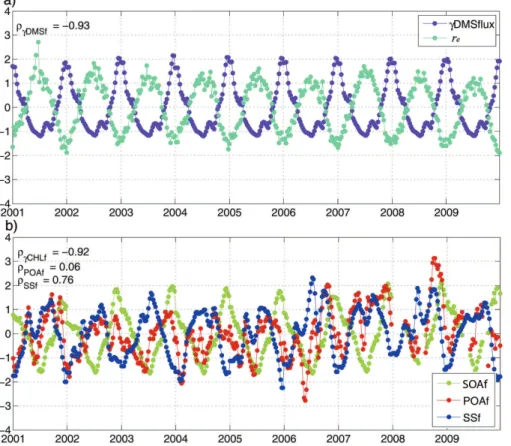
Weekly series of averageγDMSflux, SOAflux, POAflux and SSflux data were cor-related to averagere data over the full 40◦–60◦S band (Fig. 2). Note that while SOA and primary aerosol fluxes were parameterized from weekly wind speed, SST and chlorophyll-adata throughout the period 2001–2009, the parameterization ofγDMSflux used weekly seawater DMS concentration data deconvoluted from a climatological 15
year; that is, the interannuality of the γDMSflux series only reflects the interannual-ity of wind speed and SST, but not that of DMS.
Weekly re showed a clear annual pattern, repeated with great similarity year after year (Fig. 2a): larger cloud droplets in austral winter (May through August) and smaller in summer (December–February). The series ofγDMSflux and re showed a close in-20
verse relationship, with a Spearman’s correlation coefficient of −0.93 (n=414). This agrees with the findings of Kr ¨uger and Graßl (2011) and is similar to the strong nega-tive correlation found for monthlyγDMSflux and satellite-derived CCN numbers in the region (Vallina et al., 2006, 2007). Also the SOAflux was strongly anti-correlated to
re on a weekly basis (ρ=−0.92, n=414; Fig. 2b). These results show that the more 25
ACPD
12, 3655–3694, 2012Biogenic influence on cloud microphysics over
the global ocean
A. Lana et al.
Title Page
Abstract Introduction
Conclusions References
Tables Figures
◭ ◮
◭ ◮
Back Close
Full Screen / Esc
Printer-friendly Version Interactive Discussion
Discussion
P
a
per
|
Dis
cussion
P
a
per
|
Discussion
P
a
per
|
Discussio
n
P
a
per
|
No correlation was found between the POAflux andre (ρ=0.06, n=414; Fig. 2b). Even though POAflux exhibited some seasonality, this was less marked (less unimodal) than those ofre,γDMSflux and SOAflux, with minimal values in late summer, maximal values in late spring, and a lot of intra- and interannual variability. The SSflux, though also variable, showed more a marked seasonality, but in positive phase with that of 5
re (Fig. 2b). In fact, and according to its simple parameterization, SSflux followed the seasonality of wind speed. Consequently, the correlation coefficient was high but positive: 0.76 (n=414).
3.3 Case studies in the unpolluted and polluted marine atmosphere
With the aim to make a closer examination of the potential influence of marine biota on 10
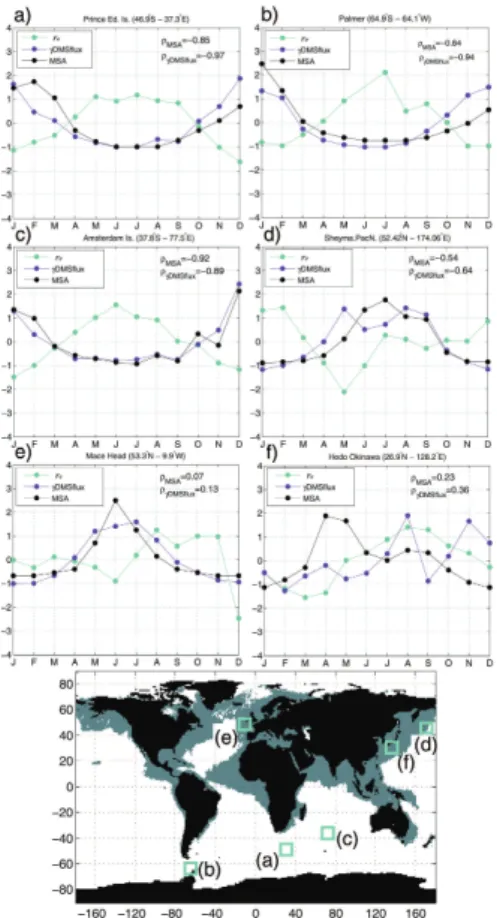
cloud microphysics we chose six localized areas of the ocean that represent different climate regimes and exhibit a range of quantitative influences of continental aerosol (Fig. 3). These areas were defined as 7◦×7◦ windows upwind of the Prince Edward Islands (Southern Ocean), Palmer Station (Antarctic Peninsula), Amsterdam Island (S Indian), Shemya Island (Subarctic N Pacific), Mace Head (temperate NE Atlantic) 15
and Hedo-Okinawa (temperate NW Pacific). All these areas contain an aerosol sam-pling station with a record of monthly atmospheric MSA measurements for at least one year. Since MSA originates exclusively from DMS oxidation and has no major conti-nental source, it is a good metric to which validate our representation of theγDMSflux (Vallina et al., 2007). Figure 3 shows the monthly series of MSA, γDMSflux and re 20
for a climatological year. Figures 4–6 show weekly series ofγDMSflux, re, SOAflux, POAflux and SSflux for the period 2001–2009. Note that, again, theγDMSflux series was not constructed with actual weekly data but was calculated from deconvoluted, climatological monthly seawater DMS concentration and weekly wind speed and SST data.
25
ACPD
12, 3655–3694, 2012Biogenic influence on cloud microphysics over
the global ocean
A. Lana et al.
Title Page
Abstract Introduction
Conclusions References
Tables Figures
◭ ◮
◭ ◮
Back Close
Full Screen / Esc
Printer-friendly Version Interactive Discussion
Discussion
P
a
per
|
Dis
cussion
P
a
per
|
Discussion
P
a
per
|
Discussio
n
P
a
per
|
concentrations, which are maximal in summer and minimal in winter, agree well with that of the estimatedγDMSflux (Fig. 3a), thus providing a ground-based test for the validity of the seawater DMS climatology and the associated emission and oxidation fluxes in the Southern Ocean. re showed an inverse seasonality, with larger cloud droplets in winter and smaller in summer, in the way it would be predicted by the indi-5
rect aerosol effect if theγDMSflux would be a major source of CCN. As a result, the correlations of monthly MSA andγDMSflux torewere strongly negative (Spearman’s coefficients of −0.85 and−0.97, respectively,n=12). On a weekly basis over the pe-riod 2001–2009, bothγDMSflux and SOAflux correlated significantly to re (ρ=−0.64 in both cases, n=411 and n=376). Conversely, the POAflux and the SSflux gave 10
positive correlations (0.37 and 0.49, respectively,n=381 andn=414), contrary to the predictions if they were main sources of CCN (Fig. 4a, b).
Palmer Station (64.9◦S–64.1◦W) is located on Anvers Island, midway down the west-ern side of the Antarctic Peninsula. The seasonalities of aerosol MSA,γDMSflux and
reare very similar to those observed at Prince Edward Island, and the negative corre-15
lation of the two former to the latter was equally strong (−0.84 and−0.94, respectively,
n=12; Fig. 3b). Also weeklyγDMSflux correlated significantly to weeklyre(ρ=−0.66,
n=411; Fig. 4c), and so did the SOAflux (ρ=−0.6, n=322; Fig. 4d). The POA flux showed no significant correlation (ρ=−0.16,n=324) and the SSflux showed a slight positive correlation (ρ=0.37,n=414; Fig. 4c, d).
20
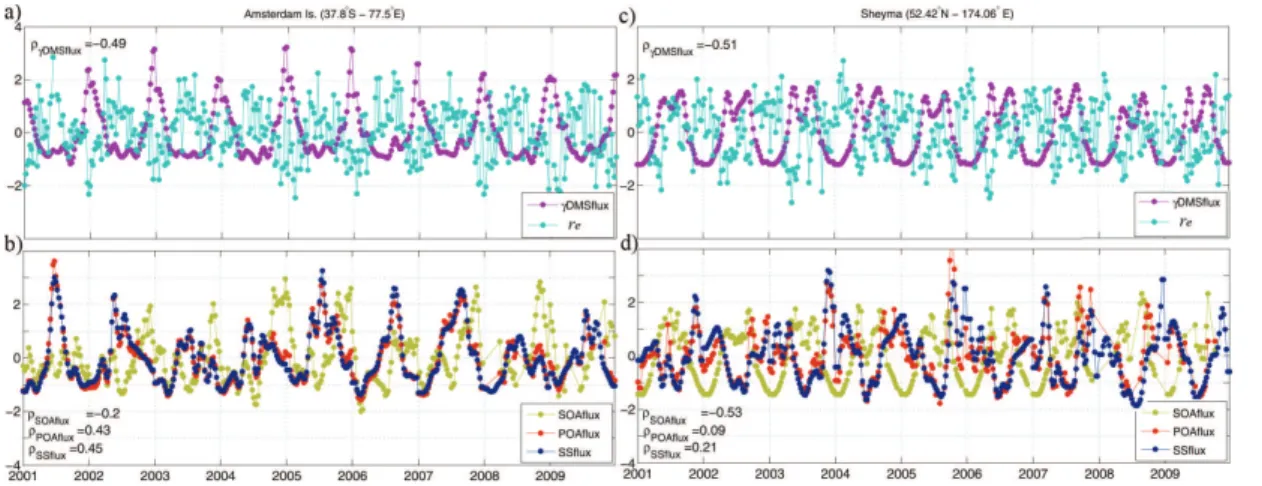
Amsterdam Island (37.8◦S–77.5◦E) is located in the S Indian Ocean. Monthly rain-water MSA from 1996 showed a marked seasonal variation with higher concentrations in summer, coincident with the seasonality of concurrent atmospheric DMS concen-trations (Sciare et al., 1998). We can observe in Fig. 3c that the monthly variation of the MSA measurements agrees closely with that of theγDMSflux derived from the up-25
dated seawater DMS climatology. Both MSA andγDMSflux showed a strong negative correlation tore(Spearman’s correlation coefficients of−0.92 and−0.89, respectively,
ACPD
12, 3655–3694, 2012Biogenic influence on cloud microphysics over
the global ocean
A. Lana et al.
Title Page
Abstract Introduction
Conclusions References
Tables Figures
◭ ◮
◭ ◮
Back Close
Full Screen / Esc
Printer-friendly Version Interactive Discussion
Discussion
P
a
per
|
Dis
cussion
P
a
per
|
Discussion
P
a
per
|
Discussio
n
P
a
per
|
tore(ρ=−0.2,n=377), whereas POAflux and SSflux had similar positive correlations (0.43 and 0.45, respectively,n=381 andn=414; Fig. 5b).
Shemya (52.42◦N–174.06◦E) is one of the Aleutian Islands located in the high-latitude Central N Pacific. Aerosol MSA measurements were conducted by Saltzman et al. (1986) as part of a broader study over the Pacific Ocean. By computing the ratio 5
MSA/nss-SO−42, Savoie et al. (1989) concluded that marine biogenic sulfur accounts for ca. 80 % of the annually averaged nss-SO−42 over the mid-latitude North Pacific. Shemya was the station with the highest MSA concentrations and the most dramatic seasonal cycle. In spite of a lack of local nss-SO−42 measurements, the authors esti-mated that the station is influenced by continental aerosol sources during the winter, 10
when the input from biological sources is minimal. The monthly aerosol MSA series agreed closely with our estimate of monthly γDMSflux (Fig. 3d). re showed a less unimodal seasonality than that in more pristine regions, and consequently the correla-tions of monthly MSA andγDMSflux to droplet size were lower, yet significant (−0.54 and−0.64, respectively,n=12). On a weekly basis (Figs. 5c, d), both γDMSflux and 15
SOAflux were significantly inversely correlated to re (ρ=−0.51 and −0.53, respec-tively,n=410 andn=350), whereas POAflux and SSflux were not (ρ=0.09 and 0.21, respectively,n=355 andn=414).
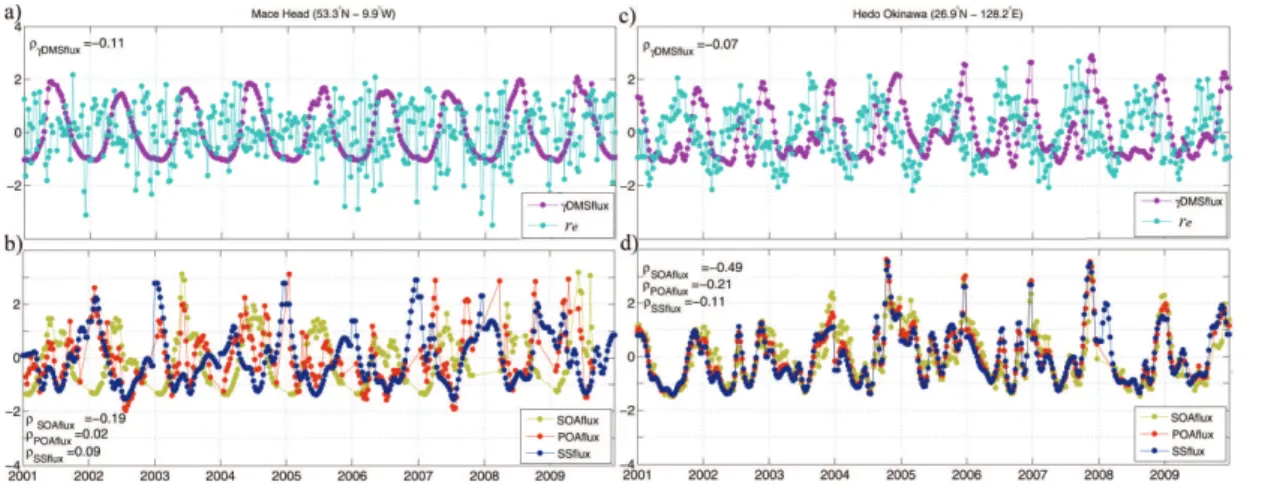
We also chose two stations situated in polluted areas, i.e., heavily influenced by continental aerosols during part of the year: Mace Head and Hedo-Okinawa. The 20
aerosol MSA measurements at both stations were taken from Chin et al. (2000). Mace Head (53.3◦N–9.9◦W) is located on the SW coast of Ireland. According to O’Dowd et al. (2004), this station allows for a sound sampling of air representative of the open ocean if precaution is taken to avoid land-crossing air masses. According to our satellite-using approach, a large part of the N Atlantic receives important loads of 25
ACPD
12, 3655–3694, 2012Biogenic influence on cloud microphysics over
the global ocean
A. Lana et al.
Title Page
Abstract Introduction
Conclusions References
Tables Figures
◭ ◮
◭ ◮
Back Close
Full Screen / Esc
Printer-friendly Version Interactive Discussion
Discussion
P
a
per
|
Dis
cussion
P
a
per
|
Discussion
P
a
per
|
Discussio
n
P
a
per
|
which did not show any clear seasonal pattern. The correlation betweenγDMSflux andre did not improve on a weekly basis (ρ=−0.11,n=412; Fig. 6a). The SOAflux, POAflux and SSflux did not correlate either (|ρ|<0.20 in all cases, withn=303,n=307 andn=414, respectively; Fig. 6b), indicating that the variation ofrewas driven by fac-tors other than marine aerosols.
5
Cape Hedo is the northern tip of Okinawa Island (26.9◦N–128◦E), located between Japan main islands and Taiwan. The station is downwind of important urban and in-dustrial aerosol sources, and it is also affected by biomass burning and Asian dust transport (Takami et al., 2006; Lana et al., 2011c). This was the only examined station where monthly MSA andγDMSflux data did not agree (Fig. 3f); this had been observed 10
by Vallina et al. (2007) using a former version of the seawater DMS climatology, and was attributed to the influence of polluted aerosols on particulate MSA through het-erogeneous adsorption. Neither MSA norγDMSflux correlated significantly tore. This was also evident on a weekly basis, where the seasonalities ofreandγDMSflux were lagged by a few weeks (ρ=−0.07,n=411; Fig. 6c). Among the other marine aerosol 15
sources, only the SOAflux, but not POAflux and the SSflux, showed a significant neg-ative correlation tore(correlation coefficients of−0.49,−0.21 and−0.11, respectively,
n=378,n=381 andn=414).
4 Discussion
4.1 Secondary aerosols
20
Our results show the spread of negative correlations of parameterized emission and oxidation fluxes of DMS and SOA precursors with cloud droplet size (re) over large regions of the ocean. In the case of DMS, this is consistent with the positive correlations reported forγDMSflux and satellite-derived CCN burdens (NCCNs) (Vallina et al., 2007) and forNCCNs and re (Lana et al., 2011c) over the global oceans, particularly at mid 25
ACPD
12, 3655–3694, 2012Biogenic influence on cloud microphysics over
the global ocean
A. Lana et al.
Title Page
Abstract Introduction
Conclusions References
Tables Figures
◭ ◮
◭ ◮
Back Close
Full Screen / Esc
Printer-friendly Version Interactive Discussion
Discussion
P
a
per
|
Dis
cussion
P
a
per
|
Discussion
P
a
per
|
Discussio
n
P
a
per
|
condition for it. The correlation map in Fig. 1a provides support to the hypothesized importance of DMS emissions for cloud microphysics in the clean marine atmosphere. Both theγDMSflux and the SOAflux show a particularly high anti-correlation withre in the Southern Ocean, where there is a reduced number of CCN, and marine pre-cursors must play an important role in cloud microphysics because the influence of 5
continental aerosols is very low. However, there are also large areas in the tropics and subtropics where the seasonalities of the γDMSflux and the SOAflux are non-significantly or even positively correlated to that of re. In some of these areas (e.g., the NW Atlantic, the N Indian and the Westernmost N Pacific), the notable presence of continental aerosols is probably more influential on cloud microphysics than these 10
natural secondary sources. But also in the cleaner equatorial and subtropical S Pacific, the lack of seasonal coupling discards marine secondary aerosols as the main divers of re. We should note, however, that the weak or absent seasonality in the tropics hampers the use of temporal correlation analyses that are mainly based on seasonal signals.
15
In the SH, the areas with non-significant or positive coupling between SOAflux and
reextend further south than those for theγDMSflux. This may reflect actual differences in the role of DMS and other organic volatiles as sources of CCN. But it could also be due to an inappropriate parameterization of the SOA precursor fluxes from the ocean. Based on multiple evidence (see Sect. 2.2, and e.g. O’Dowd et al., 2004), we parame-20
terized the SOAflux with the assumption that volatile and semivolatile precursors occur in the surface ocean in proportionality to the chlorophyll-a concentration. At mid to high latitudes (>40◦), chlorophyll-aconcentrations increase in summer in parallel to an increase in CCN numbers (Vallina et al., 2006) and a decrease in cloud droplet size (Lana et al., 2011c). At subtropical to mid latitudes, by contrast, chlorophyll-a concen-25
ACPD
12, 3655–3694, 2012Biogenic influence on cloud microphysics over
the global ocean
A. Lana et al.
Title Page
Abstract Introduction
Conclusions References
Tables Figures
◭ ◮
◭ ◮
Back Close
Full Screen / Esc
Printer-friendly Version Interactive Discussion
Discussion
P
a
per
|
Dis
cussion
P
a
per
|
Discussion
P
a
per
|
Discussio
n
P
a
per
|
oxidative stress and solar radiation) as is the case for DMS (Vallina and Sim ´o, 2007; Lana et al., 2011a, b), the SOAflux might also show an annual maximum in summer and be more inversely proportional tore. There is a strong need to better identify the most important players among marine SOA precursors, beyond isoprene, and to con-duct time series and manipulation studies aimed at deciphering the biological and envi-5
ronmental drivers of their seasonal variability. Also their volatilization and atmospheric chemical behavior (including SOA production yields in the marine atmosphere) need to be described if we are to assess their role in CCN formation and cloud microphysics over the ocean. Overall, the notion that SOA from marine biogenic precursors plays a role in the size distribution and compositon of remote marine aerosols is supported 10
by aerosol studies (e.g., O’Dowd et al., 2004; Facchini et al., 2008; Sorooshian et al., 2009). A significant influence of biogenic SOA on marine cloud microphysics is still an open question regional, satellite-based studies have not agreed upon (Meskhindze and Nenes, 2006; Miller and Yuter, 2008).
A further complication for the interpretation of the differences and similarities be-15
tween the SOAflux and theγDMSflux with respect torearises from the potential syn-ergisms of volatile organics and biogenic sulfur in aerosol nucleation and CCN activa-tion. Modeling (Meskhidze and Nenes, 2006) and smog chamber studies (e.g., Zhang et al., 2004; Metzger et al., 2010) have suggested that mixtures of organic volatiles and ammonia enhance the nucleation of sulfuric acid into particles, their growth to the 20
accumulation mode size, and their activation as CCN.
4.2 Primary aerosols
POA emissions occur by bubble bursting formation of sea spray enriched with organic matter (Leck and Bigg, 2005; Keene et al., 2007) or biological particles (Aller et al., 2005) that can be identified under the microscope. When only the chemical characteri-25
ACPD
12, 3655–3694, 2012Biogenic influence on cloud microphysics over
the global ocean
A. Lana et al.
Title Page
Abstract Introduction
Conclusions References
Tables Figures
◭ ◮
◭ ◮
Back Close
Full Screen / Esc
Printer-friendly Version Interactive Discussion
Discussion
P
a
per
|
Dis
cussion
P
a
per
|
Discussion
P
a
per
|
Discussio
n
P
a
per
|
that those small insoluble organic aerosols are the seeds onto which acidic gases condense, a process that may lead to their activation as CCN.
Our statistical analyses yielded a patchy distribution of the correlation between the POAflux andre (Fig. 1c), with large regions with non-significant and positive correla-tions. Even though the parameterization of the POAflux related it to the chlorophyll-a
5
concentration, just like that of the SOAflux, their seasonal patterns were very different because of the larger influence wind speed has on the POAflux calculation. As a re-sult, POA does not seem to play a role in driving the variability of cloud droplet size over most of the ocean. This is a little surprising, because water insoluble organic compounds have been seen to account for a dominant fraction of the organic mass of 10
marine aerosols (Facchini et al., 2008; Russell et al., 2010). A possible explanation would be the low hygroscopicity of most primary particles, including microorganism cells, unless they get internally mixed with hygroscopic condensates (Leck and Bigg, 2005). Another explanation would lie on the parameterization itself, where POA pre-cursors are assumed to occur in some degree of proportionality to the chlorophyll-a
15
concentration. This is a reasonable assumption for biological particles such as viruses, bacteria and the smallest microalgae, but it is harder to predict for the algal polymers, mainly carbohydrates, that dominate the submicron aerosols (Facchini et al., 2008; Russell et al., 2010; Orellana et al., 2011). It is known that this type of algal exudates do not only depend on total phytoplankton biomass but also on their species composi-20
tion, physiological status and productivity (Verdugo et al., 2004). As in the case of SOA precursors, hence, we should better know the geographic and seasonal distribution of POA-forming material and their environmental drivers before we can fully assess the significance of our results.
The sea salt lifted into the atmosphere with sea spray has long been recognized 25
ACPD
12, 3655–3694, 2012Biogenic influence on cloud microphysics over
the global ocean
A. Lana et al.
Title Page
Abstract Introduction
Conclusions References
Tables Figures
◭ ◮
◭ ◮
Back Close
Full Screen / Esc
Printer-friendly Version Interactive Discussion
Discussion
P
a
per
|
Dis
cussion
P
a
per
|
Discussion
P
a
per
|
Discussio
n
P
a
per
|
Smith, 1993; Lewis and Schwartz, 2004; Caffrey et al., 2006; Pierce and Adams, 2006), our correlation analysis shows that they do not seem to play an important direct role in driving the variability of cloud microphysics. At least, not the expected role, since the SSflux is positively or non-significantly correlated torein most of the sea salt rich oceanic atmosphere (Fig. 1d). This is consistent with the findings of Vallina et al. (2006) 5
that sea salt contributes a large share of CCN numbers but does not drive their season-ality over the Southern Ocean. Our parameterization of the SSflux relates it exclusively to wind speed. Some modeling studies related the emission rate also with sea surface temperature (Caffrey et al., 2006; Pierce and Adams, 2006; Korhonen et al., 2008) and confirmed the large contribution of sea salt to regional monthly mean CCN numbers 10
in the marine boundary layer. It is important to notice that models are only as good as our knowledge of the underlying mechanisms is, and results are difficult to validate because of the inherent difficulties associated with conducting in situ measurements of SS flux and realistically reproducing sea surface conditions in the laboratory. As for the POA, the influence of sea salt on the seasonal variability of cloud microphysics seems 15
poor but remains uncertain.
5 Conclusions
Our correlation analyses at both the global and the regional scales and over a 9 yr pe-riod provide a framework for potentially causal relationships between marine aerosol source strengths and cloud microphysics. We have shown that the weekly flux of DMS 20
emission and oxidation is significantly anti-correlated with cloud droplet size in most of the clean atmosphere over the mid and high latitude oceans. A similar result is found for the emission and oxidation of marine precursors of secondary organic aerosol, yet with differences in the subtropics. A remarkable result is the strong negative correla-tions found over the Southern Ocean, in the cleanest of current atmospheric regions. 25
ACPD
12, 3655–3694, 2012Biogenic influence on cloud microphysics over
the global ocean
A. Lana et al.
Title Page
Abstract Introduction
Conclusions References
Tables Figures
◭ ◮
◭ ◮
Back Close
Full Screen / Esc
Printer-friendly Version Interactive Discussion
Discussion
P
a
per
|
Dis
cussion
P
a
per
|
Discussion
P
a
per
|
Discussio
n
P
a
per
|
cloud droplet size, and in the case of the Southern Ocean they even show positive cor-relations, contrary to what would be expected if primary aerosols were direct drivers of cloud microphysics. Therefore we conclude that the observed patterns are consis-tent with a poconsis-tential primary role of biogenic secondary aerosol precursors (DMS and organic volatiles) in determining the number and size of cloud droplets and, hence, 5
having an impact on cloud radiative properties. Conversely, primary aerosols, even though they contribute to aerosol mass, do not seem to act as primary drivers of CCN numbers and droplet size.
Our efforts to distinguish among marine aerosol sources and types, deal with their distinct dynamics and seasonalities, and identify their areas of influence with respect 10
to continental aerosols, overall represent a step forward towards the comprehension of aerosol-cloud interactions over the oceans. On first sight, however, our approach seems grounded on one major conceptual simplification: aerosol sources each con-tribute a proportion of an external mixture of marine aerosols, and the ones identified here to be the best coupled to cloud microphysics (namely the secondary aerosols) 15
are hence the most climatically active through the indirect effects. A deeper interpre-tation of our data should take into account that most marine aerosols occur as internal mixtures from different sources and nature. Electron microscopy observations of ma-rine aerosols depict a variety of heterogeneous particle constructions, with e.g. organic polymers internally mixed with sulfuric acid or sea salt crystals (Leck and Bigg, 1999, 20
2005, 2008). The view that new aerosols and CCN are formed by homogeneous nu-cleation and further condensation of vapors is too simplistic; H2SO4 nucleation is en-hanced by organics and ammonium, and growth to CCN activation occurs by organic condensation (e.g., Hegg et al., 1990; Covert et al., 1992; Kulmala et al., 2004; Zhang et al., 2004), but also tiny primary aerosols get activated as CCN by condensational 25
ACPD
12, 3655–3694, 2012Biogenic influence on cloud microphysics over
the global ocean
A. Lana et al.
Title Page
Abstract Introduction
Conclusions References
Tables Figures
◭ ◮
◭ ◮
Back Close
Full Screen / Esc
Printer-friendly Version Interactive Discussion
Discussion
P
a
per
|
Dis
cussion
P
a
per
|
Discussion
P
a
per
|
Discussio
n
P
a
per
|
trace gas oxidation products in CCN activation of small secondary or primary particles (Andreae and Rosenfeld, 2008).
A better knowledge of the biological and biogeochemical mechanisms that lead to the production of primary and secondary organic aerosol precursors, and particularly their spatio-temporal dynamics, is urgently needed if we are to better understand and 5
parameterize their emission strengths. New information may change our current per-ception of the most important players in aerosol-cloud interactions in the pristine marine atmosphere that still covers a considerable area of our planet.
Acknowledgements. The authors wish to thank each of the individual contributors that gener-ously submitted their data to the Global Surface Seawater Dimethylsulfide Database (GSSDD), 10
and to J. E. Johnson and T. S. Bates (NOAA/PMEL) for the maintenance of the GSSDD. We thank the NCEP/NCAR Reanalysis Project for the production and free distribution of the SST and wind speed data used in the present work. The authors would also like to thank the Sea-WiFS and MODIS-Atmosphere projects for the atmospheric variables and chlorophyl-a con-centrations values. Financial support was provided by the Spanish Ministry of Science and 15
Innovation through the projects MIMOSA, PRISMA, Malaspina 2010, and a Ph.D. studentship to A. L.
References
Albrecht, B. A.: Aerosols, cloud microphysics, and fractional cloudiness, Science, 245, 1227– 1230, 1989.
20
Andreae, M. O. and Rosenfeld, D.: Aerosol-cloud-precipitation interactions. Part 1. The nature and sources of cloud-active aerosols, Earth Sci. Rev., 89, 13–41, 2008.
Aller, J. Y., Kuznetsova, M. R., Jahns, C. J., and Kemp, P. F.: The sea surface microlayer as a source of viral and bacterial enrichment in marine aerosols, J. Aerosol Sci., 36, 801–812, 2005.
25
ACPD
12, 3655–3694, 2012Biogenic influence on cloud microphysics over
the global ocean
A. Lana et al.
Title Page
Abstract Introduction
Conclusions References
Tables Figures
◭ ◮
◭ ◮
Back Close
Full Screen / Esc
Printer-friendly Version Interactive Discussion
Discussion
P
a
per
|
Dis
cussion
P
a
per
|
Discussion
P
a
per
|
Discussio
n
P
a
per
|
Baker, A., Turner, S., Broadgate, W., Thompson, A., McFiggans, G., Vesperini, O., Nightingale, P., Liss, P., and Jickells, T.: Distribution and sea-air fluxes of biogenic trace gases in the Eastern Atlantic Ocean, Global Biogeochem. Cy., 14, 871–886, 2000.
Barrie, L. A., Yi, Y., Leaich, W. R., Lohmann, U., Kasibhatla, P., Roelofs, G.-J., Wilson, J., McGovern, F., Benkovitz, C., Melieres, M. A., Law, K., Prospero, J., Kritz, M., Bergmann, D., 5
Bridgeman, C., Chin, M., Christensen, J., Easter, R., Feichter, J., Land, C., Jeuken, A., Kjellstrom, E., Koch, D., and Rasch, P.: A comparison of large-scale atmospheric sulphate aerosol models (COSAM): overview and highlights, Tellus B, 53, 615–645, 2001.
Bauer, H., Giebl, H., Hitzenberger, R., Kasper-Giebl, A., Reischl, G., Zibuschka, F., and Puxbaum, H.: Airborne bacteria as cloud condensation nuclei, J. Geophys. Res.-Atmos., 10
108, 4658, doi:10.1029/2003JD003545, 2003.
Bonsang, B., Polle, C., and Lambert, G.: Evidence for marine production of isoprene, Geophys. Res. Lett., 19, 1129–1132, doi:10.1029/92GL00083, 1992.
Bonsang, B., Aarbaoui, A. A., and Sciare, J.: Diurnal variation of non-methane hydrocarbons in the subantarctic atmosphere, Environ. Chem., 5, 16–23, doi:10.1071/EN07018, 2008. 15
Bowers, R. M., Lauber, C. L., Wiedinmyer, C., Hamady, M., Hallar, A. G., Fall, R., Knight, R., and Fierer, N.: Characterization of airborne microbial communities at a high-elevation site and their potential to act as atmospheric ice nuclei, Appl. Environ. Microb., 75, 5121–5130, 2009.
Broadgate, W., Liss, P., and Penkett, S.: Seasonal emissions of isoprene and other reactive 20
hydrocarbon gases from the ocean, Geophys. Res. Lett., 24, 2675–2678, 1997.
Brown, R. M., Larson, D. A., and Bold, H. C.: Airborne algae: their abundance and heterogene-ity, Science, 143, 583–585, 1964.
Caffrey, P. F., Hoppel, W. A., and Shi, J. J.: A one-dimensional sectional aerosol model inte-grated with mesoscale meteorological data to study marine boundary layer aerosol dynam-25
ics, J. Geophys. Res., 111, D24201, doi:10.1029/2006JD007237, 2006.
Carlton, A. G., Wiedinmyer, C., and Kroll, J. H.: A review of Secondary Organic Aerosol (SOA) formation from isoprene, Atmos. Chem. Phys., 9, 4987–5005, doi:10.5194/acp-9-4987-2009, 2009.
Cavalli, F., Facchini, M. C., Decesari, S., Mircea, M., Emblico, L., and Fuzzi, S..: Advances in 30
characterization of size-resolved organic matter in marine aerosol over the North Atlantic, J. Geophys. Res., 109, D24215, doi:10.1029/2004JD005137, 2004.