www.atmos-chem-phys.net/12/7977/2012/ doi:10.5194/acp-12-7977-2012
© Author(s) 2012. CC Attribution 3.0 License.
Chemistry
and Physics
Potential for a biogenic influence on cloud microphysics over
the ocean: a correlation study with satellite-derived data
A. Lana1, R. Sim´o1, S. M. Vallina2, and J. Dachs3 1Institut de Ci`encies del Mar, ICM, CSIC, Barcelona, Spain 2EAPS, MIT, Cambridge, Massachusetts, USA
3Department of Environmental Chemistry, IDAEA, CSIC, Barcelona, Spain
Correspondence to: A. Lana ([email protected]) and R. Sim´o ([email protected])
Received: 5 January 2012 – Published in Atmos. Chem. Phys. Discuss.: 2 February 2012 Revised: 31 July 2012 – Accepted: 5 August 2012 – Published: 6 September 2012
Abstract. Aerosols have a large potential to influence cli-mate through their effects on the microphysics and optical properties of clouds and, hence, on the Earth’s radiation bud-get. Aerosol–cloud interactions have been intensively stud-ied in polluted air, but the possibility that the marine bio-sphere plays an important role in regulating cloud bright-ness in the pristine oceanic atmosphere remains largely un-explored. We used 9 yr of global satellite data and ocean cli-matologies to derive parameterizations of the temporal vari-ability of (a) production fluxes of sulfur aerosols formed by the oxidation of the biogenic gas dimethylsulfide emit-ted from the sea surface; (b) production fluxes of secondary organic aerosols from biogenic organic volatiles; (c) emis-sion fluxes of biogenic primary organic aerosols ejected by wind action on sea surface; and (d) emission fluxes of sea salt also lifted by the wind upon bubble bursting. Series of global monthly estimates of these fluxes were correlated to series of potential cloud condensation nuclei (CCN) numbers derived from satellite (MODIS). More detailed comparisons among weekly series of estimated fluxes and satellite-derived cloud droplet effective radius (re) data were conducted at locations
spread among polluted and clean regions of the oceanic at-mosphere. The outcome of the statistical analysis was that positive correlation to CCN numbers and negative correla-tion to re were common at mid and high latitude for
sul-fur and organic secondary aerosols, indicating both might be important in seeding cloud droplet activation. Conversely, primary aerosols (organic and sea salt) showed widespread positive correlations to CCN only at low latitudes. Correla-tions to re were more variable, non-significant or positive,
suggesting that, despite contributing to large shares of the
marine aerosol mass, primary aerosols are not widespread major drivers of the variability of cloud microphysics. Vali-dation against ground measurements pointed out that the pa-rameterizations used captured fairly well the variability of aerosol production fluxes in most cases, yet some caution is warranted because there is room for further improvement, particularly for primary organic aerosol. Uncertainties and synergies are discussed, and recommendations of research needs are given.
1 Introduction
the oceans away from continental influence (Twomey, 1977; Andreae and Rosenfeld, 2008).
Among the natural climate-regulation processes hypoth-esized to act through aerosol–cloud interactions, the most notorious was postulated as the CLAW hypothesis (Charl-son et al., 1987). CLAW suggested that oceanic emissions of dimethylsulfide (DMS) to the atmosphere could constitute a climate buffer through the regulation of the amount of solar radiation that reaches the Earth surface. DMS is formed in the surface ocean as a by-product of food-web processes and plankton ecophysiology (Sim´o, 2001; Stefels et al., 2007). Being a volatile compound, DMS is emitted from the ocean to the atmosphere where it is oxidized, mainly by OH rad-icals, to form H2SO4, non-sea-salt SO−42 and other
hygro-scopic products that may nucleate into particles and grow to act as cloud condensation nuclei (CCN) or seeds for cloud drop formation (Andreae and Rosenfeld, 2008). If planktonic production of DMS increases with increasing temperature or sunlight, and its emission eventually reduces solar radi-ation, DMS might be the core of a negative (self-regulating) feedback between the marine biosphere and climate (Charl-son et al., 1987). The cross-discipline and cross-scale na-ture of the CLAW hypothesis has stimulated research in and across fields as apparently distant as plankton ecophysiology, air–sea gas exchange and aerosol–cloud interactions (Sim´o, 2001). Even though some key aspects of the hypothesis have met strong support, notably through regional evidences for coupling between phytoplankton blooms and cloud micro-physics and optics (Meskhidze and Nenes, 2006; Kr¨uger and Graßl, 2011), and global evidence for the sensitivity of DMS production to underwater light intensity (Vallina and Sim´o, 2007; Lana et al., 2012), the existence and significance of the proposed feedback loop as a climate buffer remains elusive (Levasseur, 2011) and has been strongly challenged (Quinn and Bates, 2011).
Despite DMS having drawn much of the attention because of the CLAW hypothesis, there might be other secondary or-ganic aerosol (SOA) precursors (as yet largely unidentified) that are produced by similar mechanisms and might there-fore play analogous roles (Liss and Lovelock, 2007). Ma-rine SOA precursors are natural volatile organic compounds produced by plankton and photochemical reactions all over the oceans. Their emissions are, however, poorly constrained (Dachs et al., 2005; Sim´o, 2011; J. Dachs, unpublished data). Initially it was suggested that biogenic isoprene fluxes could account for a significant fraction of SOA (Palmer and Shaw, 2005; Meskhidze and Nenes, 2006), as occurs over densely vegetated land. Recently, a number of other SOA precur-sors have been identified, namely iodomethanes, amines, monoterpenes and non-methane hydrocarbons (Sim´o, 2011; and references therein). They cause increases in aerosol num-ber and organic matter during periods of higher biological productivity (O’Dowd et al., 2004; Vaattovaara et al., 2006; M¨uller et al., 2009). With these emissions being poorly quan-tified, combinations of modeling and observations indicate
that known emission fluxes of marine volatiles cannot ac-count for organic aerosol concentrations measured over the oceans, and important fluxes of primary organic aerosols (POA) are to be invoked (e.g., Arnold et al., 2009; Rinaldi et al., 2010). Actually, current estimates of POA and SOA precursor fluxes fall short at predicting organic aerosol levels through atmospheric models (Heald et al., 2005), thus call-ing for the existence of hitherto unaccounted marine sources of organic carbon. It should be noted that emissions of hy-drophobic semi-volatile chemicals that accumulate in the sea surface microlayer and are released through volatilization or in association with sea-spray, such as alkanes and polycyclic aromatic hydrocarbons (Nizzetto et al., 2008; J. Dachs, un-published data), have been overlooked as aerosol precursors. Sea-spray is ejected into the atmosphere by the action of wind speed on the surface of the ocean. It is generated by bubble bursting and carries sea salt together with or-ganic particles, both of which may act as CCN once in the atmosphere. These sea-spray POA are composed of virus, bacteria, biogenic polymeric and gel-forming organic ma-terial, mainly carbohydrates, and associated semi-volatiles (Brown et al., 1964; Bauer et al., 2003; Aller et al., 2005; Facchini et al., 2008b; Bowers et al., 2009; Hawkings and Russell, 2010; Russell et al., 2010; Orellana et al., 2011). Being all of biological origin, it is likely that POA precur-sors are somewhat proportional to plankton biomass and its most commonly used indicator, the chlorophyll a concen-tration. Indeed, the scarce existing measurements of POA in small marine aerosols (e.g., O’Dowd et al., 2004; Leck and Bigg, 2007) suggest that they are more abundant in air masses downwind of chlorophyllarich waters, particularly if strong winds enhance the lift of sea spray. The biological POA source may be reinforced by the action of surfactants exuded by phytoplankton, which lower surface tension and may facilitate the ejection of small aerosols.
Sea salt (SS) is also ejected off the sea surface as sea-spray. It has an important presence in the marine atmosphere, con-tributing 44 % of the global aerosol optical depth (O’Dowd and de Leeuw, 2007). Sea salt was overlooked in the original CLAW hypothesis because it was thought to be composed of too few and too big particles to have a significant influence in cloud microphysics despite their high hygroscopicity (Le Qu´er´e and Saltzman, 2009). Today, however, it is known that a non-negligible proportion of sea salt particles belong to the small size fraction that makes them effective as CCN (An-dreae and Rosenfeld, 2008; de Leeuw et al., 2011); moreover, sea salt aerosols play a role in the atmospheric chemistry of gaseous aerosol precursors (von Glassow, 2007).
widespread occurrence of continental aerosols in the marine atmosphere, co-existing with marine aerosols in internal and external mixtures (Andreae and Rosenfeld, 2008). Any at-tempt to evaluate the role of the marine biosphere in cloud formation and the radiative budget on a global scale must therefore be able to distinguish between biotic and abiotic, and between anthropogenic and continental sources of the marine aerosols, and describe their geographical, temporal, concentration and size distributions.
In the present paper, we make use of satellite data and ocean climatologies to parameterize the variability in the flux rates of aerosol formation from ocean-leaving DMS and SOA precursors. We also parameterize the emission fluxes of POA and sea salt from the surface ocean. These aerosol sources are compared with the satellite-derived amount of potential CCN and size of cloud droplets on both a monthly and weekly bases over a 9-yr period. Temporal correlations at both the global scale and representative locations are analyzed as a means to assess the potential role of each marine aerosol source in driving the variability of cloud microphysics.
2 Data and methodology
2.1 Biogenic sulfur aerosol flux
The global ocean DMS concentration data used in this study is the L10 DMS climatology (Lana et al., 2011), which con-sists of global monthly maps of concentrations distributed in 1◦×1◦latitude-longitude pixels. This climatology, an up-date of that from 1999 (Kettle et al., 1999), was constructed using exclusively the surface DMS concentration measure-ments (approx. 47 000) available in the Global Surface Sea-water DMS database (GSSDD), maintained at the NOAA-PMEL (http://saga.pmel.noaa.gov/dms) and fed with contri-butions of individual scientists from all over the world.
Ocean-to-atmosphere mass emission fluxes (FDMS)were
computed with the climatological surface DMS concentra-tions and the corresponding gas transfer coefficients, which were parameterized taking into account both the water and the air side resistances, as described in McGillis et al. (2000). The parameterization used for the water side DMS gas transfer coefficient was that suggested by Nightingale et al. (2000), corrected to the Schmidt number of DMS accord-ing to Saltzman et al. (1993). The air side transfer coefficient calculation was based on the neutral stability water vapour bulk transfer coefficients from Kondo (1975). The computa-tion of the emission flux also considers the sea surface tem-perature (SST) and the non-linear influence of wind speed on air-water mass transfer coefficients.
Monthly global, 1◦×1◦ climatologies of SST and wind speed were obtained from the NCEP/NCAR reanalysis project (http://www.esrl.noaa.gov) for the period 1978–2008, as most of the DMS data available in the database are from that period. Because the water side gas transfer
coef-ficient has a nonlinear dependence on wind speed, the use of monthly averaged wind speeds introduces a bias into the flux calculation. The flux was corrected for this effect assuming that instantaneous winds follow a Weibull distribution, us-ing the approach of Sim´o and Dachs (2002). When a multi-year weekly series ofFDMSwas required, it was calculated
from deconvoluted, climatological monthly seawater DMS concentration and weekly wind speed and SST data.
To compute a proxy of DMS mass oxidation fluxes in the atmosphere, we followed the same approach as Vallina et al. (2006). The hydroxyl radical (OH) is the main atmo-spheric DMS oxidant (Savoie and Prospero, 1989; Chin et al., 2000; Barrie et al., 2001; Kloster et al., 2006). Daytime DMS oxidation initiated by OH produces, among other prod-ucts, aerosol-forming methanesulfonic acid (MSA), sulfuric acid and its corresponding anion non-sea-salt sulfate (nss-SO−42). Therefore, the amount of DMS-derived aerosols that can act as CCN depends not only on the DMSflux but also on OH concentrations. We used a monthly global distribu-tion of OH concentradistribu-tion data in the marine boundary layer (MBL) obtained from the GEOS-CHEM model run by the Atmospheric Chemistry Group at Harvard University for the year 2001 (Fiore et al., 2003).
The potential source function for CCN-forming DMS ox-idation can be parameterized as
γDMSflux=γ·FDMS, (1)
whereFDMS is the ocean-to-atmosphere emission flux and
γ is a dimensionless parameter varying between 0 a 1 that gives the efficiency of DMS oxidation as function of the ratio between OH andFDMS, following an equation of the form
γ=x/(kS+x), (2)
where
x=OH/FDMS (3)
andkS is a constant that corresponds to the value ofx that gives agof 0.5 (a DMS oxidation efficiency of 50 %).
In the absence of OH (or very low OH) concentrations re-spective to theFDMS, most (or at least part) of theFDMS
can-not be converted to CCNDMS(in these situationsγ will be
low). On the other hand, if OH concentrations are in excess, all theFDMScan be oxidized to CCNDMS(in these situations
γwill be close to one). The form of the equation accounts for an asymptotic behavior; as the availability of OH for DMS oxidation (the variablex) increases, a higher fraction of the
FDMScan be converted to CCNDMS, approaching
asymptot-ically the upper limit of gamma (for which allFDMSis
con-verted to CCNDMS). Therefore,γDMSflux (in µg m−2d−1)
gives the amount of biogenic sulfur potentially available for CCN production. Following Vallina et al. (2007), we took the value of kS derived from the annual averages of OH,
al. (2007) validated the capability of this parameterization to reproduce the seasonality of DMS oxidation by comparing it against monthly series of MSA concentrations in aerosols at 15 aerosol sampling stations of the world oceans. MSA is the most appropriate for validation purposes because it is formed exclusively from DMS oxidation, whereas nss-SO4 results from DMS, combustion sources and volcanic
emissions altogether. For comparison purposes, we used the monthly aerosol MSA climatologies of Mace Head (Ire-land), Hedo Okinawa (Japan), Palmer Station (Antarctica), Prince Edward Island (Southern Ocean) and Shemya Island (Aleutians) from the University of Miami network of aerosol sampling stations (Chin et al., 2000), and monthly rainwa-ter MSA concentrations at Amsrainwa-terdam Island (Sciare et al., 1998).
2.2 Marine SOA flux
We parameterized the variability of the SOA production rate with the same approach used for the DMS-derived aerosol, computing the emission flux and the oxidation rate of its precursor. Unlike biogenic sulfur aerosols, however, marine SOA has a number of potential precursors, namely a myr-iad of volatile and semi-volatile organic compounds (VOCs) not yet fully characterized, which includes isoprene (Bon-sang et al., 1992), terpenes (Yasaa et al., 2008), amines (Fac-chini et al., 2008a), alkylnitrates (Chuck et al., 2002), alka-nes (J. Dachs, unpublished data), among others (Bonsang et al., 2008). Since no global climatology of surface ocean VOCs exists, and because both the air-sea transfer coefficient and the atmospheric oxidation are dependent on the chem-ical composition of the precursor mix, which is unknown and probably very variable, an accurate parameterization is not possible. To overcome this limitation, we considered that SOA-forming VOCs are closely associated with and propor-tional to the concentration of chlorophylla(Chla; Baker et al., 2000). We took isoprene as a surrogate of SOA precur-sors, and parameterized the emissions of total volatile and semi-volatile precursors as if it was isoprene. Isoprene con-centration in the surface ocean has been found roughly pro-portional to Chla, at least much more so than that of DMS (Baker et al., 2000; Bonsang et al., 1992; Broadgate et al., 1997; Palmer and Shaw, 2005). Therefore, we computed the SOA-forming VOCs concentration in surface seawater from the Chl a concentration. The weekly and monthly Chl a
data for the period 2001–2009 were obtained from the Sea-WiFS Project (GSFC, NASA) and transformed into 1◦×1◦ latitude-longitude spatial resolution.
Then, we computed the VOC emission flux (µg m−2d−1)
as
FVOC=kw(u,SST)·Chla·b, (4) wherekw is the transfer coefficient of isoprene, calculated following Palmer and Shaw (2005), andb is an unit con-version constant (i.e., a proportionality constant between the
concentrations of Chla and SOA-forming VOCs). SST and wind speed (u) climatologies were derived from the same data sources as for theFDMSfor the 2001–2009 period.
VOC oxidation into SOA (SOAflux, in µg m−2d−1)was computed similarly to the γDMSflux, assuming OH is the main oxidant, which is the case for isoprene and most organ-ics at the low NOxlevels of the marine atmosphere (Kroll et
al., 2006; Carlton et al., 2009):
SOAflux=γ·FVOC (5)
Where
γ=x/(kS+x) (6)
and
x=OH/FVOC. (7)
2.3 Marine primary aerosol fluxes: sea salt and POA
We parameterized the flux of accumulation mode sea spray particles ejected from the sea surface by bubble bursting. We focused on the accumulation mode particles (0.1–1 µm in di-ameter) because these are the ones abundant enough to act as CCN at the top of the MBL (Andreae and Rosenfeld, 2008). They are typically constituted of internal mixtures of sea salt and organics (Leck and Bigg, 2005). The emis-sion flux of submicron-sized sea spray particles (FN(SSA),
in 106part m−2s−1)was parameterized as a function of the wind speed, following the revision of Geever et al. (2005) proposed by O’Dowd et al. (2008):
FN(SSA)=(1.854×10⁻³)·u222.706. (8)
This, in 106part m−2d−1, becomes
FN(SSA)=160.19·u222.706,
whereu22is the wind speed at 22 m above the sea surface. It
was calculated from the wind speed at 10 m, derived from the NCEP/NCAR reanalysis project for 2001–2009, using the equation formulated by Hsu et al. (1994).
To convert this particle flux into mass fluxes of submicron-sized sea salt and organics, we first converted it into a vol-ume flux (FV(SSA), in 106µm3m−2d−1) by considering that, at temperate temperatures, accumulation mode particle num-bers are dominated by particles of 300 nm size (diameter), and their source function is about the mean of that of the ac-cumulation mode particles (O’Dowd and de Leew 2007).
FV(SSA)=FN(SSA)·(particle volume)
=FN(SSA)·0.01414. (9)
The mass fraction of organics in the sea spray (OMSSA)was
300 nm. We used the Chl a and wind speed climatologies mentioned above. The mass fraction of sea salt in the sea spray (OSSSA) is the complementary to the fraction of
or-ganics, i.e., (1−OMSSA).
Considering that the density of organics is 1 g cm−3 and that of sea salt is 2.165 g cm−3 (Gantt et al., 2011), the mass flux of sea spray in the accumulation mode (FSSA, in
µg m−2d−1)is
FSSA=FV(SSA)·(2.165−1.165 OMSSA). (10)
Therefore, the mass fluxes of POA (FPOA, in µg m−2d−1)
and sea salt (FSS, in µg m−2d−1)are
FPOA=POAflux=FSSA·OMSSA (11)
FSS=SSflux=FSSA·(1−OMSSA). (12) 2.4 Cloud condensation nuclei (CCN) numbers and
cloud properties
Column-integrated CCN number, liquid cloud droplet ef-fective radius (re, ratio of third to second moment of the
satellite-derived cloud drop size distribution), liquid cloud water path (LWP) and cloud top pressure (CTP) data were obtained from the Level 3 MODIS Terra Collection 5 at the NASA Goddard Space Fight Center Level 1 and Atmosphere Archive Distribution System (DAADS). The data resolution is 1◦, with a quality assurance of 1 km. Both weekly and monthly data for the 2001–2009 period were used.
2.5 Data comparison and correlations
Temporal co-variations between paired variables (namely aerosol fluxes and CCN numbers orre)were explored by the
running-window correlation method (Vallina et al., 2006). For each month and each 1◦×1◦ position, we substituted the value of the targeted variable for the average of the 49 values of a 7◦×7◦ window located around the position. Then we constructed the monthly series of the variable over the 2001–2009 period (9 yr, 108 months) for each 1◦×1◦ position. With these 108 data for each variable for each 1◦×1◦ pixel we computed the Spearman’s correlation be-tween paired variables, obtaining a global map of correlation coefficients. Correlations were significant at 95 % confidence level approximately when|ρ|>0.2.
For the case studies, we averaged the computed aerosol fluxes and the satellite-derivedre values over the entire 40–
60◦S latitudinal band (Southern Ocean), or over a 7◦×7◦
window located right upwind of each aerosol-sampling sta-tion, according to the predominant wind direction. Weekly data series of paired variables were compared throughout the 9 yr (414 weeks) by calculating the Spearman’s rank correla-tion coefficientρ. Correlations were significant at 95 % con-fidence level approximately when|ρ|>0.1. We repeated the computation after eliminating all pixels with a LWP beyond
a 15 g m−2range in the lower quartile. We repeated it again
after deleting the pixels with CTP higher than 680 hPa, and still a third time using only the pixels that fulfilled the fol-lowing two conditions: LWP in the narrow low range and CTP>680 hPa. The time series were plotted in standardized form (i.e., subtracting the mean and dividing by the standard deviation).
When, for validation purposes, DMS oxidation flux data were to be compared with in situ aerosol MSA concentra-tions, they were collapsed into monthly means over one cli-matological year by simple averaging. The same procedure was employed for comparing SOAflux, POAflux or SSflux data with aerosol mass concentrations at sampling stations. In the case of the validation against the oceanic transect, SOAflux and POAflux were computed in running 7◦×7◦ windows along the transect for the same month and year of the ship-based data.
3 Results
3.1 Global maps of seasonal correlations between aerosol fluxes and CCN numbers
To investigate if there is a widespread seasonal regional re-lationship between secondary aerosol precursors or primary aerosols ejected from the ocean surface and the number centration of particles potentially acting as CCN, we con-structed global maps of correlation coefficients of monthly data over the period 2001–2009 (Fig. 1). CCN number con-centrations were actually those provided by MODIS, i.e., columnar numbers of particles in the accumulation mode size fraction (Remer et al., 2005), which can be regarded as “po-tential CCN”.
3.1.1 DMS oxidation flux versus CCN
Figure 1a shows that there is a strong positive correlation between the DMS oxidation flux (γDMSflux) and satellite-derived CCN over temperate and high latitudes and in the near-equatorial South Atlantic, South Indian and North Pa-cific oceans. A uniform positive correlation is particularly remarkable in the southern oceans south of 30◦S. Positive correlation implies that the higher the DMS oxidation flux in the atmosphere, such that there is larger potential for bio-genic sulfur aerosol formation, the larger the number of par-ticles acting as CCN. Indeed, over most of the global oceans
γDMSflux increases from winter to summer as a result of a generalized increase of the seawater DMS concentration (Lana et al., 2011) and a concomitant increase in the OH concentration in the marine boundary layer (Vallina et al., 2006).
Fig. 1. Global maps of Spearman’s rank correlation coefficients between monthly series (2001–2009,n=108) of MODIS-derived CCN number concentrations and the parameterized oceanic fluxes of: (a) DMS emission and oxidation in the atmosphere (γDMSflux), (b) SOA formation in the atmosphere (SOAflux), (c) POA emission (POAflux) and (d) sea salt emission (SSflux). White areas show non-significant correlations.
pollution sources heavily influenced by continental aerosols and particularly by small combustion-derived aerosols (Ju-rado et al., 2008), which are as good as natural marine aerosols as CCN. The seasonality of combustion aerosols may be different from that of marine biogenic aerosols, and varies from region to region. Besides, the subtropical oceans around 20◦ are, among the large biogeochemical provinces (Longhurst, 2007), those with the lowest DMS concentra-tions all year round (Lana et al., 2011) and a weak seasonal-ity. Since our statistical analysis is mainly based on seasonal correlations, any uncertainty associated with the monthly variables can generate a noise with larger amplitude than the underlying seasonality, thus affecting the correlation coeffi-cient. Overall, the correlation map of Fig. 1a is similar to that obtained by Vallina et al. (2007) using a previous version of the DMS concentration database.
3.1.2 SOA precursors versus CCN
The correlation map between the chlorophyll a associated SOAflux and CCN (Fig. 1b) is quite similar to that of the
γDMSflux (Fig. 1a), with more positive correlations in the subtropics. In general, positive correlation dominates, par-ticularly at latitudes higher than 40◦, and non-significant or negative correlation occur sparsely at lower latitudes. Im-portant differences occur in the South Atlantic and Indian Oceans between 20◦S and 40◦S, where the SOAflux ex-hibits mostly positive correlation while theγDMSflux gives non-significant or negative correlation. The correlation turns slightly negative in continental air-influenced regions such as off Southern Asia, Central America and eastern North Amer-ica.
3.1.3 Sea spray aerosol versus CCN
Unlike those ofγDMSflux and SOAflux, the correlation of marine submicron primary organic aerosols (POAflux) to CCN does not show a dominant pattern (Fig. 1c). Correlation coefficients change from positive to negative in broad latitu-dinal bands. North of 40◦N, correlations are mostly nega-tive. Between 30◦N and 30◦S, correlations are mostly posi-tive and similar to those of the SOAflux. There is a band of negative correlation around 40◦S, next to a band of positive correlation at 50–60◦S. Overall, correlations at higher lati-tudes are different, in some cases even opposite, from those of the SOAflux.
3.2 Weekly data correlation to cloud droplet size (re): case studies
If we are to explore the potential influence of marine aerosol emissions on cloud microphysics through their regulation of CCN number concentrations, cloud droplet size is a good candidate variable to use because it is provided by MODIS as the liquid cloud droplet effective radius (re, ratio of third
to second moment of the cloud drop size distribution, in µm). According to the indirect aerosol effect, variations in CCN numbers should have an opposite effect on droplet size for a given amount of liquid water (Twomey, 1977; Andreae and Rosenfeld, 2008); therefore, the existence and strength of negative correlations between aerosol fluxes andre will
tell us about the potential for a biogenic influence on clouds. Two important premises for the indirect effect to occur are: (a) that the examined clouds are low, i.e., potentially affected by ocean-leaving substances, and (b) that the liquid water content of clouds remains the same, otherwisere will vary
with cloud water. This precludes a global correlation anal-ysis like that that we did for CCN numbers, and prompts a closer examination of case studies.
We chose five regions of the ocean that represent different climate regimes and exhibit a range of quantitative influences of continental aerosol. The first region is the Southern Ocean as a whole (circumpolar). The other four case studies were defined as 7◦×7◦(latitude×longitude) windows upwind of Amsterdam Island (South Indian), Shemya Island (subarc-tic North Pacific), Mace Head-Ireland (temperate northeast Atlantic) and Cape Hedo-Okinawa (temperate northwest Pa-cific). In all regions we computed the Spearman’s rank corre-lations between weekly series of MODISre and
parameter-izedγDMSflux, SOAflux, POAflux and SSflux for the period 2001–2009.
3.2.1 Southern Ocean
Several authors have suggested that if a causal relation-ship between marine emissions and cloud microphysics oc-curs today, it should be most visible in the Southern Ocean (Meskhidze and Nenes, 2006; Kr¨uger and Graßl, 2011). The reason is that, due to the lack of continental land masses and large pollution sources, and due to the strong circum-polar winds, the Southern Ocean underlies one of the most pristine atmospheres on Earth, with the additional particu-larity of being rather uniform over a broad latitudinal band and all throughout longitudes. Further, the seasonalities of both marine productivity and aerosol and cloud variables are very marked and repeated over years. Indeed, strong positive correlations have been reported between CCN numbers and the DMS oxidation fluxes in the Southern Ocean (Vallina et al., 2007). Therefore, this region makes an interesting case study for a closer examination of correlations among marine aerosol emission and formation fluxes and cloud droplet size.
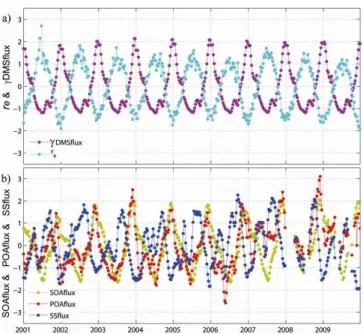
Fig. 2. Temporal evolution (2001–2009) of standardized values of (a) weekly satellite-derived re and γDMSflux; (b) weekly SOA flux, POA flux and SSflux averaged over the entire Southern Ocean (40–60◦S). Correlation coefficients are presented in Table 1.
Nine-years of averaged weekly series for γDMSflux, SOAflux, POAflux and SSflux data were correlated to av-eragere data over the full 40–60◦S band (Fig. 2, Table 1).
These was computed four times: (1) with all data avail-able; (2) weekly averaging only the 1◦×1◦pixels that had a liquid water path (LWP) within a narrow low range: 105– 120 g m−2; (3) weekly averaging only the pixels that had
clouds with top pressures >680 hPa, i.e., the low clouds; and (4) weekly averaging only the pixels that fulfilled the latter two conditions. Correlation coefficients for the four cases are presented in Table 1. Weeklyre(n∼400) showed
a clear annual pattern, repeated with great similarity year after year (Fig. 2a): larger cloud droplets in austral winter (May through August) and smaller in summer (December– February). The series of γDMSflux and SOAflux showed the opposite seasonality, with Spearman’s rank coefficients of correlation tore over−0.90 (n=409). This agrees with
the strong positive correlations found to CCN numbers in the region (Fig. 1a, b). When only low clouds and a narrow range of LWP were considered, correlations still rendered coeffi-cients over−0.80 (Table 1). These results indicate that the more DMS and organic volatiles are emitted into the atmo-sphere and oxidized, the smaller cloud droplets are, which is consistent with the potential role of marine biogenic trace gases in aerosol nucleation and growth.
Low negative correlation was found between the POAflux andre (ρ= −0.38, n=384; Fig. 2b), which decreased to
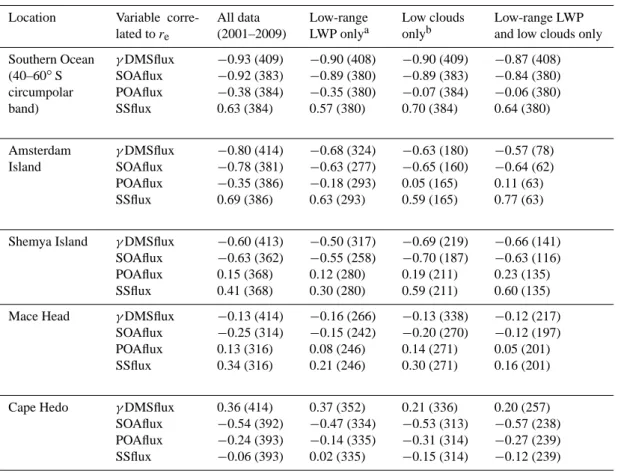
Table 1. Spearman’s rank coefficients of correlation between computed weekly marine aerosol production fluxes and satellite-derived cloud droplet radius (re)in case study regions. Values in parantheses are number of weeks with data.
Location Variable corre-lated tore
All data (2001–2009)
Low-range LWP onlya
Low clouds onlyb
Low-range LWP and low clouds only
Southern Ocean (40–60◦S circumpolar band) γDMSflux SOAflux POAflux SSflux
−0.93 (409) −0.92 (383) −0.38 (384) 0.63 (384)
−0.90 (408) −0.89 (380) −0.35 (380) 0.57 (380)
−0.90 (409) −0.89 (383) −0.07 (384) 0.70 (384)
−0.87 (408) −0.84 (380) −0.06 (380) 0.64 (380) Amsterdam Island γDMSflux SOAflux POAflux SSflux
−0.80 (414) −0.78 (381) −0.35 (386) 0.69 (386)
−0.68 (324) −0.63 (277) −0.18 (293) 0.63 (293)
−0.63 (180) −0.65 (160) 0.05 (165) 0.59 (165)
−0.57 (78) −0.64 (62) 0.11 (63) 0.77 (63)
Shemya Island γDMSflux SOAflux POAflux SSflux
−0.60 (413) −0.63 (362) 0.15 (368) 0.41 (368)
−0.50 (317) −0.55 (258) 0.12 (280) 0.30 (280)
−0.69 (219) −0.70 (187) 0.19 (211) 0.59 (211)
−0.66 (141) −0.63 (116) 0.23 (135) 0.60 (135)
Mace Head γDMSflux SOAflux POAflux SSflux
−0.13 (414) −0.25 (314) 0.13 (316) 0.34 (316)
−0.16 (266) −0.15 (242) 0.08 (246) 0.21 (246)
−0.13 (338) −0.20 (270) 0.14 (271) 0.30 (271)
−0.12 (217) −0.12 (197) 0.05 (201) 0.16 (201)
Cape Hedo γDMSflux SOAflux POAflux SSflux
0.36 (414) −0.54 (392) −0.24 (393) −0.06 (393)
0.37 (352) −0.47 (334) −0.14 (335) 0.02 (335)
0.21 (336) −0.53 (313) −0.31 (314) −0.15 (314)
0.20 (257) −0.57 (238) −0.27 (239) −0.12 (239)
aLWP within 15 g m−2, at the lower quartile of the annual variability (see text);bcloud top pressure>680 hPa.
γDMSflux and SOAflux, with minimal values in late sum-mer, maximal values in late spring, and a lot of intra- and interannual variability. The SSflux, though also variable, es-sentially followed the seasonality of the wind speed, which was in positive phase with that ofre(ρ=0.63; Fig. 2b,
Ta-ble 1).
3.2.2 Amsterdam Island region
Amsterdam Island (37.8◦S–77.5◦E) is located in the remote Southern Indian Ocean. As in the Southern Ocean,reshowed
a unimodal seasonal pattern with smaller droplets in sum-mer. The Spearman’s rank correlations of γDMSflux and SOAflux torewere strongly negative, with coefficients close
to−0.80 that decreased to ca.−0.60 when low clouds and a narrow LWP range (100–115 g m−2)were considered (Ta-ble 1). The POAflux showed low negative correlation with all data (ρ= −0.35), but non-significant for the restricted cloud conditions. The SSflux was positively correlated torein all
conditions (Table 1).
3.2.3 Shemya Island region
Shemya (52.42◦N–174.06◦E) is one of the Aleutian Islands located in the high-latitude central North Pacific. Savoie et al. (1989) analyzed aerosol composition and concluded that the station is influenced by continental aerosol sources dur-ing the winter, when the input from biological sources is minimal. In our analysis, re showed a less unimodal
sea-sonality than that in more pristine regions; in spite of this, weeklyγDMSflux and SOAflux were significantly inversely correlated to re (over −0.60), even when only low clouds
and low LWP (100–115 g m−2)were considered (Table 1). In these latter conditions, the POAflux was not significantly correlated tore, and the SSflux showed a positive correlation
(0.60, Table 1).
3.2.4 Mace Head region
Fig. 3. Same as Fig. 2 but for the 7◦×7◦regions upwind of (a) Amsterdam Island, and (b) Mace Head.
large part of the northest Atlantic receives important loads of continental aerosols, including urban and industrial sources, especially during spring and summer (Jurado et al., 2008). TheγDMSflux, SOAflux, POAflux and SSflux showed low correlations tore(Fig. 3b), which all turned non-significant
when only low clouds and low LWP (100–115 g m−2)were considered (Table 1). These results can be regarded as indica-tive of the large influence of continental aerosols on driving the variability of cloud microphysics in the region.
3.2.5 Cape Hedo region
Cape Hedo is the northern tip of Okinawa Island (26.9◦N–
128◦E), located between Japan main islands and Taiwan.
The station is downwind of important urban and industrial aerosol sources, and it is also affected by biomass burning and Asian dust transport (Takami et al., 2006). γDMSflux showed a weak positive correlation to re on a weekly
ba-sis, with their seasonalities lagged by a few weeks (Table 1). Among the other marine aerosol sources, only the SOAflux, but not POAflux and the SSflux, showed a significant neg-ative correlation tore, also when only low clouds and low
LWP (70–95 g m−2)were considered (Table 1).
3.3 Ground validations of aerosol flux seasonalities
Even though we used recently developed, state-of-the-art parameterizations of the aerosol source functions, they are based on local or experimental observations and, in all cases, they make a number of assumptions with associated uncer-tainties. Some kind of validation is, therefore, warranted. No data of particle formation or emission fluxes exist, let alone of type-segregated aerosols. Since we are not interested in validating the quantitative aspects of our computations (i.e., the absolute mass fluxes) but rather our capability to
com-pute their time evolution (mainly their seasonality), valida-tion can rely on aerosol component concentravalida-tions measured at ground sample stations in the ocean.
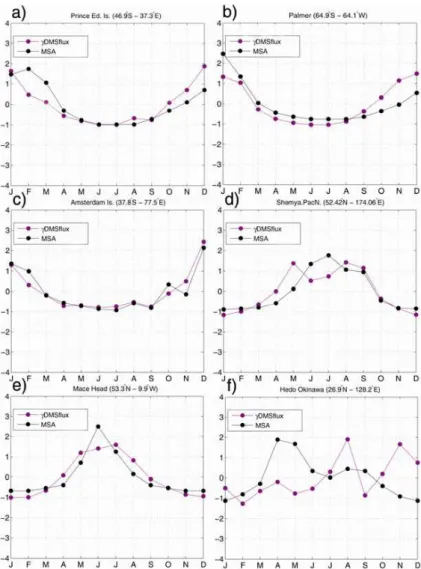
3.3.1 TheγDMSflux
For the contribution of DMS oxidation to aerosol mass, we are lucky that methane sulfonic acid (MSA) originates ex-clusively from DMS and has no major continental source, and therefore it is a good metrics against which to validate our representation of the γDMSflux (Vallina et al., 2007). Among the island-based aerosol sampling stations that have records of atmospheric MSA concentrations for at least one year (Chin et al., 2000; Sciare et al., 1998), we chose Prince Edward Islands, Palmer Station, Amsterdam Island, Shemya Island, Mace Head and Cape Hedo as representative of con-trasting situations. We defined a 7◦×7◦ window upwind of each station and computed the monthly window-average
γDMSflux over a climatological year, which we compared with the monthly series of MSA concentrations at the station (Fig. 4).
On Prince Edward Island (located in the Indian sector of the Southern Ocean, 46.9◦S–37.3◦E) and Palmer station (lo-cated on Anvers Island, midway down the western side of the Antarctic Peninsula, 64.9◦S–64.1◦W), the annual variability of the estimatedγDMSflux agrees well with that of monthly aerosol MSA concentrations in both timing and amplitude (Fig. 4a, b), thus providing a ground-based test for the va-lidity of the seawater DMS climatology and the associated emission and oxidation fluxes in the Southern Ocean.
Fig. 4. Validation of the biogenic sulfur aerosol parameterization. Seasonal evolution of standardized values of computedγDMSflux and ground-based aerosol MSA concentrations at six aerosol sampling stations: (a) Prince Edward Island, (b) Palmer Station, (c) Amsterdam Island, (d) Shemya Island, (e) Mace Head and (f) Cape Hedo (Okinawa).
a general agreement between the seasonalities ofγDMSflux and aerosol MSA. The latter were measured by Saltzman et al. (1986) as part of a broader study over the Pacific Ocean. By computing the ratio MSA/nss-SO−42, Savoie et al. (1989) concluded that, despite some seasonal influence by continen-tal aerosols, marine biogenic sulfur accounts for ca. 80 % of the annually averaged aerosol sulfur in the region.
On Mace Head, the timing and amplitude of the monthly
γDMSflux and aerosol MSA series were also coincident (Fig. 4e). Cape Hedo was the only examined station where the two variables did not agree (Fig. 4f); this had already been observed by Vallina et al. (2007) using a former version of the seawater DMS climatology, and was attributed to the influence of polluted aerosols on particulate MSA through heterogeneous adsorption. In general, the validation exercise provided confidence in the parameterization of the
variabil-ity of DMS emission and oxidation fluxes throughout most of the global ocean.
3.3.2 Fluxes of organics and sea salt
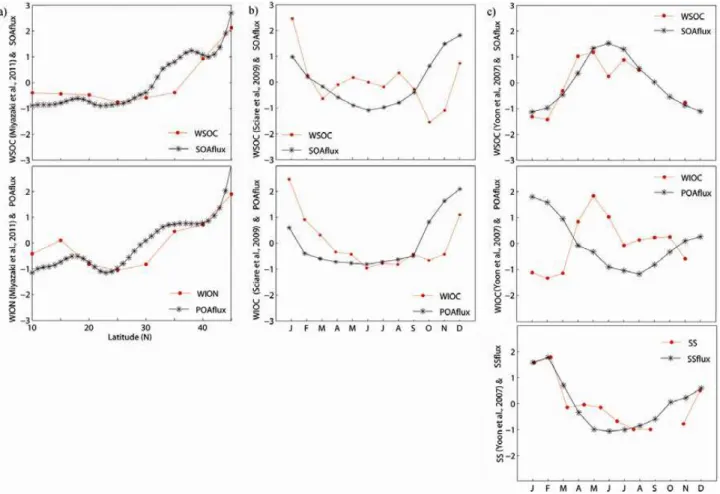
Fig. 5. Validation of aerosol flux parameterizations. (a) Standardized latitudinal series of aerosol water soluble organic carbon (WSOC) and water insoluble inorganic nitrogen (WION) measurements reported by Miyazaki et al. (2011) along 155◦E in the North Pacific, with the corresponding satellite-derived computations of SOAflux and POAflux for September 2008. (b) Standardized monthly series of aerosol WSOC and WIOC measurements on Amsterdam Island (Sciare et al., 2009), with the corresponding computations of SOAflux and POAflux for years 2005–2007. (c) Standardized monthly series of aerosol WSOC, WIOC and sea salt measurements on Mace Head (Yoon et al., 2007), with the corresponding computations of SOAflux, POAflux and SSflux for years 2002–2004.
added a third study with ship-based measurements of organic aerosols along a broad latitudinal transect (10–50◦N) on lon-gitude 155◦E in the North Pacific (Miyazaki et al., 2011).
Figure 5a shows the comparison of our parameterized SOAflux and POAflux (in running 7◦×7◦ windows aver-aged for each 1◦step) with 5◦binned measurements of,
re-spectively, water soluble organic carbon (WSOC) and wa-ter insoluble organic nitrogen (WION, considered more spe-cific to biogenic emissions than its carbon homolog WIOC) along the latitudinal transect in the North Pacific (Miyazaki et al., 2011). Data and computations correspond to early September, when the marine biology activity is still high. For both SOAflux and POAflux, the parameterizations repre-sented well the in situ latitudinal distributions, with increas-ing biogenic emissions northwards.
Figure 5b shows the comparison of parameterized fluxes upwind (southwest) of Amsterdam Island with aerosol WSOC and WIOC concentrations measured on the island (Sciare et al., 2009). Both the SOAflux and the POAflux did
4 Discussion
4.1 Potential for marine aerosols to influence cloud microphysics: what do correlations tell
(and what do they not)?
Our global correlation study shows that, at latitudes higher than 30◦ in both hemispheres, production fluxes of marine secondary aerosols (DMS-derived and SOA) have the same seasonality as CCN numbers whereas primary aerosols (POA and SS) do not, except for POA in a narrow band of the Southern Ocean. Such a distinct behavior is to be found in the production mechanisms and how they are parameterized. At temperate to high latitudes, CCN numbers are higher in summer (Vallina et al., 2007), and this is the season when DMS occurs at its maximum and when high OH radical con-centrations combine with high primary productivity rates to give rise to maximum SOA fluxes. Primary aerosol fluxes, on the other hand, are more dependent on wind speed because sea spray generation is a non-linear process that results from white cap formation and bubble bursting. As wind speeds at these latitudes are generally higher in winter, this decou-ples CCN numbers from primary aerosol fluxes in spite of the Chla-dependence of the organic content of sea spray. At lower latitudes, conversely, DMS looses influence, and widespread low productivity favors a better coupling of CCN numbers to SOA and primary aerosols through the seasonal-ity of wind speed.
It is worth reminding here that the initial hypothesis was that marine aerosol sources potentially influencing the vari-ability of CCN concentrations should display positive cor-relations to satellite CCN. This is the case for secondary aerosols at mid and high latitudes, where the non-significant or negative correlations of primary (sea spray) aerosols pre-vent them from being main drivers of the seasonal variability of accumulation mode particles. At low latitudes, conversely, it is the DMS-derived aerosols that do not show the positive correlation necessary to suggest a strong influence on accu-mulation mode particle variability.
How does this translate into a potential influence on cloud microphysics? Negative correlations to cloud droplet size (re)in case studies of low altitude and low water
contain-ing clouds in the clean atmosphere showed that secondary aerosols were the only ones having the seasonality that is expected according to the indirect effect (that is, smaller droplets in the presence of higher aerosol numbers). In other words, the results withre were similar to those with CCN.
One could argue that the correlation between secondary aerosols andre does not reflect any causality but is simply
the result of secondary aerosol production being geared to summer and therefore coinciding with lower LWP, a feature that often accompanies smallerre. But the fact that the
cor-relation is much reduced or even turned non-significant in polluted case studies (such as Mace Head and Cape Hedo, Table 1) suggests that simple co-variation between secondary
aerosols and seasonal meteorology cannot account for the ob-served correlation.
None of the primary aerosol fluxes showed the expected negative correlation to re in any of the case studies. The
POAflux only gave non-significant correlations for low clouds, and in the case of the SSflux, correlation was even positive (Table 1). Therefore, even though water insoluble organic compounds have been seen to account for an impor-tant fraction of the organic mass of marine aerosols (Facchini et al., 2008b; Russell et al., 2010), they do not seem to play their own big role in driving the variability of cloud droplet size. And this similarly occurs with sea salt. The SS lifted with sea spray has long been recognized as the largest global source of primary aerosols (Woodcock, 1948; de Leeuw et al., 2011). In terms of mass, it represents the largest contrib-utor to marine aerosols. Even though the concentration of small sized sea salt particles in the marine boundary layer is enough to represent an important, but highly variable, source of CCN at the top of the MBL (O’Dowd and Smith, 1993; Lewis and Schwartz, 2004; Caffrey et al., 2006; Pierce and Adams, 2006), our correlation analysis shows that they do not seem to play an important direct role in driving the vari-ability of cloud microphysics.
Altogether, our results agree with the findings of the Southern Ocean studies by Vallina et al. (2006), Meskhidze and Nenes (2006) and Kr¨uger and Graßl (2011), who also used statistical metrics of co-variation to show that the Chla
concentration is better coupled to cloud microphysics than the SSflux is.
4.2 The unknowns of organic aerosols
The research field of marine organic aerosols is rapidly ex-panding and deepening (e.g., Rinaldi et al., 2010), but today still large and important unknowns remain. These unknowns lie in both production mechanisms and controlling factors as well as atmospheric transformations. Based on multiple evi-dence (see Sect. 2.2, and, e.g., O’Dowd et al., 2004), we pa-rameterized the SOAflux upon the assumption that volatile and semi-volatile precursors occur in the surface ocean in proportionality to the Chlaconcentration. Should SOA pre-cursors have a seasonality less coupled to the Chla concen-tration (phytoplankton biomass) and more driven by other factors (e.g., phytoplankton taxonomy, nutrient availability, oxidative stress and solar radiation), as is the case for DMS (Vallina and Sim´o, 2007; Lana et al., 2011), the SOAflux sea-sonality might have been wrongly computed. The few op-portunities for validation against the aerosol WSOC concen-trations indicate that the assumption is not too far from re-ality. Nonetheless, there is a strong need to better identify the most important players among marine SOA precursors, beyond isoprene, and to conduct time series and manipu-lation studies aimed at deciphering the biological and en-vironmental drivers of their seasonal variability. Also, their volatilization and atmospheric chemical behavior (including SOA production yields in the marine atmosphere) need to be described if we are to assess their role in CCN forma-tion and cloud microphysics over the ocean. Overall, the no-tion that SOA from marine biogenic precursors play a role in the size distribution and composition of remote marine aerosols is supported by aerosol studies (e.g., O’Dowd et al., 2004; Facchini et al., 2008b; Sorooshian et al., 2009). A sig-nificant direct influence of biogenic SOA on marine cloud microphysics, as suggested by our study, remains an open question that regional, satellite-based studies have not agreed upon (Meskhindze and Nenes, 2006; Miller and Yuter, 2008). Also, the POAflux parameterization was based on an em-pirical relationship of the organic composition of sea spray to the Chlaconcentration (Gantt et al., 2011). Indeed, most POA precursors are expected to occur in some degree of pro-portionality to phytoplankton biomass and production, par-ticularly biological particles such as viruses, bacteria and the smallest microalgae. But this is harder to predict for the algal polymers, mainly carbohydrates (lipopolysaccharides) that dominate the submicron aerosols (Facchini et al., 2008b; Russell et al., 2010; Orellana et al., 2011). It is known that this type of algal exudates does not only depend on total phytoplankton biomass but also on their species composi-tion, physiological status and productivity (Verdugo et al., 2004). Plus, they tend to accumulate in the surface micro-layer of the ocean (Wurl et al., 2009) that develops under very calm conditions and is not directly linked to primary productivity. Still, surface active organic material suitable as POA precursor can be either freshly produced or rela-tively aged (Verdugo et al., 2004; Wurl et al., 2009), hence
potentially decoupled from Chla concentrations. All these features may contribute to explain the irregular success we had in the validation of our POAflux computations, because the empirical parameterization of the organic fraction of sea spray does hardly cover all the aforementioned conditions. As in the case of SOA precursors, therefore, there is a strong need to better know the geographic and seasonal distribution of POA-forming material and their non-linear environmental drivers.
Further complication of the picture arises from the fact that aerosols evolve once in the atmosphere. Submicron aerosols generated in seawater bubbling chambers are generally richer in POA than ambient aerosols over the ocean (e.g., Keene et al., 2007; Rinaldi et al., 2010). One reason for that is the faster loss of primary aerosols by condensational growth, co-alescence and deposition. Another reason has been unveiled by recent studies by showing that photochemical reactions in wetted and acidified primary aerosols may form a number of volatiles that can be released and eventually form SOA (Hallquist et al., 2009; Rinaldi et al., 2010). Hence, the dis-tinction of SOA and POA in terms of origin and magnitude of the source functions is blurring.
4.3 Uncertainties and future research needs
We focused our efforts upon distinguishing among ma-rine aerosol sources and types, and dealt with their dis-tinct dynamics and seasonalities. At first sight, our ap-proach seems based on one major conceptual simplifica-tion: aerosol sources each contribute a proportion of an ex-ternal mixture of marine aerosols, and the ones identified here to be the best coupled to cloud microphysics variabil-ity (namely the secondary aerosols) are hence the most cli-matically active through the indirect effects. A deeper in-terpretation of our data, however, should take into account that most marine aerosols occur as internal mixtures from different sources and nature. Electron microscopy observa-tions of marine aerosols depict a variety of heterogeneous particle constructions, with, e.g., organic polymers internally mixed with sulfuric acid or sea salt crystals (Leck and Bigg, 1999, 2005, 2008). The view that new aerosols and CCN are formed by homogeneous nucleation and further conden-sation of vapors is too simplistic; H2SO4 nucleation is
a widespread occurrence of POA-forming material in ma-rine aerosols (e.g., Russell et al., 2010), and observations in the Arctic suggest that the number of CCN is provided by particle-core forming POA (Orellana et al., 2011). We must be reminded here that it is CCN number, not mass, that even-tually determines cloud microphysics.
Our results, therefore, should not be regarded as evidence suggestive of a unique (or even prevailing) role of organic and sulfur volatiles in CCN formation through particle nu-cleation, with dismiss of the primary aerosols, but rather that they point to a pivotal role of trace gas oxidation products in the condensational growth and hygroscopic activation of small primary particles, ultimately facilitating cloud droplet nucleation at the small supersaturations found in marine stra-tus (Andreae and Rosenfeld, 2008; Meskhidze et al., 2011).
We suggest that future research should address the follow-ing issues:
1. If we are to assess the impact of the marine biosphere on tropospheric aerosols and clouds, we should be able to better distinguish between sea and continental born aerosols (and aerosol precursors). This is extremely challenging because they often occur altogether in inter-nal mixtures. At least, ship-, aircraft-, or satellite-based work aimed at the marine biogenic effects should avoid regions of traceable continental influence.
2. While improving our capacity to decipher aerosol com-position, there is a strong need for a better knowledge of the processes that govern marine aerosol charac-teristics and temporal dynamics. This refers not only to aerosol and aerosol-precursor production at/over the surface ocean, including the ecophysiology of plank-ton and the biogeochemistry or organic matter and trace gases, but also to aerosol transformations in the MBL by growth, aging, photochemistry and internal mixing. This growing knowledge must keep being implemented in models if we are to use them as primary tools in biosphere-climate simulations and projections.
3. Separation of microphysical and macrophysical (meteo-rological) processes remains challenging but necessary to avoid an oversimplification of aerosol–cloud interac-tions.
We took a rather simple approach to constrain the potential effects of biogenic emissions on cloud microphysics over the global oceans throughout seasons. Our work, combined with the increasing load of knowledge on marine aerosol compo-sition and behavior, suggests that the marine biosphere does influence cloud formation and characteristics in those large portions of the oceanic atmosphere that still remain relatively pristine from continental (including anthropogenic) outflow.
Acknowledgements. We thank the NCEP/NCAR Reanalysis Project for the production and free distribution of the SST and wind speed data used in the present work. We are also indebted to the SeaWiFS and MODIS-Atmosphere projects for the atmospheric variables and chlorophyl a concentrations values. We thank two anonymous reviewers for their critical and constructive comments. Financial support was provided by the former Spanish Ministry of Science and Innovation through the projects MIMOSA, PRISMA, Malaspina 2010, and a Ph.D. studentship to A.L.
Edited by: R. Krejci
References
Albrecht, B. A.: Aerosols, cloud microphysics, and fractional cloudiness, Science, 245, 1227–1230, 1989.
Andreae, M. O. and Rosenfeld, D.: Aerosol–cloud–precipitation interactions. Part 1. The nature and sources of cloud-active aerosols. Earth Sci. Rev., 89, 13–41, 2008.
Aller, J. Y., Kuznetsova, M. R., Jahns, C. J., and Kemp, P. F.: The sea surface microlayer as a source of viral and bacterial enrichment in marine aerosols, J. Aerosol Sci., 36, 801–812, 2005.
Arnold, S. R., Spracklen, D. V., Williams, J., Yassaa, N., Sciare, J., Bonsang, B., Gros, V., Peeken, I., Lewis, A. C., Alvain, S., and Moulin, C.: Evaluation of the global oceanic isoprene source and its impacts on marine organic carbon aerosol, Atmos. Chem. Phys., 9, 1253–1262, doi:10.5194/acp-9-1253-2009, 2009. Baker A., Turner, S., Broadgate, W., Thompson, A., McFiggans, G.,
Vesperini, O., Nightingale, P., Liss, P., and Jickells, T.: Distribu-tion and Sea-Air Fluxes of Biogenic Trace Gases in the Eastern Atlantic Ocean, Global Biogeochem. Cy., 14, 871–886, 2000. Barrie, L. A., Yi, Y., Leaich, W. R., Lohmann, U., Kasibhatla, P.,
Roelofs, G.-J., Wilson, J., McGovern, F., Benkovitz, C., Me-lieres, M. A., Law, K., Prospero, J., Kritz, M., Bergmann, D., Bridgeman, C., Chin, M., Christensen, J., Easter, R., Feichter, J., Land, C., Jeuken, A., Kjellstrom, E., Koch, D., and Rasch, P.: A comparison of large-scale atmospheric sulphate aerosol mod-els (COSAM): overview and highlights, Tellus B, 53, 615–645, 2001.
Bauer, H., Giebl, H., Hitzenberger, R., Kasper-Giebl, A., Reis-chl, G., Zibuschka, F., and Puxbaum, H.: Airborne bacteria as cloud condensation nuclei, J. Geophys. Res., 108, 4658, doi:10.1029/2003JD003545, 2003.
Bonsang, B., Polle, C., and Lambert, G.: Evidence for marine production of isoprene, Geophys. Res. Lett., 19, 1129–1132, doi:10.1029/92GL00083, 1992.
Bonsang, B., Aarbaoui, A. A., and Sciare J.: Diurnal variation of non-methane hydrocarbons in the subantarctic atmosphere, Env-iron. Chem., 5, 16–23, 2008.
Bowers, R. M., Lauber, C. L., Wiedinmyer, C., Hamady, M., Hal-lar, A. G., Fall, R., Knight, R., and Fierer, N.: Characterization of airborne microbial communities at a high-elevation site and their potential to act as atmospheric ice nuclei, Appl. Environ. Microb., 75, 5121–5130, 2009.
Broadgate, W., Liss, P., and Penkett, S.: Seasonal emissions of iso-prene and other reactive hydrocarbon gases from the ocean, Geo-phys. Res. Lett., 24, 2675–2678, 1997.
Caffrey, P. F., Hoppel, W. A., and Shi, J. J.: A one-dimensional sec-tional aerosol model integrated with mesoscale meteorological data to study marine boundary layer aerosol dynamics, J. Geo-phys. Res., 111, D24201, doi:10.1029/2006JD007237, 2006. Carlton, A. G., Wiedinmyer, C., and Kroll, J. H.: A review of
Sec-ondary Organic Aerosol (SOA) formation from isoprene, At-mos. Chem. Phys., 9, 4987–5005, doi:10.5194/acp-9-4987-2009, 2009.
Cavalli, F., Facchini, M. C., Decesari, S., Mircea, M., Emblico, L., and Fuzzi, S.: Advances in characterization of size-resolved or-ganic matter in marine aerosol over the North Atlantic, J. Geo-phys. Res., 109, D24215, doi:10.1029/2004JD005137, 2004. Charlson, R. J., Lovelock, J. E., Andreae, M. O., and Warren, S.
G.: Oceanic phytoplankton, atmospheric sulfur, cloud albedo and climate, Nature, 326, 655–661, 1987.
Chin, M., Rood, R. B., Lin, S. J., Muller, J. F., and Thompson, A. M.: Atmospheric sulfur cycle simulated in the global model go-cart: Model description and global properties, J. Geophys. Res., 105, 24671–24687, 2000.
Chuck, A. L., Turner, S. M., and Liss, P. S.: Direct evidence for a marine source of C1and C2alkyl nitrates, Science, 297, 1151– 1154, 2002.
Ceburnis, D., O’Dowd, C. D., Jennings, G. S., Facchini, M. C., Emblico, L., Decesari, S., Fuzzi, S., and Sakalys, J.: Ma-rine aerosol chemistry gradients: elucidating primary and sec-ondary processes and fluxes, Geophys. Res. Lett., 35, L07804, doi:10.1029/2008GL033462, 2008.
Covert, D. S., Kapustin, V. N., Quinn, P. K., and Bates, T. S.: New particle formation in the marine boundary layer, J. Geophys. Res., 97, 20581–20589, 1992.
Dachs, J., Calleja, M. L., Duarte, C. M., Del Vento, S., Turpin, B., Polidori, A., Herndl, G. J., and Agust´ı, S.: High atmosphere-ocean exchange of organic carbon in the NE subtropical Atlantic, Geophys. Res. Lett., 32, L21807, doi:10.1029/2005GL023799, 2005.
de Leeuw, G., Andreas, E. L., Anguelova, M. D., Fairall, C. W., Lewis, E. R., O’Dowd, C., Schulz, M., and Schwartz, S. E.: Pro-duction flux of sea spray aerosol, Rev. Geophys., 49, RG2001, doi:10.1029/2010RG000349, 2011.
Facchini, M. C., Decesari, S., Rinaldi, M., Carbone, C., Finessi, E., Mircea, M., Fuzzi, S., Moretti, F., Tagliavini, E., Ceburnis, D., and O’Dowd, C. D.: Important source of marine secondary or-ganic aerosol from biogenic amines, Environ. Sci. Technol., 42, 9116–9121, 2008a.
Facchini, M. C., Rinaldi, M., Decesari, S., Carbone, C., Finessi, E., Mircea, M., Fuzzi, S., Ceburnis, D., Flanagan, R., Nilsson, E. D., de Leeuw, G., Martino, M., Woeltjen, J., and O’Dowd, C. D.: Primary submicron marine aerosol dominated by insoluble or-ganic colloids and aggregates, Geophys. Res. Lett., 35, L17814, doi:10.1029/2008GL034210, 2008b.
Fiore, A., Jacob, D. J., Liu, H., Yantosca, R. M., Fairlie, T. D., and Li, Q.: Variability in surface ozone background over the United States: Implications for air quality policy, J. Geophys. Res., 108, 4787, doi:10.1029/2003JD003855, 2003.
Gantt, B., Meskhidze, N., Facchini, M. C., Rinaldi, M., Ceburnis, D., and O’Dowd, C. D.: Wind speed dependent size-resolved pa-rameterization for the organic mass fraction of sea spray aerosol, Atmos. Chem. Phys., 11, 8777–8790, doi:10.5194/acp-11-8777-2011, 2011.
Geever, M., O’Dowd, C. D., van Ekeren, S., Flanagan, R., Nilsson, E. D., de Leeuw, G., and Rannik, U.: Submicron sea spray fluxes, Geophys. Res. Lett., 32, L15810, doi:10.1029/2005GL023081, 2005.
Hawkins, L. N. and Russell, L. M: Polysaccharides, pro-teins, and phytoplankton pragments: four chemically distinct types of marine Primary Organic Aerosol classified by Sin-gle Particle Spectromicroscopy, Adv. Meteo., 2010, 612132, doi:10.1155/2010/612132, 2010.
Haywood, J. and Boucher, O.: Estimates of the direct and indirect radiative forcing due to tropospheric aerosols: A review, Rev. Geophys., 38, 513–543, 2000.
Heald, C., Jacob, D. J., Park, R. J., Russell, L. M., Huebert, B. J., Seinfeld, J. H., Liao, H., and Weber, R. J.: A large organic aerosol source in the free trophosphere missing from current models, Geophys. Res. Lett., 32, L18809, doi:10.1029/2005GL023831, 2005.
Hegg, D. A., Radke, L. F., and Hobbs, P. V.: Particle-production as-sociated with marine clouds, J. Geophys. Res., 95, 13917–13926, 1990.
Hallquist, M., Wenger, J. C., Baltensperger, U., Rudich, Y., Simp-son, D., Claeys, M., Dommen, J., Donahue, N. M., George, C., Goldstein, A. H., Hamilton, J. F., Herrmann, H., Hoff-mann, T., Iinuma, Y., Jang, M., Jenkin, M. E., Jimenez, J. L., Kiendler-Scharr, A., Maenhaut, W., McFiggans, G., Mentel, Th. F., Monod, A., Pr´evˆot, A. S. H., Seinfeld, J. H., Surratt, J. D., Szmigielski, R., and Wildt, J.: The formation, properties and im-pact of secondary organic aerosol: current and emerging issues, Atmos. Chem. Phys., 9, 5155–5236, doi:10.5194/acp-9-5155-2009, 2009.
Hsu, S. A., Meindl, E. A., and Gilhousen, D. B.: Determining the power-law wind-profile exponent under near-neutral stabil-ity conditions at sea, J. Appl. Meteorol., 33, 757–772, 1994. Jurado, E., Dachs, J., Duarte, C. M., and Sim´o, R.: Atmospheric
de-position of organic and black carbon to the global oceans, Atmos. Environ., 42, 7931–7939, 2008.
Keene, W. C., Maring, H., Maben, J. R., Kieber, D. J., Pszenny, A. A. P., Dahl, E. E., Izaguirre, M. A., Davis, A. J., Long, M. S., Zhou, X., Smoydzin, L., and Sanderet, R.: Chemical and physi-cal characteristics of nascent aerosols produced by bursting bub-bles at a model air-sea interface, J. Geophys. Res., 112, D21202, doi:10.1029/2007JD008464, 2007.
Kettle, A. J., Andreae, M. O., Amouroux, D., Andreae, T. W., Bates, T. S., Berresheim, H., Bingemer, H., Boniforti, R., Curran, M. A. J., DiTullio, G. R., Helas, G., Jones, G. B., Keller, M. D., Kiene, R. P., Leck, C., Levasseur, M., Malin, G., Maspero, M., Matrai, P., McTaggart, A. R., Mihalopoulos, N., Nguyen, B. C., Novo, A., Putaud, J. P., Rapsomanikis, S., Roberts, G., Schebeske, G., Sharma, S., Sim´o, R., Staubes, R., Turner, S., and Uher, G.: A global database of sea surface dimethylsulfide (DMS) measure-ments and a procedure to predict sea surface DMS as a function of latitude, longitude, and month, Global Biogeochem. Cy., 13, 399–444, 1999.
Kloster, S., Feichter, J., Maier-Reimer, E., Six, K. D., Stier, P., and Wetzel, P.: DMS cycle in the marine ocean-atmosphere system – a global model study, Biogeosciences, 3, 29–51, doi:10.5194/bg-3-29-2006, 2006.
Korhonen, H., Carslaw, K. S., Spracklen, D. V., Mann, G. W., and Woodhouse, M. T.: Influence of oceanic dimethyl sulphide emissions on cloud condensation nuclei concentra-tions and seasonality over the remote Southern Hemisphere oceans: A global model study, J. Geophys. Res., 113, D15204, doi:10.1029/2007JD009718, 2008.
Kroll, J. H., Ng, N. L., Murphy, S. M., Flagan, R. C., and Sein-feld, J. H.: Secondary organic aerosol formation from isoprene photooxidation, Environ. Sci. Technol., 40, 1869–1877, 2006. Kr¨uger, O. and Graßl, H.: Southern Ocean phytoplankton increases
cloud albedo and reduces precipitation, Geophys. Res. Lett., 38, L08809, doi:10.1029/2011GL047116, 2011.
Kulmala, M., Kerminen, V. M., Anttila, T., Laaksonen, A., and O’Dowd, C. D.: Organic aerosol formation via sul-phate cluster activation, J. Geophys. Res., 109, D04205, doi:10.1029/2003JD003961, 2004.
Lana, A., Bell, T. G., Sim´o, R., Vallina, S. M., Ballabrera-Poy, J., Kettle, A. J., Dacha, J., Bopp, L., Saltzman, E. S., Ste-fels, J., Johnson, J. E., and Liss, P. L.: An updated clima-tology of surface dimethlysulfide concentrations and emission fluxes in the global ocean, Global Biogeochem. Cy., 25, GB1004, doi:10.1029/2010GB003850, 2011.
Lana, A., Sim´o, R., Vallina, S. M., and Dachs, J.: Re-examination of global emerging patterns in DMS concentration, Biogeochem-istry, doi:10.1007/s10533-011-9677-9, in press, 2012.
Le Qu´er´e, C. and Saltzman, E. S.: Surface Ocean Lower Atmo-sphere Processes, Geophys. Monogr. Ser., American Geophys-ical Union, ISBN 978-0-87590-477-1, 2009.
Leck, C. and Bigg, E. K.: Aerosol production over remote marine areas – A new route, Geophys. Res. Lett., 26, 3577–3580, 1999. Leck, C. and Bigg, E. K.: Source and evolution of the marine aerosol: A new perspective, Geophys. Res. Lett., 32, L19803, doi:10.1029/2005GL023651, 2005.
Leck, C. and Bigg, E. K.: A modified aerosol-cloud-climate feed-back hypothesis, Environ. Chem., 4, 400–403, 2007.
Leck, C. and Bigg, E. K.: Comparison of sources and nature of the tropical aerosol with the summer high Arctic aerosol, Tellus B, 60, 116–126, 2008.
Levasseur, M.: If Gaia could talk, Nat. Geosci., 4, 351–352, 2011. Lewis, E. R. and Schwartz, S. E.: Sea salt aerosol production:
mech-anisms, methods, measurements and models – A critical review, Geophys. Monogr. Ser., 152, 413 pp., AGU, Washington, D.C., 2004.
Liss, P. S. and Lovelock, J. E.: Climate change: the effect of DMS emissions. Environ Chem, 4, 377–378, 2007.
Lohmann, U. and Feichter, J.: Global indirect aerosol effects: a re-view, Atmos. Chem. Phys., 5, 715–737, doi:10.5194/acp-5-715-2005, 2005.
Longhurst, A.: Ecological Geography of the Sea, 2nd Edn., Acad. Press, Burlington, Mass., 2007.
McGillis, W. R., Dacey, J. W. H., Frew, N. M., Bock, E. J., and Nel-son, R. K.: Water-air flux of dimethylsulfide, J. Geophys. Res.-Oceans, 105, 1187–1193, 2000.
Meskhidze, N. and Nenes, A.: Phytoplankton and cloudiness in the Southern Ocean, Science, 314, 1419–1423, 2006.
Meskhidze, N., Xu, J., Gantt, B., Zhang, Y., Nenes, A., Ghan, S. J., Liu, X., Easter, R., and Zaveri, R.: Global distribution and climate forcing of marine organic aerosol: 1. Model improve-ments and evaluation, Atmos. Chem. Phys., 11, 11689–11705,
doi:10.5194/acp-11-11689-2011, 2011.
Metzger, A., Verheggenb, B., Dommena, J., Duplissya, J., Prevota, A. S. H., Weingartnera, E., Riipinenc, I., Kulmalac, M., Sprack-lend, D. V., Carslaw, K. S., and Baltenspergera, U.: Evidence for the role of organics in aerosol particle formation under atmo-spheric conditions, P. Natl. Acad. Sci. USA, 107, 6646–6651, 2010.
Miller, M. A. and Yuter, S. E.: Lack of correlation be-tween chlorophyll a and cloud droplet effective radius in shallow marine clouds, Geophys. Res. Lett., 35, L13807, doi:10.1029/2008GL034354, 2008.
Miyazaki, Y., Kawamura, K., Jung, J., Furutani, H., and Uematsu, M.: Latitudinal distributions of organic nitrogen and organic car-bon in marine aerosols over the western North Pacific, Atmos. Chem. Phys., 11, 3037–3049, doi:10.5194/acp-11-3037-2011, 2011.
M¨uller, C., Iinuma, Y., Karstensen, J., van Pinxteren, D., Lehmann, S., Gnauk, T., and Herrmann, H.: Seasonal variation of aliphatic amines in marine sub-micrometer particles at the Cape Verde is-lands, Atmos. Chem. Phys., 9, 9587–9597, doi:10.5194/acp-9-9587-2009, 2009.
Nightingale, P. D., Malin, G., Law, C. S., Watson, A. J., Liss, P. S., Liddicoat, M. I., Boutin, J., and Upstill-Goddard, R. C.: In situ evaluation of air-sea gas exchange parameterizations using novel conservative and volatile tracers, Global Biogeochem. Cy., 14, 373–387, 2000.
Nizzetto, L., Lohmann, R., Gioia, R., Jahnke, A., Temme, C., Dachs, J., Herckes, P., DiGuardo, A., and Jones, K.: PAHs in air and seawater along a north-south Atlantic transect: trends, pro-cesses and possible sources, Environ. Sci. Technol., 42, 1580– 1585, 2008.
O’Dowd, C. D. and de Leeuw, G.: Marine aerosol production: a review of the current knowledge, Philos. Trans. Royal Soc. A, 365, 1753–1774, 2007.
O’Dowd, C. D. and Smith, M. H.: Physicochemical properties of aerosols over the Northeast Atlantic – Evidence for wind-speed related submicron sea-salt aerosol production, J. Geophys. Res., 98, 1137–1149, 1993.
O’Dowd, C. D., Smith, M. H., Consterdine, I. E., and Lowe, J. A.: Marine aerosol, sea salt, and the marine sulphur cycle: A short review, Atmos. Environ., 31, 73–80, 1997.
O’Dowd, C. D., Facchini, M. C., Cavalli, F., Ceburnis, D., Mircea, M., Decesari, S., Fuzzi, S., Yoon, Y. J., and Putaud, J.-P.: Bio-genically driven organic contribution to marine aerosol, Nature, 431, 676–680, 2004.
O’Dowd, C. D., Langmann, B., Varghese, S., Scannell, C., Ce-burnis, D., and Facchini, M. C.: A combined organic-inorganic sea-spray source function, Geophys. Res. Lett., 35, L01801, doi:10.1029/2007GL030331, 2008.
Orellana, M. V., Matrai, P. A., Leck, C., Rauschenberg, C. D., Lee, A. M., and Coz, E.: Marine microgels as a source of cloud con-densation nuclei in the high Arctic, P. Natl. Acad. Sci. USA, 108, 13612–13617, 2011.
Palmer, P. I. and Shaw, S. L.: Quantifying global marine isoprene fluxes using MODIS chlorophyll observations, Geophys. Res. Lett., 32, L09805, doi:10.1029/2005GL022592, 2005.