Mathematical Modeling on Immunopathogenesis in
Chronic Plaque of Psoriasis: A Theoretical Study
Priti Kumar Roy
∗†‡Jhumpa Bhadra
†Biplab Chattopadhyay
§Abstract—Psoriasis is a chronic inflammatory hu-man skin disorder characterized by T-cell mediated hyperproliferation of Keratinocytes. The exact na-ture of the triggering agent of psoriasis is not yet known. Cell biological findings on the disease re-vealed that Helper T-cells in the human blood as well as Dendritic Cells play an important role in inflict-ing the disease. Further, clinical research suggests that excessive generation of nitric oxide, through a complex chain of bio-chemical events, is causal to the scaliness of psoriatic plaques on human skin. We pro-pose a mathematical model involving the densities of immune cells and Keratinocytes where proliferation of Keratinocytes together with excessive nitric oxide production is precursor to the psoriatic lesions. The model is studied both analytically and numerically. Results are observed to be consistent with the cell biological and clinical findings.
Keywords —Dendritic Cells, Helper T-cells,
Ker-atinocytes and Macrophages.
1
Introduction
Psoriasis is a commonly known disease which occurs as chronic inflammation of the skin. The disease has clini-cal appearance as red sclini-caly lesions, known as plaques on the skin surface. As per existing statistics approximately 2−3% of the world population is affected by psoriasis. Although the exact mechanism leading to the disease is yet to be fully understood, it is established by clinical and cell biological research that various genetic environmental and immunological factors contribute to the pathogenesis of the disease [1]-[3].
Before the mid-1980’s scientist thought that psoriasis was altogether a skin disease having its root only to the epi-dermal area of the skin. Afterwards, cell-biological re-search established that the disease psoriasis was due to a
∗Research is supported by the Department of Mathematics
Ja-davpur University, PURSE DST, Government of India and its a pleasure to acknowledge All India Council for Technical Eduction for their travel support to present the research work in WCE 2010, U.K.
†Centre for Mathematical Biology and Ecology, Department of
Mathematics, Jadavpur University, Kolkata 700032, West Bengal, India.
‡Corresponding Author E-mail: [email protected], Fax No.
+913324146584, Ph.No. +919432095603
§Department of Physics, Barasat Government College, Kolkata
700124, West Bengal, India.
breakdown in the human immune system. It is observed that the immune T-cells cause an abnormal proliferation of the healthy skin cells due to some falls signaling. Psori-asis is thus identified to be a T-cell mediated autoimmune disease [4],[5]. In some specific cases, drugs such as Cy-closporin and FK506 that act as T-cell suppressor, are found to be effective in the treatment of psoriasis [6],[7]. Further clinical research established that psoriatic lesions could be cured [8] by inducing bone marrow transplants [9], with a favorable response to anti-CD4 and anti-CD3 monoclonal antibodies as well as lymphocyte toxins.
Findings of cell-biological and clinical research so far, when put together, indicates to a complex chain of events leading to the appearance of psoriatic plaques, starting from the activation of T-cells’ accumulation in the rel-evant dermal area by the Dendritic Cells that are de-rived from various Monocytes. Actually CD14+ and CD16+ monocytes in human blood give rise to tissue Macrophages or Dendritic Cells (DC). An upstream acti-vation of DC’s, in turn, activate lymphocytic cells. T-cells, by virtue of their stimulation, release tumor necrosis factor-alpha (TNF-α), interferon-gamma (IFN-γ), and other cytokines [10]. It has been observed that the cy-tokines TNF-α and IFN-γ, through some intermediate mechanisms, leads to maturation of DC’s. DC matu-ration again contributes to eventual activation of naive T-cells, forming a cyclic chain of mutual activation DCs and T-cells. The cytokines thus generated in the process of mutual activation, stimulate the proliferation of Ker-atinocytes in the epidermal region of the skin and also produce the antigenic adhesion molecules in the dermal blood vessels. Note that the normal skin has two layers; one is the epidermis, consisting of mostly a single close packed type of cells called Keratinocytes and below this, the dermis, made of collagen-based matrix holding fibrob-last cells, blood vessels, nerve endings and epidermal ap-pendages like hair-follicles and sweat glands. Infliction of psoriasis sees a significant thickening of epidermis due to Keratinocyte hyperproliferation and inhibition of apop-tosis of the epidermal Keratinocytes.
0 50 100 150 0
50 100 150 200 250 300
Time (days) (a)
Cell Densities ( mm
3)
a=10
0 50 100 150
0 50 100 150 200 250 300 350 400 450
a=15
Time (days) (b)
Cell Densities (mm
3)
T−Lymphocytes Dendritic Cells Keratinocytes
T−Lymphocytes Dendritic Cells Keratinocytes
Figure 1: Time series solution for the variables in equa-tion (1) representing the masses of T-Lymphocytes (l), Dendritic Cells/ Macrophages (m) and Keratinocytes (k) with changing a and keeping other parameters at their standard values as in Table 1.
0 50 100 150
0 20 40 60 80 100 120 140 160 180 200
Time (days) (a)
Cell Densities ( mm
3)
b=5
0 50 100 150
0 50 100 150 200 250 300 350
b=9
Time (days) (b)
Cell Densities ( mm
3) T−Lymphocytes
Dendritic Cells Keratinocytes
T−Lymphocytes Dendritic Cells Keratinocytes
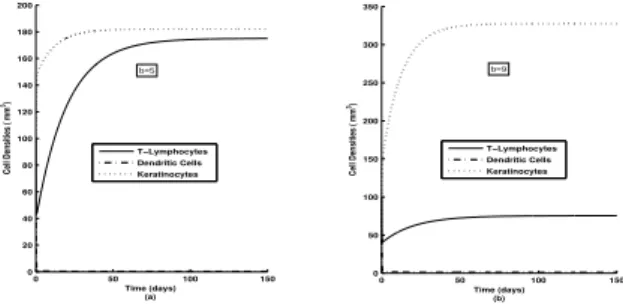
Figure 2: Plot of time series cell densities for l(t), m(t) and k(t) with changing b. Other parameters are as in Table 1.
that epidermal Keratinocytes in plaques produce an en-zyme called inducible nitric oxide synthase (iNOS) which is the major pathway of nitric oxide production.
In this paper, we focus on formulating a popula-tion/density type model involving different biological cells that are inherent in the chain of events, described so far, leading to psoriatic lesions on human skin. The math-ematical model of psoriatic pathogenesis actually consists of three differential equations involving the densities of T-lymphocytes, Dendritic Cells (or Tissue Macrophages) and Keratinocytes. As observed in the literature, T-cells and DC’s are locked in a cyclic interaction of mu-tual activation and such interaction, through an inter-mediate complex chemical process yields to the growth of epidermal Keratinocytes. It is to be noted here that while formulating the model an adhoc upstream accu-mulation of both T-cells and DC’s are considered at the relevant spatial region of dermal blood vessels and tis-sues. Since we focus our attention to the immunopatho-genesis of the diseases psoriasis we would remain content with the mentioned adhoc accumulation of the immune cells and proceed to study the dynamical behavior of the model system. We also explore the dependence of the dy-namical changes of model variables on various model pa-rameters. Analytical and numerical studies of the model would generate insights about the underlying dynamics of Keratinocyte proliferation leading to psoriatic
patho-genesis and would enable us to formulate systematic clin-ical treatment of psoriatic patient involving probably the suppression of T-lymphocytes or Macrophages/Dendritic Cells. Note that analogous views regarding the treatment of psoriasis are contemplated in the clinical research and are documented well in the literature [11].
The communication is framed as follows: In section 2, we describe the mathematical formulation of the model pre-cursor to immunopathogenesis in chronic plaque of psori-asis. In section 3 we do a theoretical analysis of the model focusing on its stability and allied characteristics. Results from global stability analysis of the model is presented in section 4. Section 5 includes results from numerical sim-ulation of the model equations. Finally, discussion and conclusion are given in section 6.
2
The Basic Assumptions and the
Math-ematical Model
Let us considerl(t) andm(t) to be the concentrations of T-cells and Macrophages or Dendritic Cells respectively at an instant of time t. Let us also consider k(t) to be the concentration of epidermal Keratinocytes at time t. Following assumptions are to be considered to lead the mathematical model.
(A1): We assume that influx or accumulation of lympho-cytic T-cells in the relevant spatial region of dermal layer of the skin is at a constant ratea. We also assume a sim-ilar accumulation of Dendritic Cells (Macrophages) at a constant rateb.
(A2): To be consistent with A1 it is imperative to as-sume that the T-cells and DC’s are not reproduced in any form or by any mechanism other than the constant accumulation or influx of them at the spatial region un-der consiun-deration.
(A3): We assume that the mutual interaction of stim-ulation/activation of T-cells and DC’s take place un-der mixing homogeneity of the cells. This mutual activation/stimulation mechanisms eventually yields to the growth of epidermal Keratinocyte concentration. This growth of Keratinocyte is assumed to be propor-tional to the product of instantaneous T-cells and DC (Macrophage) concentrations. In mathematical language this whole process of immune cell activation and enrich-ment of Keratinocyte concentration follows the law of mass action. Note that the fractions of T-cells and DC’s, once involved in mutual activation would be unavailable for further activation. A portion of these fractions is as-sumed to add to the Keratinocyte density.
makes their mobility significantly greater than that of DC (Macrophages).
(A5): We assume per capita loss of Keratinocyte mass denoted byλ(∈R+) by active production of nitric oxide through thei−N OSpathway [13]. The above assump-tionsA1−A5 lead us to formulate the model equations as
dl
dt =a−δlm−µl
dm
dt =b−βlm−µ
′
m dk
dt =ηlm−λk
(1)
Where the parameterδ(∈R+) denote the rate at which T-cell activates with their mutual counterpart Dendritic Cells or Macrophages. The parameter β is the rate of activation of DC’s (Macrophages) with the T-cells. η de-notes the proportion at which Keratinocyte concentration grows out of T-cells’ and DC’s (Macrophages) mutual ac-tivation.
3
Theoretical study of the system
3.1
Existence, Uniqueness and
Bounded-ness
The right hand side of equation (1) are smooth func-tions of the variables l, m, k and the model parameters. As long as these quantities are non-negative, local ex-istence, uniqueness and continuation properties hold in the positive octant. In the next theorem we show that the linear combination of accumulation of lymphocytic T-cells, accumulation of Dendritic Cells (Macrophages) and Keratinocyte concentration is less than a finite quantity which implies that the solution of the system is bounded.
Theorem 3.1. The solution y(t) of (1), where y =
(l, m, k), is uniformly bounded fory0∈R30,+.
Proof: We define a function W(t) : R0,+ → R0,+ by
W(t) =l+m+k
Observe thatW is well defined and differentiable on some maximal interval (0, tf). The time derivative of (1) is
dW(t)
dt = (a+b)−(δ+β−η)lm−µl−µ
′
m−λk
Now, for eachρ >0, the following inequality holds
dW(t)
dt +ρW(t)≤(a+b)−(δ+β−η)(
l2+m2
2 )−(µ−ρ)l
−(µ′−ρ)m−(λ−ρ)k
≤(a+b) +(µ−ρ)2+(µ′−ρ)2
2(δ+β−η) −(λ−ρ)k
If we assume that, 0< ρ < λ, then there existsB >0 such that dWdt(t) +ρW(t) ≤ B for each t ∈ (0, tf).
LetG(t, y) =B−ρy, which satisfies Lipschtiz condition everywhere. Clearly,
dW(t)
dt ≤B−ρW(t) =G(t, W(t)) for all t∈(0, tf).
Let, dx
dt =G(t, x) =B−ρx and x(0) =W(0) =W0.
This ordinary differential equation has the solution
x(t) =B
ρ(1−e−
ρt) +W
0e−ρt
0 50 100 150 200 250 300
0 50 100 150 200 250 300 350 400 450
δ =0.05
Time (days) (a)
Cell densities ( mm
3)
0 50 100 150 200 250 300
0 50 100 150 200 250 300 350 400 450
δ = 0.5
Time (days) (b)
Cell Densities ( mm
3)
T−Lymphocytes Dendritic Cells Keratinocytes T−Lymphocytes
Dendritic Cells Keratinocytes
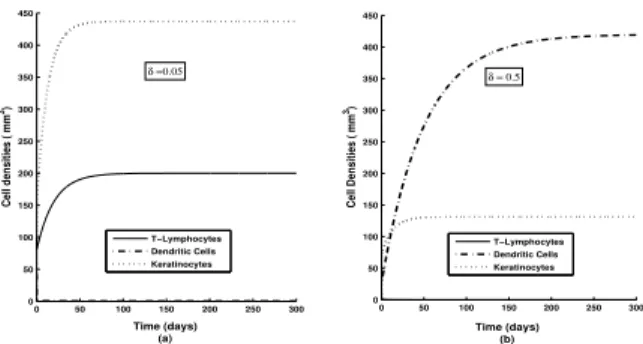
Figure 3: Time series solutions of different masses with changing δ, the rate of activation of T-cells by DCs. Other parameters are as in Table 1.
It is clear thatx(t) is bounded on (0, tf). By comparison
theorem (Birkhoff and Rota (1989)
W(t)≤x(t) = B
ρ(1−e−
ρt) +W
0e−ρt ∀ t∈(0, tf).
Now suppose tf < ∞. Then W(tf) ≤ x(tf) < ∞,
but then the solution exists uniquely for some interval (0, tf) by the Picard-Lindelof Theorem. This contradicts
the supposition that tf < ∞. Therefore W(t) must be
bounded for all non-negativetand thusy(t) is uniformly bounded onR0,+.
3.2
Equilibria
The model equation (1) may has the following equilibria on all the co-ordinate planes either (i)E1(l∗
1,0,0) where
l∗
1 = βaµβ−bδ or (ii) E2(0, m∗2,0) where m∗2 = bδµ−′βaδ and (iii)E∗(l∗, m∗, k∗) where k∗= ηl∗m∗
λ , m∗=
b
βl∗+µ′, and
l∗ is the positive root of
µβ(l∗)2+ (δb+µµ′−aβ)l∗−aµ′ = 0 (2)
Note that equation (2) has a unique positive root, given by
l∗=−(δb+µµ
′
−aβ) +p
(δb+µµ′ −
aβ)2+ 4aβµµ′
2µβ
(3) The existence condition for the interior equilibrium, E∗
isδb+µµ′ > aβand that of E1andE2 are according as
βa−bδ >0 or<0.
Biological Interpretation: The existence of interior
0 50 100 150 0
50 100 150 200 250 300 350 400 450
Time (days) (a)
Cell Densities ( mm
3)
β=0.05
0 50 100 150
0 50 100 150 200 250
β=0.25
Time (days) (b)
Cell Densities ( mm
3)
T−Lymphocytes Dendritic Cells Keratinocytes T−Lymphocytes
Dendritic Cells Keratonocytes
Figure 4: Time series solution of different masses l(t),
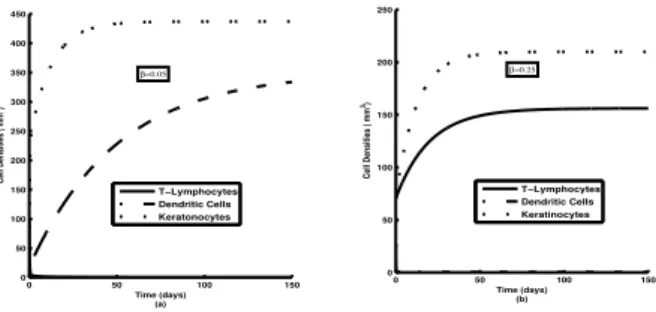
m(t) andk(t) changingβ, the rate of activation of DCs with T-cells.
3.3
Local Stability Analysis
The variational matrix about any arbitrary equilibrium
E(l, m, k) is given by
−δm−µ −δl 0
−βm −βl−µ′ 0
ηm ηl −λ
Theorem 3.3.1 The system (1) is locally asymptotically
stable aroundE1 if βa > δb.
Proof: The eigenvalues of the corresponding variational
matrix are
ξ1=−µ, ξ2=−(βl∗1+µ
′
), ξ3=−λ
From the existence condition ofE1, all the characteristic roots corresponding to E1 are negative, and hence with the existence condition of E1 the system (1) is locally asymptotically stable aroundE1.
Theorem 3.3.2The system (1) is locally asymptotically
stable aroundE2 if βa < δb.
Proof: The eigenvalues of the corresponding variational
matrix are
ξ1=−µ
′
, ξ2=−(δm∗2+µ), ξ3=−λ
From the existence condition ofE2, all the characteristic roots corresponding to E2 are negative, and hence with the existence condition of E2 the system (1) is locally asymptotically stable aroundE2.
Theorem 3.3.3The system (1) is locally asymptotically
stable aroundE∗.
Proof: The characteristic equation corresponding to
the variational matrix of E∗ can be put in the form
ξ3+A1ξ2+A2ξ+A3= 0
A1=δm∗+βl∗+λ+µ+µ
′
A2=δµ
′
m∗+βµl∗+λβl∗+λδm∗+µµ′+λµ+λµ′
A3=δλm∗µ
′
+βλµl∗+µµ′λ
From Routh-Hurwitz criterion, E∗ is locally
asymptoti-cally stable if and only if
A1>0, A3>0 andA1A2−A3>0.
Considering the existence condition of E∗, we can state
that the system is locally asymptotically stable around
E∗.
Table.1. Values of parameters used for models dynamics
calculations.
Para- Definition Default
meter Value
(day−1 )
a Rate of influx of T-cells 15mm−3 Day−1
b Rate of influx of DCs 12mm−3 Day−1
δ Rate of activation oflbym 0.15mm3 Day−1
β Rate of activation ofmbyl 0.12mm3 Day−1
η Growth rate of Keratinocytes 0.35mm3 Day−1
µ Per capita removal of T-cells 0.05 Day−1
µ′ Per capita removal of DCs 0.02 Day−1
λ Decay rate of Keratinocytes 0.08 Day−1
3.4
Global Stability Analysis
We consider the system (1) and we denote the nontrivial equilibrium of (1) by E∗ = (l∗, m∗, k∗) > 0. We shall
prove the global stability of system (1) by constructing a suitable Lyapunov function.
Theorem 3.4.1 The interior equilibrium point E∗ is
asymptotically stable if
(i) µ+δm >0
(ii) 4(µ+δm)(βl∗+µ′)>(δl∗+βm)2
(iii) detA >0
A=
µ+δm (δl∗+2βm) −ηm
2
δl∗+βm
2 βl∗+µ ′
−ηl2∗
−ηm2 −ηl2∗ λ
Proof: We define the positive definite functionV(l, m, k)
as V(l, m, k) =12[(l−l∗)2+ (m−m∗)2+ (k−k∗)2].
It can be easily verified that the functionV is zero at the equilibrium (l∗, m∗, k∗) and positive for all other positive
real values of l,m andk. The time derivative along the solutions of (1) is
˙
V = (l−l∗) ˙l+ (m−m∗) ˙m+ (k−k∗) ˙k
=−(l−l∗)2(µ+δm)−(m−m∗)2(βl∗+µ′)
−(k−k∗)2λ−(l−l∗)(m−m∗)(δl∗+βm)
+ (k−k∗)(m−m∗)ηl∗+ (k−k∗)(l−l∗)ηm
The above equation should be considered as quadratic form in the variables (l−l∗), (m−m∗) and (k−k∗),
which is negative definite if the above conditions does hold.
4
Numerical simulation
0 50 100 150 200 0
20 40 60 80 100 120 140
Time (days) (a)
Cel Densities ( mm
3)
η = 0.1
0 50 100 150 200
0 100 200 300 400 500 600 700 800
η = 0.6
Time (days) (b)
Cell Densities ( mm
3)
0 50 100 150 200
0 200 400 600 800 1000 1200 1400
η = 1.0
Time (days) (c)
Cell Densities ( mm
3)
T−Lymphocytes Dendritic Cells Keratinocytes
T−Lymphocytes Dendritic Cells Keratinocytes
T−Lymphocytes Dendritic Cells Keratinocytes
Figure 5: Time varying solutions of different variables
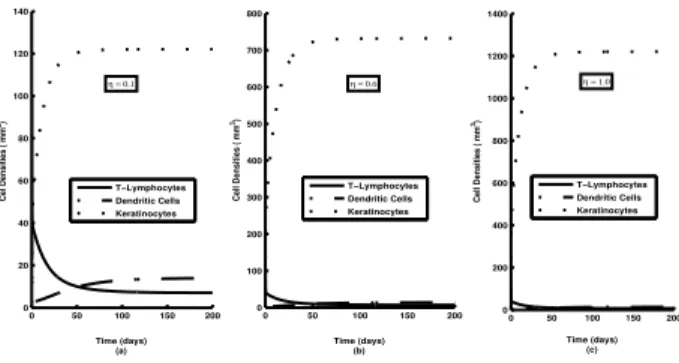
l(t),m(t) andk(t) as in equation (1) for different values of theη, the growth rate of Keratinocyte density. Other parameters are as in Table 1.
of the model equations. For the purpose numerical values of the model parameters are standardized based on avail-able clinical data, reflections from analytical solutions of the model systems and by exploring the preliminary nu-merical solutions of the equations. The model parame-ters, as standardized, are given in Table.1. Initial values of the variables are chosen as l(0) = 100, m(0) = 50,
k(0) = 2.
In Figure 1, we see that with the increase of accumulation rate of T-Lymphocytes (a) the asymptotic stable values of lymphocyte mass (l) goes up and this inflicts a strong upward change to the asymptotic value of Keratinocyte mass (k). We observe in Figure 2, that a lowering of ac-cumulation rate of DCs/Macrophage (b) inflicts a similar lowering of Keratinocyte growth. Asymptotically all the variables (cell densities) assume their respective stable values. We see in Figure 3 that with the increase rate of activation of T-Lymphocytes by DCs (δ) asymptotic sta-ble values ofl gets progressively degraded. This in turn, reduces the asymptotic stable value of Keratinocyte mass. Figure 4, shows that an increase rate of activation of DCs by T-Lymphocytes (β) inflicts a degradation in the stable value of m (Dendritic Cells/Macrophage density). This degradation in m causes a reduction in the stable value of Keratinocyte density in the system. Figure 5 reflects clearly that the qualitative features of time variation of different masses do not suffer any significant change with the variation of Growth rate of Keratinocytes (η). The increase ofηreduces the asymptotic stable value ofland
msignificantly and cause a strong upward change to the asymptotic value of (k).
The mesh diagram (see Fig 6) of the model, plotted in thea-δ-b parametric space, keeping all other parameters as in table 1, gives the surface above which the interior equilibrium of the system of psoriatic pathogenesis exists and stable, and below the surface interior equilibrium does not exists. With the increase ofband δthe system undergoes towards the stable region.
5 10 15 0 0.05 0.1 0.15 0.2 0.25 0.3 0.35 0.4 0.45 0.5 0
20 40 60 80 100 120 140 160 180
a
b
In this region E* does not
exist
Stable region for E*
δ
Figure 6: Graphical representation of existence and sta-bility condition of E∗ in a-δ-b parametric space with
β = 0.12,µ= 0.05 andµ′ = 0.02.
5
Discussion and conclusion
We have considered a mathematical model to study the dynamical behaviour of immunopathogenesis in chronic plaque of psoriasis in human skin. In order to study the detailed dynamical progression of the model variables representing different cell densities, we performed both analytical and numerical techniques.
In the analytical study, we focus on the qualitative as-pects within the model. In our analytical study we observe that the existence, uniqueness and bounded-ness of the solutions of the dynamical variables l (T-Lymphocyte),m(DCs/Macrophages),k(Keratinocytes) holds in the positive octant where we assume all the model parameters are non-negative. Our analytical study shows that the multiplicative combination of the accumu-lation rate of T-cells and the activation rate of DCs with T-cells is less than the additive effects of two terms, one term being the activation rate of T-cells with DCs multi-plied by activation rate of DCs and the other term being per capita removal of T-cells by natural processes mul-tiplied by that of the DCs (Macrophage) for existence and stability of the interior equilibrium point. We find the condition under which the solution of the system be-comes globally stable.
In our numerical studies we considered the variation in the model parameters to observe their effect on the model variables. We find that a lowering in the accumulation rate of T-cells make the Keratinocyte growth as well as the asymptotic value of T-lymphocyte density low-ered. However, such lowering of the parameter accu-mulation rate of T-Lymphocytes a (accumulation rate of T-Lymphocytes) favors the growth of Dendritic Cells whose asymptotic stable value gets increased. This im-plies that a lowering in the parameter a progressively lowers the stable Keratinocyte density and the psoriatic pathogenesis may suffer a roll-back at small values of
T-lymphocyte density gets a significant boost. Thus, one may conclude that a roll-back from pathogenesis is pos-sible for very small value of the parameterb (rate of ac-cumulation of DCs/Macrophage). Note that in all this cases the asymptotic cell densities are single valued and stable.
Time series solutions of model variables, plotted for var-ious values of δ show that a decreasingδ drastically en-hances the asymptotic value of T-lymphocyte density and lowers that of DCs/Macrophages. The Keratinocyte den-sity suffers a moderate enhancement with the decreas-ing δ and it implies a stronger pathogenesis (see Fig 3). With lower value of β the asymptotic stable value of T-lymphocyte density suffers considerable abasement whereas that of DCs/Macrophages gets enhanced mod-erately. It is observed that the asymptotic Keratinocyte density towards lower β rises, again implying a progres-sively stronger pathogenesis (see Fig 4). A change in η
towards higher values, seems not to perturb much the asymptotic values of model variables as apparent in Fig 5, even the asymptotic values of l and m remain nearly unchanged for varying η. Clearly the asymptotic values of all three variablesl,mandkare not controlled by the Keratinocyte growth rate η. This is plausible from the structure of the model equations where the Keratinocyte density gets enriched only when the activation of l and
mare in excess ofη.
To understand how different model parameters control the dynamical behaviour of the system of psoriatic patho-genesis, existence condition of the system and stable cri-terion of the interior equilibrium E∗, we look into the
mesh diagram in the parametric space a-δ-b. Our ana-lytical and numerical study are reflected through mesh diagram (Figure 6) which depicts the region where the interior equilibrium point E∗ exists and stable in the
a-δ-b parametric space. In the lower part of the sur-face the interior equilibrium does not exist. With the increasing rate of accumulation of DCs/Macrophages the system moves towards stable region. On the other hand the system gives a similar behaviour with the enhance value of the activation of T-Lymphocytes by DCs/Macrophages. However the change of accumulation rate of T-Lymphocytes does not affect the nature of the system of psoriatic pathogenesis significantly. Our nu-merical analysis reveal that the pathogenesis of the pso-riatic lesions become more stable towards the higher value of the rate of accumulation of DCs/Macrophages and the activation of T-Lymphocytes by DCs/Macrophages.
Acknowledgments: Its a pleasure to acknowledge Dr.
Manoj Kar, Department of Biochemistry, NRS Medical College and Hospital, Kolkata, West Bengal, India for useful discussions.
References
[1] Schon, M.P., Detmar, M., and Parker, C.M., D., “Murine Psoriasis-like disorder induced by naive CD4+T cells”,Nat. Med., 1997, 3, pp. 183-188.
[2] Espinoza, L. R., Cuellar, M.L., and Silveira, L.H., “Psoriatic Arthritis”,Curr. Opin. Rheumatol., 1992,
4, pp. 470-478.
[3] Lebwohl, M., “Psoriasis”, Lancet, 2003 361, pp. 1197-1204.
[4] Krogstad, A.L., Swanbeck, G., and Wallin, B.J., “Axon reflex mediated vasodilation in the psoriatic plaque”, J. Invest, Dermatol, 1995, 104, pp. 872-876.
[5] Vladirmirsson, H., Baker, B.S., Jondottir, I., “Pso-riasis: a disease of abnormal proliferation induced by T lymphocytes”, Immunol. Today, 1986, 7, pp. 256-259.
[6] Baker, B.S. and Fry, L. “The immunology of psoria-sis”,Br.J.Dermatology, 1992,126, pp. 1-9.
[7] Griffiths, T.W., Griffiths, C.E.M. and Voorhees,J.J. “Immunopathogenesis and immunotherapy of psori-asis”,Dermatol. Clin, 1995,13, pp. 739-749.
[8] Eddy, D.J., Burrows, D., Bridges, J.M., “Clearance of severe psoriasis after allogenic bone marrow trans-plantation”,Br. Med. J., 1990,300, p. 908.
[9] Snowden, J.A. and Heaton, D.C. “Development of psoriasis after syngeneic bone marrow transplant from psoriatic donor: further evidence for adoptive autoimmunity”, Br.J.Dermatology., 1997, 137, pp. 130-132.
[10] Jariwala, S.P. “The role of Dendritic Cells in the immunopathogenesis of psoriasis”,Arch. Dermatol., 2007,299, pp. 359-366.
[11] Sherratt, J.A., Weller, R., Savill, N.J., “Modelling Blood Flow Regulation by Nitric Oxide in Psoriatic Plaques”, Bulle. of Math. Biol., 2002, 64, pp. 623-641.
[12] Kolb-Bachofen, V., Fehsel, K., Michel, G. and Ruz-icka, T., “Epidermal Keratinocyte expression of in-ducible niyric oxide synthase in skin lesions of pso-riasis vulgaris”,Lancet, 1994,344, p. 139.
[13] Savill, N.J., Weller, R. and Sherratt, J.A., “Mathe-matical Modelling of Nitric Oxide Regulation of Rete Peg Formation in Psoriasis”,J. of Theor. Biol., 2002,