Original Article
Optimal Wavelength Selection in Ultraviolet Spectroscopy for the Estimation of
Toxin Reduction Ratio during Hemodialysis
Amir Ghanifar1*, Vahid Reza Nafisi1
Abstract
Introduction
The concentration of substances, including urea, creatinine, and uric acid, can be used as an index to measure toxic uremic solutes in the blood during dialysis and interdialytic intervals. The on-line monitoring of toxin concentration allows for the clearance measurement of some low-molecular-weight solutes at any time during hemodialysis.The aim of this study was to determine the optimal wavelength for estimating the changes in urea, creatinine, and uric acid in dialysate, using ultraviolet (UV) spectroscopy.
Materials and Methods
In this study, nine uremic patients were investigated, using on-line spectrophotometry. The on-line absorption measurements (UV radiation) were performed with a spectrophotometer module, connected to the fluid outlet of the dialysis machine. Dialysate samples were obtained and analyzed, using standard biochemical methods. Optimal wavelengths for both creatinine and uric acid were selected by using a combination of genetic algorithms (GAs), i.e., GA-partial least squares (GA-PLS) and interval partial least squares (iPLS).
Results
The Artifitial Neural Network (ANN) sensitivity analysis determined the wavelengths of the UV band most suitable for estimating the concentration of creatinine and uric acid. The two optimal wavelengths were 242 and 252 nm for creatinine and 295 and 298 nm for uric acid.
Conclusion
It can be concluded that the reduction ratio of creatinine and uric acid (dialysis efficiency) could be continuously monitored during hemodialysis by UV spectroscopy.Compared to the conventional method, which is particularly sensitive to the sampling technique and involves post-dialysis blood sampling, iterative measurements throughout the dialysis session can yield more reliable data.
Keywords: Genetic Algorithm, Hemodialysis Efficiency, Neural Network Models, UV Absorption
1- Electrical and Information Technology Department, Iranian Research Organization for Science and Technology (IROST), Tehran, Iran.
1. Introduction
Hemodialysis is the most common treatment for renal dysfunction in end-stage renal disease (ESRD). This procedure uses a dialyzer to gradually remove low-molecular-weight toxins, based on the concentration gradient between the blood and dialysis fluid. Typically, each dialysis session takes three to four hours; also, to ensure the desired effect, dialysis should be repeated every two days. The amount of dialysis received by the patients has a major impact on their general health and mortality [1, 2].
Continuous on-line monitoring of urea, removed during dialysis, is recognized as the first step towards improving treatment efficiency [2, 3]. Blood sampling has been the main source of information concerning the efficiency of dialysis treatment. The common procedure for monitoring the efficiency of hemodialysis is to collect pre- and post-dialysis blood samples. Then, urea concentration is measured in the samples, and the urea reduction ratio (RR) is calculated. Urea itself does not exhibit toxic properties at concentrations found in the blood samples of dialysis patients [4]. Urea level only represents the removal of many uremic toxins as a group of protein-bound and middle molecules [5]. Creatinine is another waste product, retained from uremic patients, which is removed from the blood through hemodialysis [6].
A principle for monitoring non-invasive dialysis adequacy has been proposed by Gal et al. [7]. Two optical techniques, namely UV absorbance and near-infrared (NIR) techniques, have shown some progress towards clinical application over the past decade [8]. In fact, the NIR technique can directly measure urea through signal processing of raw NIR spectra [8, 9].
A significant correlation has been found between UV absorbance and concentration of several removed small waste solutes, such as urea, creatinine, and uric acid [10]. On the other hand, some off-line studies have indicated no correlation between urea concentration and UV absorption, whereas stable and reproducible UV
absorption has been observed in creatinine and uric acid [11, 12].
Urea is not easily detected through UV absorbance measurement, while urea in dialysate is closely correlated with absorbance values. It seems that this correlation is induced by substances with a removal profile similar to urea [13]. In the literature, the significant contribution of creatinine, uric acid, and phosphate to absorbance values has been reported [14].
On the other hand, there are other materials in the spent dialysate, which are absorbed in the UV band, thus leading to possible errors [15, 16]. To the best of our knowledge, no equipments have been developed so far for the efficacy measurement of dialysis treatment, based on the UV absorption of waste products in the dialysate.
With this background in mind, in the present study, we aimed to detect the optimal UV wavelength for RR measurement of toxin concentration during hemodialysis. The decline in uremic retention solutes was regarded as RR and was used as an index for dialysis efficiency. On the other hand, RR is a normalized parameter, which can be applied as a solution for reducing the discussed error. We also tried to measure RR for three main toxins (i.e., urea, creatinine, and uric acid) in the spent dialysate through UV spectroscopy as the basis for the real-time monitoring device.
2. Materials and Methods
In the present study, we performed off-line and on-line UV absorbance analyses. The off-line measurements were performed in the laboratory to evaluate the absorption wavelength of urea. A hemodialysis machine was used for the on-line measurement of the spent dialysate.
absorbance method cannot measure urea as a single solute. Therefore, in the remainder of the study, we only investigated the optimal wavelength for creatinine and uric acid.
2.2. Patients and Clinical Setup
A total of nine uremic patients, including two females and seven males, on thrice-weekly hemodialysis were studied at Imam Ali Hospital in Qods city, Tehran, Iran. The selected patients used drugs which are normally prescribed for dialysis patients. Treatment duration ranged from 240 to 300 min, and the dialysate flow was fixed at 500 ml/min. The dialysate temperature ranged between 28 and 32°C.
Two different polysulfone dialysers were used, i.e., PS10 and PS13 (Meditechsys Co., Iran) with the effective membrane areas of 1.0 and
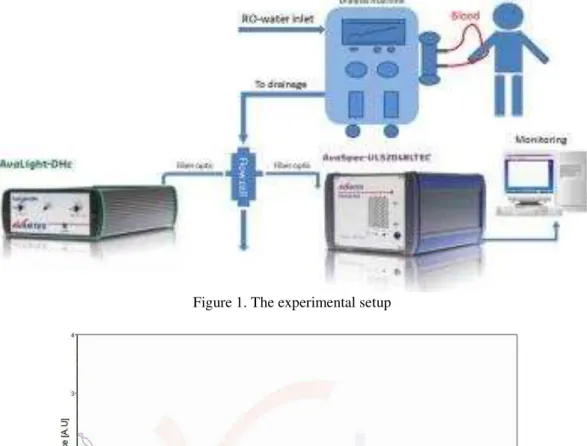
1.3 m2, respectively. The type of hemodialysis machine was ATF-1022 (Arya Teb Firouz Co., Iran). The clinical setup of the experiments is presented in Figure 1. The setup equipment was connected to the drain hose end of the dialysis machine; therefore, it imposed no restrictions and could be used on any hemodialysis machine. At the end of each dialysis session, this equipment, along with the hemodialysis machine, was disinfected. Samples of the spent dialysate were collected at 5, 15, 30, 60, and 120 min intervals after the start of dialysis treatment and at the end of the dialysis session. The concentrations of urea, creatinine, and uric acid were determined at Ana Medical Laboratory (Tehran, Iran), using standard conventional methods.
Figure 1. The experimental setup
2.3. Data collection
The absorption spectra were collected at 199– 750 nm wavelengths by Avantes UV/VIS spectrometer (AvaSpec-ULS 2048 TEC; resolution: 0.29 nm). The spectrometer and deuterium halogen light source (AvaLight-DHc) were connected by optical fibers to a flow cell. The detector was equipped with a standard linear array charge-coupled device (CCD; 2048 pixels). For the on-line measurements, the flow cell with a path length of 10 mm, consisting of 2 UV/VIS lenses, was used. During the on-line experiments, the flow cell was connected to the fluid outlet of the dialysis machine, and all the spent dialysate passed through it.
The absorbance spectra of the effluent dialysate, collected during the dialysis session, showed a small peak at 290 nm and a large peak at 240 nm. At wavelengths below 240 nm, numerous changes were observed in the spectra, and the profile in this region was unstable. However, at a wavelength of 240-310 nm, the profile remained stable with a consistent absorbance decrement during the dialysis session (Figure 2).
2.4. RR Estimation
The decline in uremic retention solutes was regarded as RR. The RR(t) of a compound was defined as a function of pre-dialysis concentration (Cpre) and concentration at each
time (Ct):
� =����� − ��
��� %
2.5. Data Analysis
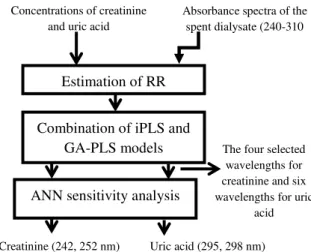
The block diagram of the method is presented in Figure 3:
The combination of genetic algorithm-partial least squares (GA-PLS) and interval partial least squares (iPLS) models was applied to the UV spectrum dataset of the spent dialysate. The GA-PLS method selected four wavelengths for creatinine and six wavelengths for uric acid. In this study, we used sensitivity analysis to determine which wavelengths are most sensitive to the RR of creatinine and uric acid. These methods (i.e., iPLS, GA-PLS, and artificial neural network or ANN) were implemented by MATLAB
Software Version 7.6 (R2011b, MathWorks). For ANN sensitivity analysis, NeuroSolutions version 5 and Excel 2007 were used.
Figure 3. The block diagram of the method
2.5.1. iPLS Method
The iPLS method calculates the local PLS models on equidistant subintervals of the full-spectrum region. The main advantage of this method is an overall graphical illustration of
the variation in ‘X’, which is relevant to the dependent variable ‘Y’. The iPLS models are often developed on spectral subintervals of equal widths, and the predictive performances of all local models, as well as the global full-spectrum model, are compared. The model comparison is based on the validation parameter, i.e., the root mean square error of cross-validation (RMSECV) for a given validation scheme [17].
2.5.2. GA-PLS Method
GAs are powerful tools for detecting the most relevant spectral regions in multivariate calibration. Good performance of GA-PLS, as a tool for wavelength selection, has been demonstrated in the literature [18, 19].
2.5.3. Combination of iPLS and GA-PLS Models
The combination of iPLS and GA-PLS models has been applied to the UV spectrum dataset of the spent dialysate. Two models were used to determine the optimal wavelength for calculating the RR of creatinine and uric acid. Initially, the iPLS model was applied and RMSECV for 20-interval model was
Concentrations of creatinine and uric acid
Absorbance spectra of the spent dialysate (240-310
nm)
The four selected wavelengths for creatinine and six wavelengths for uric
acid
Uric acid (295, 298 nm) Creatinine (242, 252 nm)
Estimation of RR
Combination of iPLS and GA-PLS models
determined. The wavelength intervals, which had an RMSECV below the threshold, were applied in the GA-PLS model. GA-PLS was then used on these spectral regions with the goal of refining the model [20].
2.5.4. ANN Sensitivity Analysis
Sensitivity analysis aims to describe the extent to which the model output is affected by changes in the model input. In the present study, sensitivity analysis was used for selecting the major features of the input space. Therefore, sensitivity of the input variable was a partial derivative of the network model output with respect to the input variable. The neural network model of the input features could be used for assessing the influence of each input variable on the value of the output variable of the model. The sensitivity of the input is defined by Equation 2 [21]:
� = ∑� �
�
����
�
where N is the total number of variables, p denotes the pattern number, Okp is the output
value of ANN for pattern ‘p’, and xip is the
input value from pattern ‘p’.
Two ANN nets were used to estimate the RR of creatinine and uric acid. The wavelengths selected by GA-PLS were used as the input to neural networks. The selected neural network was a multilayer perceptron, with one input layer, one hidden layer, and one output layer. The ANN was trained with a modified back propagation algorithm.
The available dataset was divided into three subsets. The first subset was the training set (70% of the samples), the second subset was the validation set (15% of the samples; error on the validation set was monitored during the training process), and the third subset was the test set (15% of the samples).
3. Results
The data collected from the on-line measurements were analyzed, based on the block diagram presented in Figure 3. The results for each segment were separately investigated.
3.1. GA-PLS method
The quality of the model was evaluated by the RMSECV of the reference and prediction sets. The RMSECV was calculated as follows:
) 3 ( 1
2 ^
n n
i i
y i y
RMSECV
Where n is the number of samples, and yi and ŷi are the reference and predicted
values of the sample i, respectively. The optimal number of PLS latent variables was determined on the basis of RMSECV.
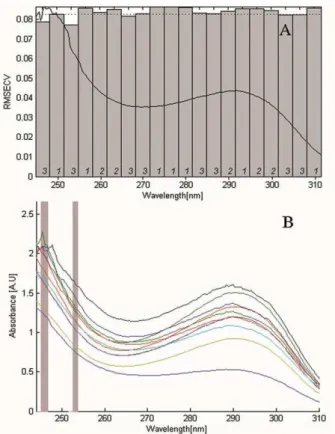
For creatinine, iPLS consisting of 30 runs was performed with 20 intervals and four components for each number of intervals. Figure 4A, which demonstrates the central iPLS plots, shows the RMSECV for the 20-interval model (bars) and the full-spectrum model (line), plotted together with a normalized mean spectrum.
Figure 4. The UV spectra for creatinine. A) RMSECV for the 20-interval model (bars) and the full-spectrum model (line) (the value was normalized); B) Location of regions selected by the GA-PLS model (bars).
RMSECV below the threshold value. Therefore, the GA-PLS model, consisting of 100 runs, was applied to these wavelengths; the GA-PLS results are presented in Figure 4B. The GA-PLS model selected four wavelengths of 242, 243, 252, and 253 nm, respectively (RMSECV= 0.28).
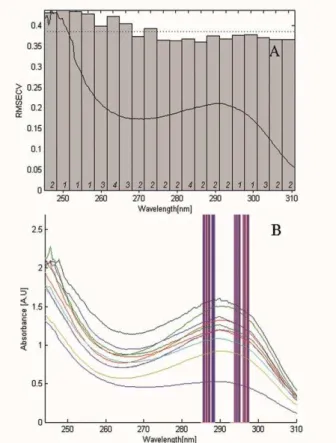
For uric acid, the iPLS method was performed with the same structure as previously described. Figure 5A, which demonstrates the central iPLS plots, shows the expected error of prediction (RMSECV) for the 20-interval model and the full-spectrum model. By applying iPLS, a wavelength range of 268–310 nm, which was below the threshold value, was selected and applied to the GA-PLS model. The results of GA-PLS for the selected interval by iPLS are presented in Figure 5B.
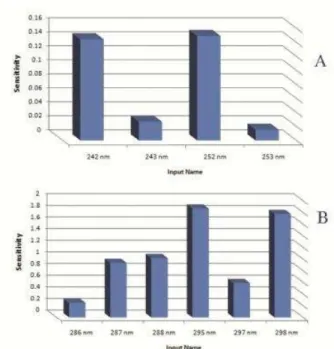
3.2. ANN sensitivity analysis
This study used sensitivity analysis to determine which wavelengths are most sensitive to the RR of creatinine and uric acid. Consequently, ANN sensitivity analysis was applied to the nets previously obtained. Based on the findings, 242 and 252 nm wavelengths were most sensitive to RR estimation of creatinine (Figure 6A). Also, the results of ANN sensitivity analysis for uric acid are presented in Figure 6B. The
wavelengths of 295 and 298 nm were most sensitive to RR estimation of uric acid.
Figure 5. The response of UV spectra for uric acid. A) RMSECV for the 20-interval model (bars) and full-spectrum model (line), (the value was normalized); B) Location of regions selected by the GA-PLS model (bars).
Table 1. Comparison of selected wavelengths and RMSECV on data set.
Creatinine Uric acid
Model Selected
wavelengths (nm) RMSECV
Selected
wavelengths (nm) RMSECV
iPLS a 240-255 0.08 268 – 310 0.38
GA–PLS b
242 ,243
0.028
286 , 287
0.35
252 ,253 288 , 295
297 , 298 a
iPLS: Creatinine=3 LV᾿s , Uric acid = 5 LV᾿s (LV = Latent Variable) b
GA–PLS: Creatinine=6
Figure 6. Sensitivity analysis. A) Diagram of the importance of each wavelength for creatinine estimation; B) Diagram of the importance of each wavelength for uric acid estimation.
4. Discussion
Dialysis efficiency and quality are important issues in optimizing treatment outcomes for ESRD patients. In this regard, on-line monitoring of the dialysis dose has been suggested as an effective strategy to improve treatment quality. Dialysis adequacy refers to the provision of a sufficient amount of dialysis treatment to keep the patient healthy and functional. The goal of a qualitative treatment approach in dialysis is to prevent complications due to uremic toxicity. The efficiency of a dialysis session has been measured through determining the concentration of uremic toxins, measured before and after the dialysis session.
Urea is a classic marker of dialysis dose and adequacy. Uric acid is one of the biomolecules in the body fluid, which is excreted through the kidneys; therefore, in renal failure, its concentration increases in the blood [22, 23]. On-line methods are considered to be more accurate than methods based on pre- and post-dialysis urea concentrations and have been found to be better suited to clinical routines. Other parameters should be also considered to provide adequate dialysis for the treatment of
dialysis patients. These parameters include volume status, blood pressure control, nutrition, and anemia correction [24, 25]. Also, creatinine level is known as a reference parameter for the removal of non-toxic, water-soluble, low-molecular-weight waste [26]. Optical measurement techniques are non-contact, non-destructive, and reagent-less, thereby permitting on-line analyses. A significant correlation has been shown between UV absorbance and concentration of several solutes, both in the spent dialysate and blood of dialysis patients [27, 28]. Basically, the proposed optical approaches consist of spectrophotometric sensors for the total absorbance measurement of waste products in the dialysate.
The total UV absorbance of the spent dialysate could act as an efficient indicator of dialysis adequacy [24, 25]. In fact, the total UV absorbance reflects the overall retention of accumulated solutes, such as urea, creatinine, potassium, phosphate, and uric acid [27]. In this paper, we attempted to determine the optimal wavelength which could represent the RR of creatinine and uric acid in the spent dialysate. The present research showed that UV spectroscopy can be used to measure the concentration of creatinine and uric acid within the chemical matrix of dialysate fluid. The optimal wavelengths for creatinine and uric acid were selected by using a combination of iPLS and GA-PLS methods. By removing the non-informative regions, iPLS could thereby significantly diminish the number of variables. The subsequent application of GA-PLS to this reduced domain could provide highly efficient and refined models. The GA-PLS method selected four wavelengths of 242, 243, 252, and 253 nm for creatinine and six wavelengths of 286, 287, 288, 295, 297, and 298 nm for uric acid, respectively.
input variable on the value of the output variable of the model. The wavelengths of 242 and 252 nm were most sensitive to the RR estimation of creatinine (error= 0.028), and the wavelengths of 295 and 298 nm were most sensitive to the RR estimation of uric acid (error= 0.35).
5. Conclusion
The elevation in creatinine and urea concentration is a marker of reduced glomerular filtration. An on-line monitoring system for dialysis dose calculation could help provide an adequate dialysis dose for hemodialysis patients. Optical techniques can be used to precisely measure the removal of several retained substances. A selected band of UV light is transmitted through the spent dialysate being tested, and the toxin concentration is measured by the analysis of
the resulting spectral information. This technique is a non-invasive method, permitting on-line measurements to identify any deviations in dialysis treatment. Moreover, deep UV light-emitting diodes have exhibited major potential in the development of optical dialysis adequacy sensors.
Acknowledgements
The authors wish to thank Arya Teb Firouz Co. and Ms. Sahar Abdollahi. We also extend our gratitude to the staff of Imam Ali Hospital in Qods city (Tehran, Iran) for their sincere cooperation. This study was supported by the Iranian Research Organization for Science and Technology (IROST) and Aryan Beris Company.
References
1. Kloppenburg WD, Stegeman CA, Hooyschuur M, van der Ven J, de Jong PE , Huisman RM. Assessing dialysis adequacy and dietary intake in the individual hemodialysis patient. Kidney Int. 1999; 55(5):1961-9.
2. Lopot F, Kotyk P, Blha J. Analysis of the urea generation rate and the protein catabolic rate in hemodialyzed patients. Artif Organs. 1995; 19(8):832-6. DOI: 10.1111/j.1525-1594.1995.tb02436.x.
3. Collins AJ, Ma JZ, Umen A, Keshaviah P. Urea index and other predictors of hemodialysis patient survival. Am J Kidney Dis. 1994; 23(2):272-82. DOI: 10.1016/S0272-6386(12)80984-X. 4. Johnson W, Hagge W. Effects of urea loading in patients with far-advanced renal failure. Mayo
Clinic Proc. 1972; 47:21–9.
5. Krieter D, Hackl A. Protein-bound uraemic toxin removal in haemodialysis and post-dilution haemodiafiltration. Nephrology Dialysis Transplantation. 2010; 25(1):212-8. DOI: 10.1093/ndt/gfp437.
6. Tomson R , Fridolin I, Uhlin F, Holmar J, Lauri K, Luman M. Optical measurement of creatinine in spent dialysate. Clinical nephrology. 2013; 79(2):107-17. DOI: 10.5414/CN107338 .
7. Gal G, Grof J. Continuous UV photometric monitoring of the efficiency of hemodialysis. The International journal of artificial organs. 1980 Nov;3(6):338.
8. Eddy CV, Arnold MA. Near-infrared spectroscopy for measuring urea in hemodialysis fluids. Clinical chemistry .2001; 47(7): 1279-86.
9. Eddy CV, Flanigan M, et al. Near-Infrared Spectroscopic Measurement of Urea in Dialysate Samples Collected During Hemodialysis Treatments. Applied Spectroscopy. 2003; 57(10): 1230-6. DOI: 10.1366/000370203769699081.
10. Fridolin I, Lindberg LG. Online monitoring of solutes in dialysate using absorption of ultraviolet radiation wavelength dependence. Medical and Biological Engineering and Computing. 2003; 41(3):263-70. DOI: 10.1007/BF02348430 .
11. Canaud B, Bosc JY, Leblanc M et al. On-line dialysis quantification in acutely ill patients. ASAIO journal. 1998; 44(3):184-190. DOI: 10.1097/00002480-199805000-00012.
13. Pedrini LA, Zereik S, Rasmy S. Causes, kinetics and clinical implications of post-hemodialysis urea rebound. Kidney Int. 1988; 34(6): 817-24. DOI: 10.1038/ki.1988.255.
14. Donadio C, Calia D, Ghimenti S, Onor M, Colombini E, Fuoco R, Di Francesco F. Uric acid is the major determinant of absorbance in spent dialysate allowing spectrophotometric evaluation of dialysis dose. J Nephrol. 2014 Jun; 27(3):331-7.
15. Lauri K, Tanner R, Jerotskaja J, Luman M, Fridolin I. HPLC study of uremic fluids related to optical dialysis adequacy monitoring. Int J Artif Organs. 2010 Feb; 33(2):96-104.
16. Uhlin F, Fridolin I, Lindberg L, Magnusson M. Estimating total urea removal and protein catabolic rate by monitoring UV absorbance in spent dialysate. Nephrology Dialysis Transplantation. 2005; 20(11):2458-64. DOI: 10.1093/ndt/gfi026 .
17. Jensen PS, Bak J, Ladefoged S, Andersson Engels S, Friis- Hansen L. Online monitoring of urea concentration in dialysate with dual-beam Fourier-transform near-infrared spectroscopy. J Biomed Opt. 2004; 9(3):553-7. DOI: 10.1117/1.1689337.
18. Daugirdas JT, Smye SW. Effect of a two compartment distribution on apparent urea distribution volume. Kidney Int. 1997; 51(4): 1270-3. DOI: 10.1038/ki.1997.173.
19. Ghasemi J, Niazi A, Leardi R. Genetic-algorithm-based wavelength selection in multicomponent spectrophotometric determination by PLS: application on copper and zinc mixture. Talanta. 2003; 59(2):311-7. DOI: 10.1016/S0039-9140(02)00505-2.
20. Tu ZH, Ji BP, Meng CY, Zhu DZ, Shi BL, Qing ZS. Analysis of NIR characteristic wavelengths for apple flesh firmness based on GA and iPLS. Guang Pu Xue Yu Guang Pu Fen Xi. 2009; 29(10):2760-4.
21. Zeng X1, Yeung DS. Sensitivity analysis of multilayer perceptron to input and weight perturbations. IEEE Trans Neural Netw. 2001; 12(6):1358-66. DOI: 10.1109/72.963772.
22. Port FK, Ashby VB, Dhingra RK, Roys EC, Wolfe RA. Dialysis dose and body mass index are strongly associated with survival in hemodialysis patients. J Am Soc Nephrol. 2002; 13(4):1061-1066.
23. Donadio C , Calia D, Ghimenti S, Onor M, Colombini E, Fuoco R, Di Francesco F. Uric acid is the major determinant of absorbance in spent dialysate allowing spectrophotometric evaluation of dialysis dose . J Nephrol. 2014; 27(3):331-7.
24. Holmar J, Fridolin I, Uhlin F, Lauri K, LumanM. Optical method for cardiovascular risk marker uric acid removal assessment during dialysis. Scientific World Journal. 2012 May; 2012(2012). DOI: 10.1100/2012/506486 .
25. Jerotskaja J, Uhlin F, Fridolin I, Lauri K, Luman M, Fernström. Optical on-line monitoring of uric acid removal during dialysis. Blood Purification. 2010; 29(1):69-74. DOI: 10.1159/000264269. 26. Dash AK, Sawhney A. A simple LC method with UV detection for the analysis of creatine and
creatinine and its application to several creatine formulations. J Pharm Biomed Anal. 2002; 29(5):939-45.
27. Uhlin F, Fridolin I, Magnusson M, Lindberg L G. Dialysis dose (Kt/V) and the sensitivity of clearance variation using; on-line measurement of the UV-absorbance, ionic dialysance, dialysate-urea and blood dialysate-urea. Nephrol Dial Transplant. 2006; 21(8): 2225-31. DOI: 10.1093/ndt/gfl147. 28. Uhlin F , Fridolin I, Lindberg LG, Magnusson M. Estimation of delivered dialysis dose by